
Smarter by Design.Simpler for Business
Live Stats
What Is Live Stats?
Live Stats is the tab that shows the current state of a vService with the AGS access control enabled on a dashboard refreshed once a second. The uptime of the AGS engine, how the requests are separated by AGS, the open sessions, the authentication, CAPTCHA, multi-factor authentication and lockout counters together with the provider, channel and scope breakdowns are monitored live on a single screen.
The screen answers the question "what is happening right now?": when a brute force attempt starts, the rise of the failed login rate, which provider draws the attempts, at what rate the CAPTCHAs are answered correctly and in which scope the lockouts are opened are seen at the same time. When the value of a card changes, the card flashes with a short highlight and a direction arrow is displayed next to the value; a rising metric is shown with a green arrow and a falling one with a red arrow. The arrow disappears by itself after about one and a half seconds. Since two consecutive measurements are required for the comparison, in the instantaneous number cards the arrow is seen at the earliest in the second update, and in the rate cards in the third update, because the first measurement round reads -. The AGS Uptime card, which increases in every round, carries a permanent up arrow; the AGS Memory card does not mark the value change. Thus the operator looking at the screen notices what has changed before reading the numbers.
The live monitoring runs on the device itself: the data is read directly from the session store of the AGS engine and from the traffic engine, and no external collector, agent or analytics product is needed. The stream is established only while the screen is open; when it is passed to another tab or when the session is closed, the subscription is terminated and it leaves no additional load on the device.
1 s
Live Refresh
Data is refreshed once per second; the refresh interval is selected as 1, 5, 10 or 30 seconds
9 Sections
On a Single Screen
Frontend, Access, AGS Sessions, Authentication, Captcha, MFA, Lockouts, System and Storage
34
Cards
Four cards in Frontend, thirty cards in the AGS sections; all of the sections are displayed in every AGS-enabled vService
4 Tables
Breakdown Table
The authentication and CAPTCHA providers, the MFA channels and the lockout scopes
Share
Live Share
In every table the share of the row within the current total is shown in a separate column
Cluster
Dashboard per Device
In a cluster setup, the data of each device is shown in its own column, without being mixed
Separate Store
Counter per Device
The AGS counters are read from the own session store of every device; they are not added up between the devices
Built-in
It Does Not Require an Agent
The data is read directly from the AGS engine and from the traffic engine; no external collector is needed
Live Stats or Dashboard
The two screens use the same vocabulary but answer different questions. Live Stats shows the instantaneous state: the data is not stored, no time range is selected and what is seen on the screen is always "right now". The Dashboard, on the other hand, spreads the same metrics over time and archives them: the trend and the comparison looking back are made from there. The provider breakdowns are offered as a pie chart on the Dashboard and as a table on this screen.
On the dashboard there are only the AGS sections
This dashboard does not show the Source IP Statistics, Traffic Mirroring, Backend Services, Action Hits and Live Traffic sections on the Live Stats screen in the Load Balancer section; the session, queue, request, connection, data rate, TLS, compression, cache and WAF attack rate cards of the traffic engine; and the Backend Service timing and error cards. Even if the WAF or the Bot/DDoS protection is enabled in the vService, the sections of these modules are not located here. In the Frontend section only the uptime of the AGS engine together with the processor, memory and response time cards of the traffic engine remain; thus the session number and the uptime of the traffic engine are not confused with the numbers of AGS. For this reason the limit badges on the Load Balancer dashboard are not present on this dashboard either.
Accessing Live Stats
- Left Monitor Panel is opened.
- AGS-Enabled vServices is selected from the category tabs at the top left.
- The vServices defined on TR7 with AGS access control enabled are listed.
- The vService to be monitored is clicked; the screen opens with the Dashboard tab that carries the vService's name.
- On the screen that opens, the Live Stats tab is clicked.
The tab is displayed unconditionally to the users who have monitoring authorization in the Load Balancer area. The live stream starts the moment the screen is opened and the first data comes without waiting.
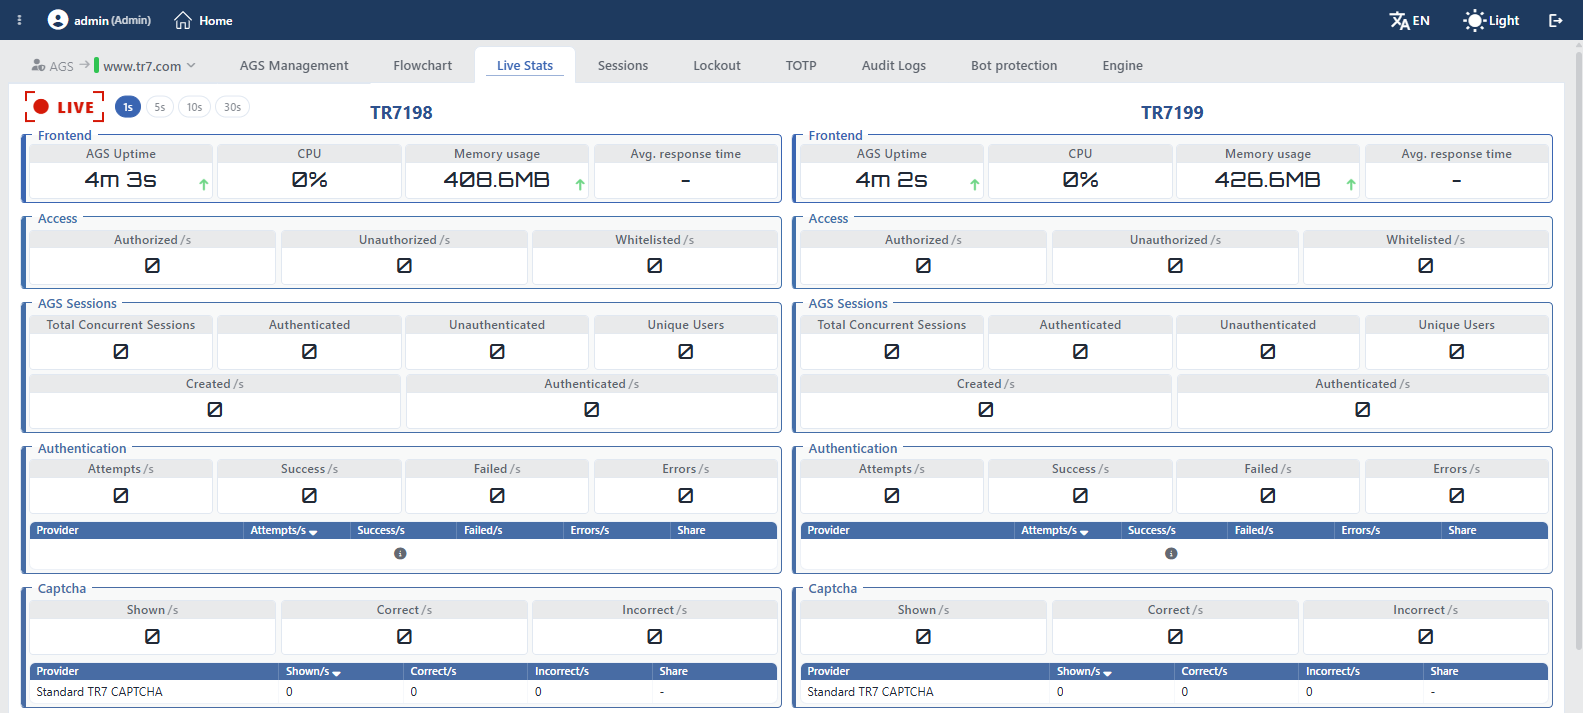 AGS Live Stats
Screen Controls
There are two controls at the top left of the dashboard:
- The LIVE indicator stops and restarts the stream. While there is no subscription a dim circle, when the screen is first opened a turning waiting mark until the data comes, and while the data is flowing a circle that beats like a pulse is displayed. When the indicator is turned off and on again, a stop mark is displayed until the first data comes.
- The refresh interval is selected with the 1s, 5s, 10s and 30s chips next to it; the default value is 1 second. The selection is stored per user and is used in common with the Load Balancer, WAF and Bot/DDoS live dashboards. When the interval is changed, the stream is re-established with a short interruption. At the first opening of the screen, when the LIVE indicator is turned on again and when the interval is changed, since there is no previous measurement to compare with, the AGS rate cards read
-in the first round. The Frontend cards and the cards that show instantaneous numbers (AGS Uptime, Total Concurrent Sessions, Authenticated, Unauthenticated, Unique Users, Active Lockouts, AGS Memory, Entries, Memory) are not affected.
Every section is recognized by a frame label located on its top edge and by a colored strip on its left edge. When the strip is hovered over, the name of the section and, in a cluster setup, the device name next to the name are displayed. The section colors are derived from the own accent color of the interface theme; for this reason the sections continue to be distinguished from each other when the theme changes. The cards are lined up inside the section by being divided into rows.
When a card is hovered over, the same card is highlighted in the column of the other device in a cluster setup as well. In the tables, when the title or a cell of a column is hovered over, only the column in that table becomes distinct; unlike the Load Balancer dashboard, on this dashboard there is no mutual highlighting between the cards and the table columns. A card tooltip is present only in the Avg. Response Time card. In the tables a direction arrow is displayed next to the cell whose value is different from the previous round as well; the arrow disappears when the value does not change in the next round. In the Share column there is no arrow.
In a cluster setup the dashboard shows every section in a separate column per device and the device names are located above the columns; the column on the left shows the device connected to and the column on the right the peer device. The session store of the AGS engine is separate on every device; the values are not added up between the devices and every device shows only the numbers of its own engine. Since the sections take as much space as their content widths, narrow sections can be lined up side by side in the same row according to the screen width; in that case the boxes in that row may not be aligned with the device titles above. In the last row of the image in the MFA section, the System sections of the two devices are displayed on the left half and the Storage sections of the two devices on the right half.
Duration of the live stream
A live stream session lasts about 30 minutes; since the duration check runs once per minute, the stream ends by itself between 30 and 31 minutes. The values on the screen stay as they were last read and are not refreshed.
The termination is not reported by the server and the indicator continues to look active; that the stream has ended is understood from the stopping of the values, of the card highlights and of the direction arrows. If the monitoring is to be continued, the page should be refreshed or the LIVE indicator should first be turned off and then on again. Changing the refresh interval re-establishes the stream as well and restarts this duration.
Frontend
In the section there are the uptime of the AGS engine together with the system cards belonging to the traffic engine of the vService.
| Card | What it shows |
|---|---|
| AGS Uptime | The uninterrupted uptime of the AGS engine. The value is written in steps according to the duration: below a minute seconds, below an hour minutes and seconds (e.g. 4m 3s); in longer durations the hour, day, month and year breakdowns are added. When the uptime information of the engine cannot be taken, the card reads 0; in that case the state of the engine should be verified from the Engine tab. |
| CPU | The instantaneous processor load of the traffic engine of the vService (%). It is not the processor usage of the AGS engine. |
| Memory Usage | The instantaneous memory usage of the traffic engine of the vService. The memory of the AGS engine is in the AGS Memory card in the System section. |
| Avg. Response Time | The average of the response times of the Backend Services taken according to the service weights. In the tooltip the highest response time seen in the Backend Services since the traffic engine started running (Highest Seen) is written; if there is no measurement yet, the tooltip is not displayed. |
Why Avg. Response Time can read -
The requests that have no session are directed not to the Backend Service but to the AGS engine that serves the login pages, and the response time of the AGS engine does not enter this calculation. For this reason the card reads - until traffic that is authenticated or that stays outside the AGS activation condition reaches the Backend Services.
Access
The section shows how the requests that come to the vService are separated by AGS, as a rate per second. Every request is written to only one category and the order is as follows: first the requests that stay outside the access control, then the authorized requests, and everything left is counted as unauthorized. The data of this section is read not from the session store of the AGS engine but from the counters of the traffic engine; it continues to produce a value in the moments when the store cannot be accessed as well.
| Card | What it shows |
|---|---|
| Authorized /s | The rate of the requests that come with a valid and authenticated AGS session. |
| Unauthorized /s | The rate of the requests that do not carry a valid and authenticated AGS session; the requests the users who have no session make to the login and verification pages are written to this card as well. |
| Whitelisted /s | If an AGS activation condition is defined, the rate of the requests that do not enter the access control at all because they do not match the condition. If no condition is defined, the value stays zero. |
The slashed zero (0) seen in the card values is not a special symbol; it is the zero glyph in the typeface of the card digits. -, on the other hand, shows that the value is not present in that round: it is displayed when the value cannot be read, in the first round of a newly established stream in the rate cards and in the cells that have no measurement (e.g. the sending cells of the TOTP row).
AGS Sessions
| Card | What it shows |
|---|---|
| Total Concurrent Sessions | The total number of sessions open in the AGS engine at that moment. |
| Authenticated | The number of open sessions that are authenticated. |
| Unauthenticated | The number of open sessions that have not completed the login flow yet. |
| Unique Users | The number of unique users whose identity has been verified. |
| Created /s | The number of new sessions opened per second. |
| Authenticated /s | The number of sessions that complete their authentication per second. |
The same Authenticated name is located in two cards: the card that carries no unit shows the current number of sessions, and the card with the /s unit the authentication rate per second. The list of the open sessions is on the Sessions tab.
Authentication
| Card | What it shows |
|---|---|
| Attempts /s | The number of authentication attempts per second. |
| Success /s | The number of successful authentications per second. |
| Failed /s | The number of failed authentications per second. |
| Errors /s | The number of authentication errors per second. |
The Provider table below the cards breaks the attempts down according to the Authentication Providers profiles in the flow:
| Column | What it shows |
|---|---|
| Provider | The name of the authentication provider profile. |
| Attempts/s | The number of attempts of the profile per second. The table is ordered at the beginning from the most to the least according to this column. |
| Success/s | The number of successful verifications of the profile per second. |
| Failed/s | The number of failed verifications of the profile per second. |
| Errors/s | The number of errors of the profile per second. |
| Share | The share of the Attempts/s value of the row within the total in the table; if the total is zero, -. |
Only the provider profiles that have a step in the login flow are listed in the table. If there is no provider step in the flow, only the information icon is displayed in the body of the table.
Captcha
| Card | What it shows |
|---|---|
| Shown /s | The number of CAPTCHAs shown per second. |
| Correct /s | The number of CAPTCHAs answered correctly per second. |
| Incorrect /s | The number of CAPTCHAs answered incorrectly per second. |
Unlike the AGS CAPTCHA panel on the Dashboard, in this section there is no Answered card. This section reads the counters of the AGS engine and should not be confused with the Captcha section on the Bot/DDoS dashboard.
The Provider table below the cards breaks the displays down according to the CAPTCHA Providers profiles:
| Column | What it shows |
|---|---|
| Provider | The name of the CAPTCHA provider profile (e.g. Standard TR7 CAPTCHA). |
| Shown/s | The number of displays of the profile per second. The table is ordered at the beginning according to this column. |
| Correct/s | The number of correct answers of the profile per second. |
| Incorrect/s | The number of incorrect answers of the profile per second. |
| Share | The share of the Shown/s value of the row within the total; if the total is zero, -. |
In the table, the providers used by the lockout policies whose CAPTCHA protection is on and by the bot protection policies whose action is to show a CAPTCHA are listed. If neither is present, only the information icon is displayed in the body of the table.
MFA
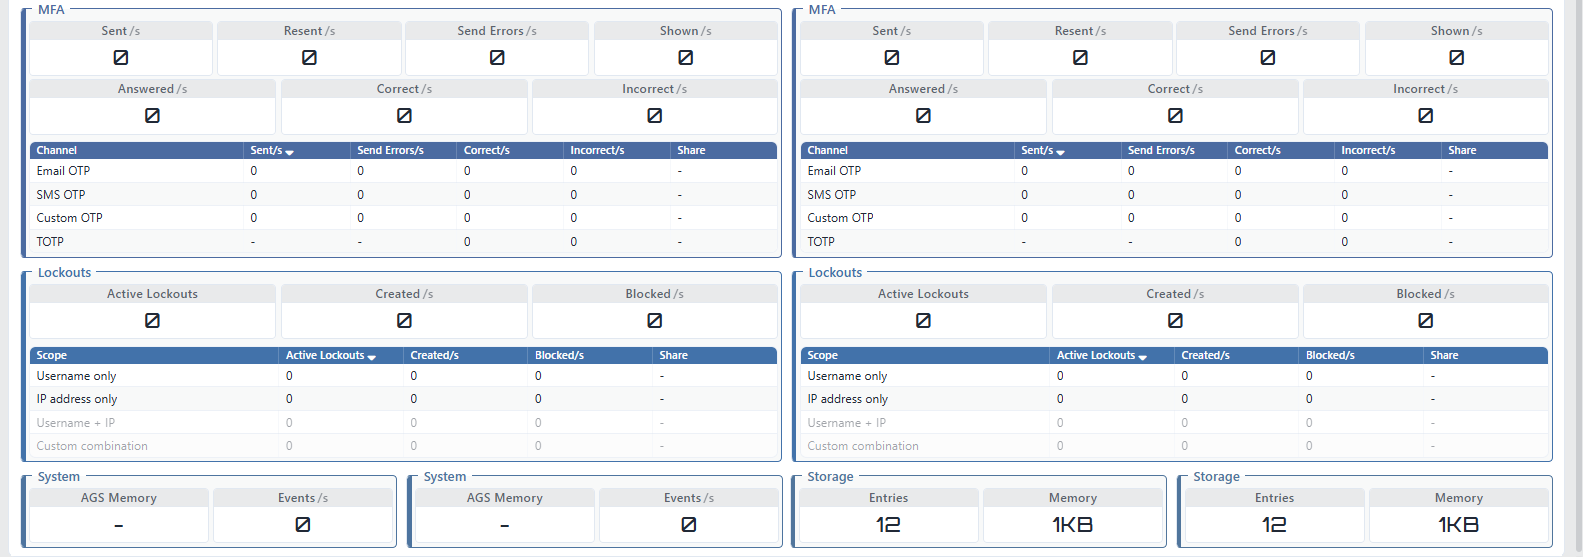 AGS Live Stats (the lower sections)
| Card | What it shows |
|---|---|
| Sent /s | The number of one-time codes sent per second. |
| Resent /s | The number of codes resent per second. |
| Send Errors /s | The number of codes that could not be sent per second. |
| Shown /s | The number of code entry screens shown per second. |
| Answered /s | The number of codes answered per second. |
| Correct /s | The number of codes entered correctly per second. |
| Incorrect /s | The number of codes entered incorrectly per second. |
The Channel table below the cards breaks the codes down according to the verification channel. There are always four rows in the table: Email OTP, SMS OTP, Custom OTP and TOTP.
| Column | What it shows |
|---|---|
| Channel | The verification channel. |
| Sent/s | The number of code sendings of the channel per second. The table is ordered at the beginning according to this column. |
| Send Errors/s | The number of sending errors of the channel per second. |
| Correct/s | The number of correct codes of the channel per second. |
| Incorrect/s | The number of incorrect codes of the channel per second. |
| Share | The share of the Sent/s value of the row within the total; if the total is zero, -. |
Since the TOTP code is produced on the own device of the user, this channel has no sending counter: the Sent/s and Send Errors/s cells read -, the Share cell of the row reads 0% while there is sending in the other channels, and the row goes down to the bottom in the ordering according to the number of sendings. In the first round after the screen is opened, after the LIVE indicator is turned on again or after the refresh interval is changed, the Sent/s and Send Errors/s cells read - in all the channels and the Share column reads - in all the rows; in the same round the Correct/s and Incorrect/s cells show 0.
When there is at least one MFA step in the login flow, the row of a channel that is not used in the flow is displayed faded while all its values are zero and goes down to the bottom of the table independently of the ordering; when data starts to come from the channel, the row returns to the full view. If there is no MFA step in the flow at all, all four rows stay in the full view (as in the image above). The Resent, Shown and Answered numbers are located only in the cards, they have no columns in the table.
Lockouts
| Card | What it shows |
|---|---|
| Active Lockouts | The number of lockouts active at that moment. |
| Created /s | The number of new lockouts opened per second. |
| Blocked /s | The number of requests blocked because of a lockout per second. |
The Scope table below the cards breaks the lockouts down according to the scope. There are always four rows in the table: Username Only, Username + IP, IP Address Only and Custom Combination.
| Column | What it shows |
|---|---|
| Scope | The lockout scope. |
| Active Lockouts | The current number of active lockouts of the scope. The table is ordered at the beginning according to this column. |
| Created/s | The number of new lockouts of the scope per second. |
| Blocked/s | The number of blockings of the scope per second. |
| Share | The share of the Active Lockouts value of the row within the total; if the total is zero, -. |
If at least one Account Lockout Policies policy is bound to the vService, the row of a scope that is not used in any of these policies is displayed faded while all its values are zero and goes down to the bottom of the table; if no policy is bound, all four rows stay in the full view. In the image above the Username + IP and Custom Combination rows are faded for this reason. The lockouts themselves are listed on the Lockout tab.
The scope names in this table are the names in the lockout policy form; in the scope panels on the Dashboard the same scopes are displayed with the series names Username, Username + IP, IP Address and Composite.
System
| Card | What it shows |
|---|---|
| AGS Memory | The memory usage and the memory limit of the AGS engine, in the usage / limit form. If one of the values cannot be read, - is displayed. The card does not mark the value change with an arrow. |
| Events /s | The number of audit record events AGS produces per second. The records themselves are listed on the Audit Logs tab. |
Storage
| Card | What it shows |
|---|---|
| Entries | The number of records in the session store of the AGS engine. |
| Memory | The memory usage of the AGS session store (e.g. 1KB). |
Scope and Limits
INFO
- The data is not stored. Live Stats shows only the instantaneous state; the Dashboard is used for examination looking back.
- No time range can be selected. The only window control is the refresh interval.
- It is not passed to another screen from the panels. The cards and the table rows carry no link; the sessions, the lockouts and the audit records are examined on their own tabs. The elements that can be clicked on the screen are the stream controls and the table column titles (the ordering).
- The card and table rates are per second independently of the selected interval. Selecting a 30 second interval does not enlarge the values; it changes only how often the dashboard is refreshed and over which duration the rate is calculated.
- The cards show the total and the tables the breakdown. The card values are read from the total counters of AGS and the table rows from the provider, channel and scope counters; the Share column is the current share of the first measurement column in every table, it is not cumulative.
- The table rows follow the configuration. The rows in the provider and CAPTCHA tables are determined from the current configuration in every round; when a provider is added to or removed from the flow, the table is updated without the stream needing to be re-established.
- A reading error and the absence of traffic have to be distinguished. When the session store of the AGS engine cannot be accessed, the dashboard does not show an error: the AGS cards read
-and the Provider tables empty; in the Channel and Scope tables the rows remain, the sending cells read-and the other cells0. Since the Access section is read from the traffic engine and the AGS Memory card from the resource usage of the engine, they are not affected by this situation; the AGS Memory card can also read-when the resource information of the engine cannot be taken. In a section that continuously reads-, the state of the engine should be verified from the Engine tab.
