
Smarter by Design.Simpler for Business
User Logs
What Is User Logs?
User Logs is the audit log that records all the configuration changes, the session events and the system operations that the administrator users perform on the TR7 device in chronological order. Operations such as creating-editing-deleting a vService, a Backend Service and a Backend Group, the network and WAF changes, the setting updates, the login/logout and the failed login attempts are monitored retrospectively from this screen.
When an administrator performs an operation, this operation is recorded automatically with the related category (Field) and action type (Action Type) labels. In this way this screen offers a central and permanent history of all the management operations done on the device; it provides the traceability of the changes and the accountability in multi-administrator environments.
01 · OperationThe administrator performs an operationLogging in, a setting change, adding a vService…
02 · LabelIt is classified automaticallyThe category (Field) and the action type (Action Type)
03 · AuditIt is written to the audit logWho · when · from where · what they did
Every log record contains the following information:
- Who: The name of the user who performed the operation
- When: The date and time the operation was performed
- From where: The IP address and the browser information of the user
- Which device: The TR7 source on which the operation was performed (Source)
- What they did: The descriptive text of the operation
Audit Trail
Audit trail
Who did what, when and from where
Permanent
Non-deletable record
Retained since the initial installation
Categories
Field & action
Labeling with the Field and the Action Type
Filter & Export
Examination
Filtering and Excel/CSV/PDF export
Permanent Record
The User Logs are retained permanently from the initial installation of the device onward. A manual deletion operation cannot be done. In this way a complete audit trail is provided.
Forwarding to an external system (SIEM)
The user logs can also be forwarded to an external Syslog server or to a SIEM system with Log Forwarding (Log Sources → User Logs).
Why Are the User Logs Important?
The User Logs are the basic component of managing the TR7 device in a secure and auditable way. Thanks to these logs:
- By whom, when and from where a configuration change was made can be determined,
- The unauthorized access attempts and the failed session attempts can be monitored,
- The latest changes made can be examined quickly during the troubleshooting processes,
- Complete evidence can be provided in the compliance and security audits,
- In multi-administrator environments, which user made which changes can be clarified.
What Is Logged?
The wide-ranging operations performed by the users on the TR7 device are logged automatically. The logs are labeled according to the categories (field) and the action types (action).
The Log Categories:
| Category | Description | Example operations |
|---|---|---|
| Traffic Manager | The vService, Backend Service, Backend Group, server, rule, condition, vIP, script and profile changes | Creating a vService, editing a rule, deleting a Backend Service, restarting a Backend Service |
| WEB GUI Access · SSH Access | The web interface and SSH login/logout events and the login attempts | A successful login, a failed login, a logout, a login with a certificate |
| Network | The namespace, interface, IP address, route, DNS and firewall settings | Adding an interface, editing an IP, creating a firewall rule |
| WAF | The Web Application Firewall rule and setting management | Adding/editing/deleting a WAF rule, importing/exporting a rule, the OWASP rules |
| GTM | The Global Traffic Manager DNS services, the domains/records and the triggers | Editing a GTM object, restarting a DNS service, a zone transfer (AXFR) |
| vDevices | The virtual device (vDevice) management | Creating, editing, deleting a vDevice |
| General Settings | The general settings, the backup, the license, the update, the clustering, the notifications, the IP reputation and the Web CLI | Updating a setting, creating/restoring a backup, registering a license, updating the IP reputation |
| User Management | The system user and client certificate management | Creating/editing/deleting a user, generating/revoking a certificate |
| AGS | The AGS - AAM (Application Access Management) configuration | Creating/editing/deleting an AGS object, revoking a session, clearing an account lock |
The Action Types:
| Action Type | Description |
|---|---|
| Creation | Creating a new object or configuration |
| Edit | Editing an existing object or configuration (including the configuration synchronization) |
| Deletion | Deleting an object or configuration |
| Login / Logout | Logging in and out; including the login with a certificate |
| Restart / Reload | Restarting or reloading a service |
Operational Usage Recommendations
- A regular examination should be done. The user logs should be examined at regular intervals; the failed login attempts and the unexpected configuration changes in particular are important indicators in terms of security.
- The first address in troubleshooting. When a service problem is experienced, the User Logs should be checked first; the latest configuration change made usually points to the source of the problem.
- The filter and the export should be used actively. In large log volumes, the related logs should be narrowed down with the Field and Action Type filters; for the periodic audits, the logs should be archived as Excel/CSV.
- The Source column should be monitored in the cluster environments. In a multiple setup, the Source column shows over which device the operation was performed; it is critical for the consistency check across the cluster.
- The failed login attempts should be followed. The login events should be examined with the Field: WEB GUI Access + Action Type: Login filter; the failed attempts coming from unknown IPs or at unexpected hours may indicate unauthorized access attempts.
User Logs Listing Screen
By following the path Settings → System Logs → User Logs, the user logs on the TR7 device are listed.
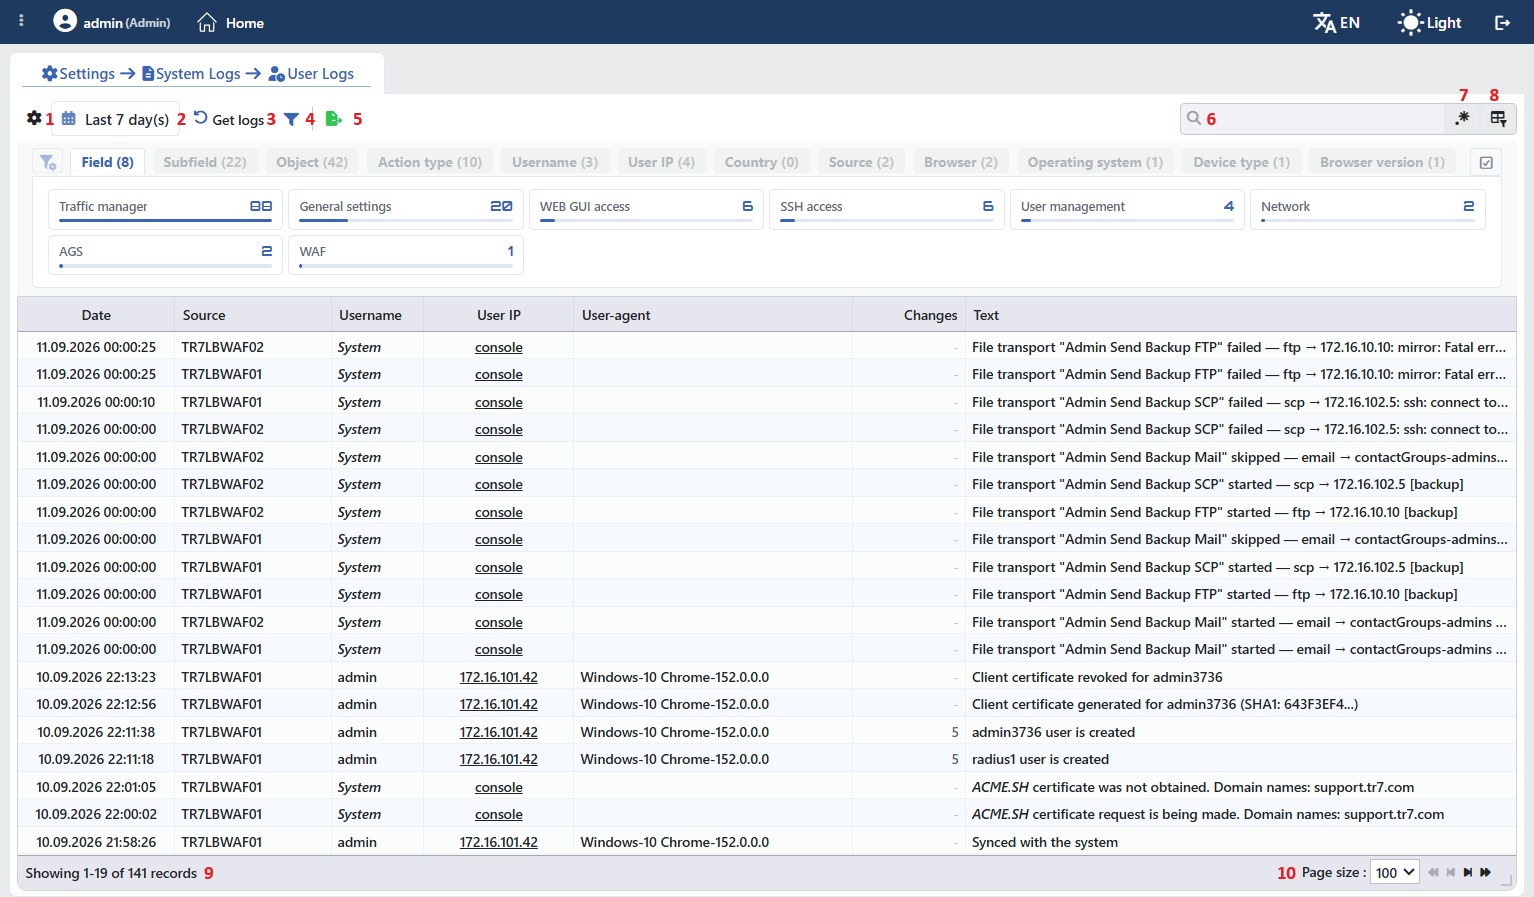 The User Logs Listing Screen
The table opens with the following columns by default:
| Column | Description |
|---|---|
| Date | The date and time the operation was performed. |
| Source | The Server Name value of the device on which the operation was performed. |
| Username | The name of the user who performed the operation. On the records the device generates itself, System is written and the cell comes in italics. |
| User IP | The client IP address from which the operation was performed. On the device-originated records, console is written. |
| User-Agent | The browser and the operating system from which the operation was performed (e.g. Windows-10 Chrome-152.0.0.0). If the operation was performed over the Web CLI or the CLI, its source is added in bold at the end of the row (@<source>); on the device-originated records the cell stays empty. |
| Changes | The number of fields changed in the operation; if there is no change, - is written. When the number is hovered over, the field-based change list opens. |
| Text | The description text of the operation. |
There is no column hidden by default.
The items in the toolbar are arranged from left to right in the following order; the last two items (Page Information and Page Size) are located in the information strip below the table.
Columns
Which columns will be shown in the table is selected. In the same panel the columns are reordered by dragging, the alignment is selected per column, a manually set column width is returned to automatic sizing by clicking, and with the Reset button the column layout is returned to the default. The layout is stored per user.
Time Range
The time range for which the logs will be displayed is selected. The predefined ranges: 5 min · 15 min · 1 hour · 3 hours · 6 hours · 1 day · 7 days · 1 month; in addition, Custom Duration (a free period) and Custom Date Range (a start-end from the calendar) can be used. Default: The last 7 days.
Get Logs
It loads the logs from the server according to the selected time range. By clicking the Get Logs button, the user logs within the determined date range are listed. The logs are not updated automatically; in order to see the new logs, the button must be clicked again.
Filter
The filter panel comes open by default on this screen; every criterion is offered as a multiple-selection facet, the selections are shown with counters and more than one criterion can be applied together. The layout (which facets will appear and their order) is saved to the user account. The facets:
- Field: the log category: Traffic Manager · User Management · WEB GUI Access · SSH Access · WAF · AGS · Network · vDevices · General Settings · Global Traffic Manager (GTM).
- Action: the action type; different actions are offered in every category. Creation/Edit/Deletion are found in all the categories; the additional actions are specific to the category (e.g. WEB GUI Access: Login · Logout · Login with Certificate · Debug Mode · Enabling · Disabling; WAF: Import · Export · Merge; Traffic Manager: Reload · Restart; General Settings: Update · Apply · Sync · Command Execution · File Download · Command Line · IP Intelligence Update). For the full catalog, the Notification Management → Log Type table can be looked at. For SSH Access there is no action selection.
- Subfield: the sub-object type within the category (e.g. Backup, License, Clustering, Log Transports under General Settings; Management Access under Network).
- Object: by selecting a specific object (by its name), only the operations of that object are listed.
- Outcome: the result of the operation; by selecting Failed, only the failed operations are displayed. This facet is hidden by default and is opened from the filter menu.
- Username, User IP, Country (with a flag), Source: who, from where, from which device.
- IP Tags: the IP Tags that match the address the user connected from; untagged addresses are collected under the No Tags option.
- Browser, OS, Device Type, Browser Version: the client (User-Agent) breakdowns.
Example: with Field: Traffic Manager + Action: Creation, only the newly created load balancing objects; with Field: WEB GUI Access + Outcome: Failed, only the failed login attempts are listed.
Export
By clicking the Export button, the table is exported as Excel, CSV or PDF according to the desired data columns.
Search
Used to search all information in the table.
RegExp Search
Used to search all information in the table with a regular expression (RegExp).
Column Based Search
Used to perform a column-based search on the information in the table.
Page Information
Information about the total number of user logs and the range of records displayed in the list takes place.
Page Size
The maximum number of records to be displayed on the page is selected. The arrow icons are used to navigate between the pages.
Preview of the Selected Log Record
When a row in the list is clicked, the preview belonging to that record opens on the right of the screen; when the selected row is clicked again, the panel closes. In the panel there are the tabs that are displayed conditionally according to the type of the operation.
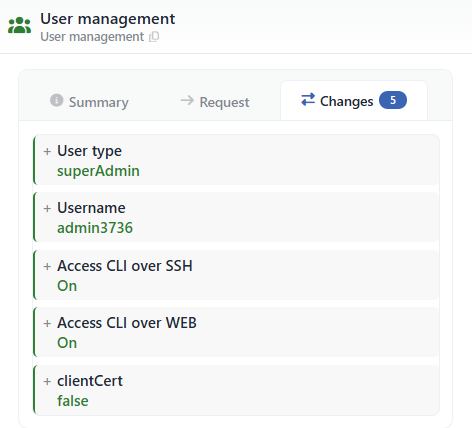 Preview of the Selected Log Record
In the preview title there are the category icon colored according to the operation type (creation green · deletion red · editing blue), the object name, the "Category › Object type" path and the copyable record identity. The last tab looked at is saved to the user account.
Summary
Shows the summary information of the operation: the Event, the Action, the Object, the date (with milliseconds), the Username, the User IP (with the flag and country information), the Source (in a cluster) and the client information. It is always displayed.
Request
Shows the method, the path, the query parameters and the headers of the HTTP request that triggered the operation; the session token is masked. It is displayed only on the records that have request information.
Changes
Shows the field-based change list: every row is listed in the addition (+), deletion (−), modification (•) or move (↕) type, color coded and with a nested field path; in the tab heading there is a change count badge. Since the names in the record are resolved from the backup closest to the moment of the operation, they may be approximate (it is stated as a note in the panel). It is displayed only on the records that carry change information.
Debug
Shows the detailed debugging information. It is displayed only in the debug mode.
