
Smarter by Design.Simpler for Business
UDP Flood
What Is UDP Flood?
UDP Flood measures the number of packets per second per source in the UDP band. It carries two rules and both of them ask the same question: how many packets is a source sending per second?
The difference between them is the scope. The first rule looks at all the UDP traffic and puts a general ceiling. The second separates only the DNS requests and applies its own ceiling to them. The reason DNS has a separate rule is the nature of the service: since it can produce a large answer with a small request, it can be both a direct target and a tool used to attack others.
2
Rules
One for all the UDP traffic, one only for the DNS requests
500/s
Default UDP Ceiling
The number of new UDP packets per second per source
200
Default DNS Ceiling
The number of DNS requests per second per source
Rate
Measurement Base
The sending rate per second; not concurrency
2
Able to Send to Quarantine
Both of them can take the source into quarantine
2
Subject to the Promotion Permission
Neither of them promotes into enforcement without the Mode Promotion permission
The UDP Flood Box on L4 DDoS Management
The box is the first box in the body of the UDP band. In its header there are its name and the number of rules it carries, and in its body two rule rows.
 UDP - The UDP Flood Box
| Row | Rule | What it limits |
|---|---|---|
| 1 | UDP Flood: New-UDP Rate | The number of new UDP packets per second per source. |
| 2 | DNS Flood | The number of DNS requests per second per source. |
UDP Flood: New-UDP Rate
Determines how many new UDP packets a source can send per second. The measurement is address based: every source carries its own counter, and one address exceeding the threshold does not affect the others.
The rule is not limited to the traffic directed at the device; it is applied to the UDP traffic passed through the device as well. Its definition in the information band is as follows: (UDP flood) Ip based new udp packet limitation.
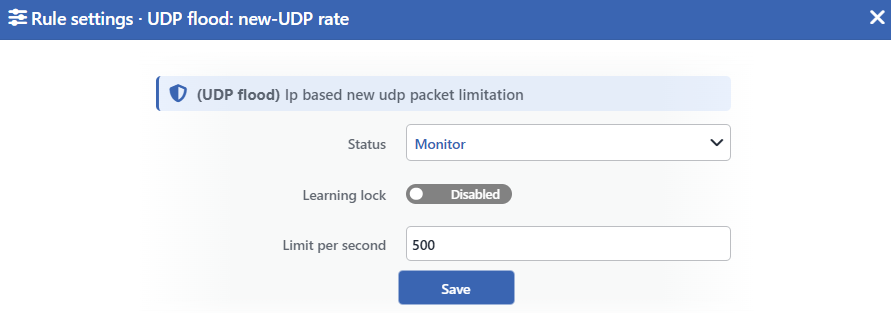 UDP Flood: New-UDP Rate Edit Screen
INFO
Status
Selects the rule's operating mode. Four values are offered, and the selected value also determines the sentence on the row:
| Value | The sentence in the row |
|---|---|
| Disabled | A limit of <limit> new UDP packets per second is configured, but the rule is off |
| Monitor | A source may send at most <limit> new UDP packets per second; anything beyond is only monitored |
| Block | A source may send at most <limit> new UDP packets per second; anything beyond is dropped |
| Quarantine | A source may send at most <limit> new UDP packets per second; a source that exceeds it is quarantined |
INFO
Learning Lock Default: Off
Closes the rule to the learning engine. When the switch is turned on, the engine cannot change the limit and the mode of this rule; the rule is changed only manually from this window.
It is off by default. While the lock is on, an unlabeled padlock icon is displayed on the row, to the left of the pencil.
INFO
Limit per Second Default: 500
Determines the number of new UDP packets per second per source. The default value is 500. Only an integer of 1 and above is accepted.
The lowest value the learning engine can recommend for this rule is 100; the values entered manually are not subject to this lower bound.
INFO
Save
Saves the change made and puts it into force immediately. Only the changed fields are updated. While there is a validation error, the button is inactive.
Pulling the limit to 1 turns the rule into a blanket block
When the limit is made 1, the threshold comparison loses its meaning and the rule is applied to all the new UDP packets regardless of the rate. In the enforcement mode this means that all the new UDP traffic that comes to the device and passes through the device is dropped.
In the monitoring mode, on the other hand, the same value stops the measurement silently: since the threshold comparison disappears, the counter does not fill, but the interface still shows the rule as Monitor.
Since the form accepts the value 1, this situation does not give an error message.
This rule produces a measurement in the monitoring mode as well
In the monitoring mode the rule is in force; only it has no result. The sending rate per second of every source is measured; on the Floods tab of the dashboard the highest source rate, the p95 value and the number of active sources are graphed together with the configured limit, but the traffic is not touched.
DNS Flood
Determines how many DNS requests a source can send per second. It uses the same rate logic as the previous one, but it counts only the UDP traffic directed at the DNS service; the other UDP traffic does not enter this counter.
Its definition in the information band is as follows: (DNS flood) - IP based DNS limitation.
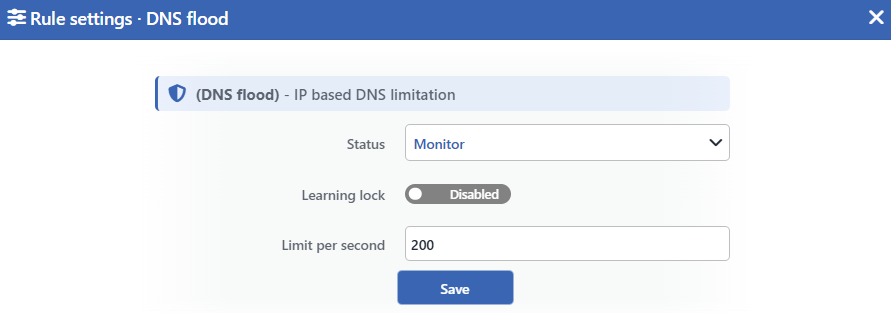 DNS Flood Edit Screen
INFO
Status
Selects the rule's operating mode. Four values are offered, and the selected value also determines the sentence on the row:
| Value | The sentence in the row |
|---|---|
| Disabled | A limit of <limit> DNS requests per second is configured, but the rule is off |
| Monitor | A source may send at most <limit> DNS requests per second; anything beyond is only monitored |
| Block | A source may send at most <limit> DNS requests per second; anything beyond is dropped |
| Quarantine | A source may send at most <limit> DNS requests per second; a source that exceeds it is quarantined |
INFO
Learning Lock Default: Off
Closes the rule to the learning engine. When the switch is turned on, the engine cannot change the limit and the mode of this rule; the rule is changed only manually from this window.
It is off by default. While the lock is on, an unlabeled padlock icon is displayed on the row, to the left of the pencil.
INFO
Limit per Second Default: 200
Determines the number of DNS requests per second per source. The default value is 200. Only an integer of 1 and above is accepted.
The lowest value the learning engine can recommend for this rule is 50; the values entered manually are not subject to this lower bound.
INFO
Save
Saves the change made and puts it into force immediately. Only the changed fields are updated. While there is a validation error, the button is inactive.
A single number is applied as two separate limits
This rule uses the value entered in two different ways and the interface shows this as a single field:
| How it is applied | What it measures | In which modes it is written |
|---|---|---|
| The rate limit | How many DNS requests come per second. This is the measurement source of the rule. | In the monitoring and the enforcement modes. |
| The concurrency limit | How many DNS flows from the same source are open at the same time. | Only in the enforcement modes. |
The practical result is as follows: the value 200 means both "at most 200 requests per second" and "at most 200 open flows at the same time". In the monitoring mode only the first one works, therefore when the rule passes from monitoring into enforcement a second limit that has never been seen in the measurement comes into play.
The packets the concurrency limit drops are not counted separately
The concurrency half of the rule does not carry a counter for the packets it drops in the Block mode. This has two results: these packets are not written to the Dropped Traffic tab of the dashboard and they do not contribute to the reaction axis of the threat status.
For this reason, while the rule is in the Block mode, the DNS traffic really dropped can be more than what is seen on the dashboard. In the Quarantine mode the packet is written to the counter because it is dropped through the quarantine rule.
Measurement and Dashboard
The measurement of the two rules is displayed on the Floods tab of the dashboard, in a separate L4 DDoS Rate — <rule> panel per rule, as a value per second.
| Rule | Panel tab | What is measured | Quarantine panel | Dropped Traffic |
|---|---|---|---|---|
| UDP Flood: New-UDP Rate | Floods | The new UDP packets per second per source: the highest source rate, the p95 value, the number of active sources and the configured limit line | Yes | Yes; it produces a value only in the Block and Quarantine modes |
| DNS Flood | Floods | The DNS requests per second per source: the highest source rate, the p95 value, the number of active sources and the configured limit line; only the rate half of the rule is measured | Yes | Yes; it produces a value only in the Block and Quarantine modes |
The panel is offered only while the rule is on
The measurement is produced in the monitoring mode as well; the limit line is displayed dashed in the Monitor mode, solid in the Block mode and dash-dotted in the Quarantine mode. When the rule is made Disabled, the measurement stops, a gap occurs in the graph and its panel falls out of the list on the Floods tab. The series on the Quarantine and Dropped Traffic tabs, on the other hand, stay on the list with a zero value while the rule is off as well.
The IPv4 and IPv6 measurements merge into a single series: in the peak and the p95 values the higher of the two versions is written, and in the number of sources their sum. On the L4 DDoS Live View screen both rules are on the Floods / Rate card.
In the enforcement mode a dropped packet does not reach the next counter
The rules are evaluated in order: the Reflection & Amplification and DNS Flood rules work before the UDP Flood: New-UDP Rate rule, and the concurrency half of the DNS Flood rule before its own rate measurement. A packet dropped in the Block mode does not reach the counter of the next rule.
For this reason, while DNS Flood is in the Block mode, the DNS requests that exceed the limit are not seen on the UDP Flood: New-UDP Rate panel; and the requests caught by the concurrency limit are not seen on the DNS Flood panel itself either. In the monitoring and the Quarantine modes the rule does not stop the packet at that point, so the next counter continues to see the traffic.
Scope and Limits
INFO
- Both rules measure a rate. The rule that measures the number of concurrent connections is not in this box but in the Connection Abuse box.
- Both rules are applied to the traffic directed at the device and to the traffic passed through the device.
- Both rules produce a measurement in the monitoring mode; the measurement is graphed on the Floods tab of the dashboard.
- Both of them are subject to the Mode Promotion permission; while the permission is off, the learning engine cannot have them promoted into enforcement. While the rule is in the monitoring mode and there is no limit recommendation waiting to be applied, the
Lockedbadge is displayed in the row. - Making the limit 1 removes the threshold comparison; in the enforcement mode the rule is applied to all the traffic, and in the monitoring mode the measurement stops.
- The value of the DNS rule is applied as two separate limits and the packets the concurrency half drops in the Block mode are not written to the dashboard.
- In an untouched route table both of them are born with the catalog default, that is, in the monitoring mode.
- The measurements do not separate the IP versions. The counter of a rule counts the IPv4 and IPv6 traffic together.
- The sources in the exemption list are not caught by any of these rules and are not written to their counters either.
- Editing requires modify permission in the Network area.
