
Smarter by Design.Simpler for Business
Live Stats
What Is Live Stats?
Live Stats is the tab that shows the current state of a vService on a dashboard refreshed once per second. The health of the traffic engine carrying the vService, the frontend counters, the density per source IP, the individual state of the Backend Services and the countries the traffic comes from are monitored live on a single screen.
The screen answers the question "what is happening right now?": when a traffic wave begins, the rise of the request rate, which Backend Service is falling behind, which source IP is drawing the load and which country the traffic comes from are seen at the same time. When the value of a card changes, the card glows with a brief highlight and a direction arrow is printed next to the value; an increasing metric is shown with a green arrow and a decreasing one with a red arrow. The arrow disappears by itself after about one and a half seconds and is not printed at all on the first update after the stream is established; the previous measurement to compare against only exists from the second round on. In this way, the operator looking at the screen notices what has changed before reading the numbers.
Live monitoring runs on the device itself: the data is read directly from the traffic engine, and no external collector, agent or analytics product is needed. The stream is established only while the screen is open; when another tab is selected or the session ends, the subscription is terminated and leaves no additional load on the device.
1 s
Live refresh
Data is refreshed once per second; the refresh interval is selected as 1, 5, 10 or 30 seconds
6 Sections
On a single screen
Frontend, Source IP Statistics, Traffic Mirroring, Backend Services, Action Hits and Live Traffic; this is a maximum, and most sections depend on the type and data of the vService
19
Frontend cards
At most 19 cards in an HTTP vService; TLS, compression and cache cards are added only when the related feature is enabled
8
Source IP cards
Eight cards in an HTTP vService, five in L7 TCP; the measurement window is written in the card labels
Row by Row
Backend Service table
Each Backend Service in its own row, together with its status, session, rate and error columns
Map
Country breakdown
Traffic is colored on a world map by source country
Cluster
Dashboard per device
In a cluster setup, the data of each device is shown in its own column, without being mixed
Built-in
No agent required
Data is read directly from the traffic engine; no external collector or analytics product is required
Live Stats or Dashboard
The two screens use the same vocabulary but answer different questions. Live Stats shows the instantaneous state: the data is not stored, no time range is selected, and what is on the screen is always "right now". Dashboard, on the other hand, spreads the same metrics over time and archives them: historical trends, comparisons and report generation are done there.
The dashboard contains only load balancing sections
This dashboard does not show module sections such as the WAF inspection distribution, attack categories, OWASP breakdowns, Bot/DDoS action counters and AGS session counters. These sections are located in the version of the same dashboard component on the related module dashboard: the WAF breakdowns are on the WAF Live Stats screen and the Bot/DDoS breakdowns are on the Bot/DDoS Live Stats screen. On the other hand, the limits defined on the Bot/DDoS side continue to appear in the badge of the related cards on this dashboard.
Accessing Live Stats
- Left Monitor Panel is opened.
- Load Balancer vServices is selected from the category tabs at the top left.
- The vServices defined on TR7 are listed.
- The vService to be monitored is clicked; the screen opens with the Dashboard tab that carries the vService's name.
- On the screen that opens, the Live Stats tab is clicked.
The tab is displayed in every vService type to users who have monitoring permission in the Load Balancer area. The live stream starts as soon as the screen opens, and the first data arrives without waiting.
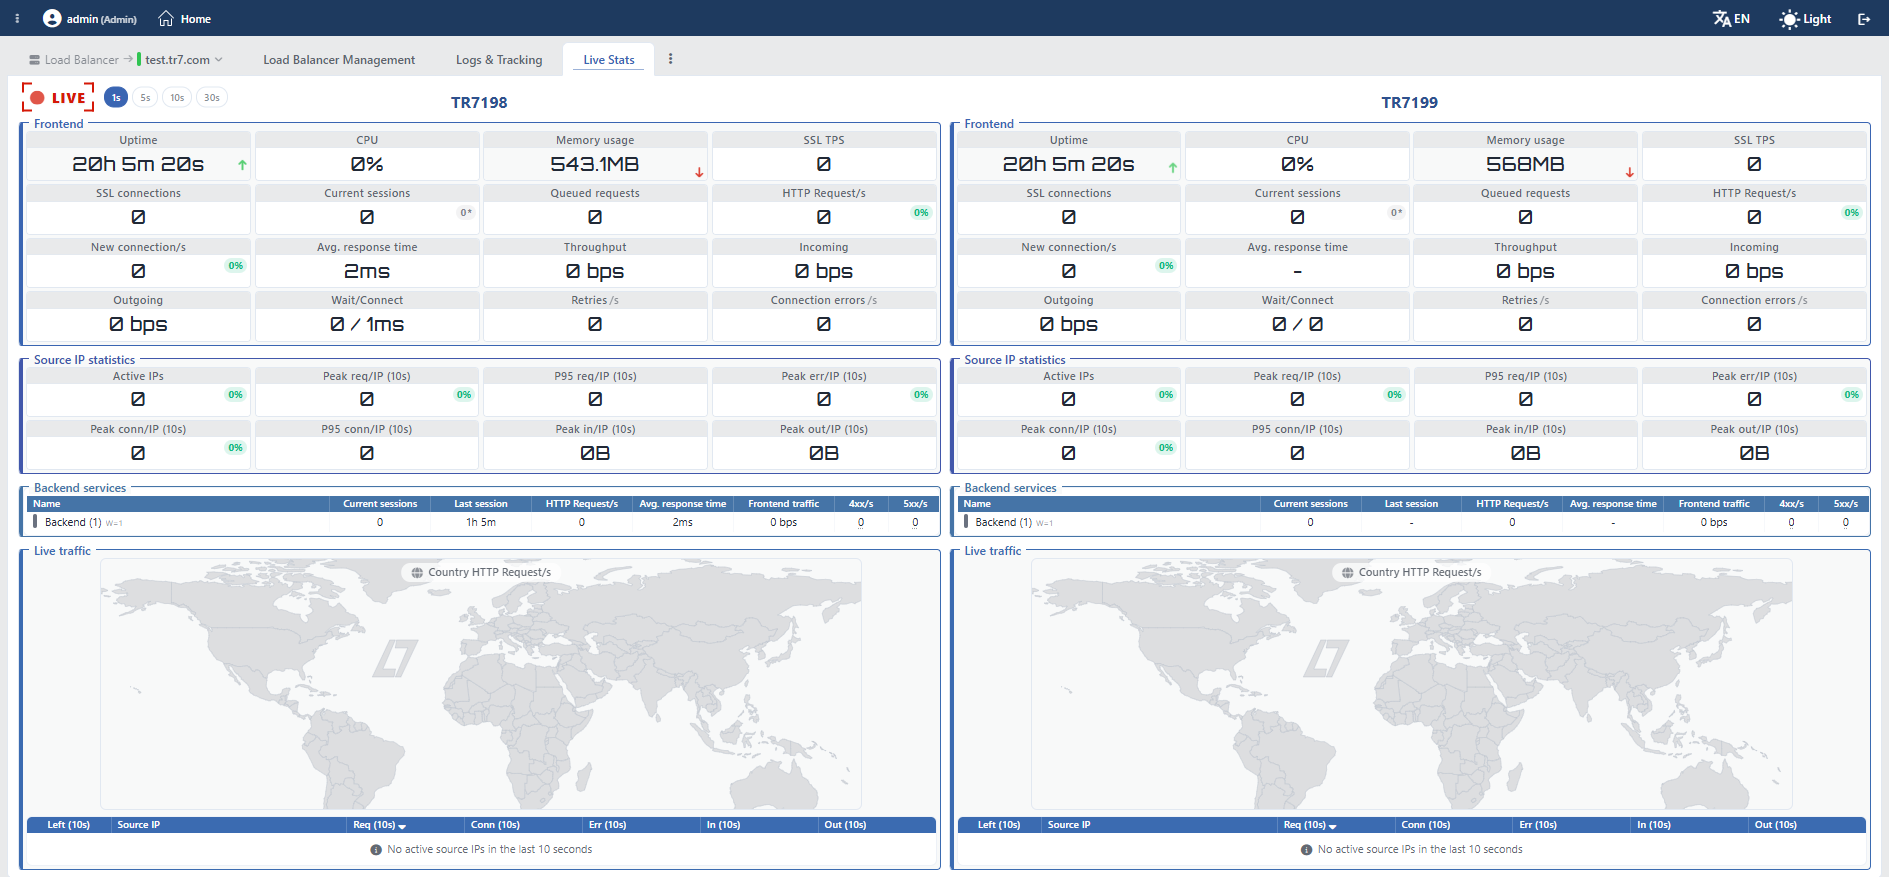 LB Live Stats
Screen Controls
There are two controls at the top left of the dashboard:
- The LIVE indicator stops and restarts the stream. The indicator takes four states: a dim circle while not subscribed, a spinning wait sign while subscribed but before the first data has arrived, a circle that beats like a pulse while data is flowing, and a stop sign when five seconds have passed since the last update.
- The refresh interval is selected with the 1s, 5s, 10s, 30s chips next to it; the default value is 1 second. The selection is stored per user and preserved in later sessions. The preference is kept separately per vService class: the selection made for HTTP and L7 TCP vServices does not change the selection in Network vServices. When the interval is changed, the stream is re-established with a brief interruption; during this time, the derived rates read zero once. The cards that are reset are Incoming, Outgoing, Throughput, Retries /s and Connection Errors /s; Current Sessions, HTTP Request/s, New Connection/s and Rate Max, which read the traffic engine's own instantaneous indicators, are not affected.
Each section is recognized by a frame label printed on its top edge and by a colored strip on its left edge. When the pointer is over a section, the box is slightly shaded; the frame color does not change. When the pointer is over the strip, the name of the section is displayed, and in a cluster setup, the device name is displayed next to the name. The section colors are derived from the interface theme's own accent color; for this reason, the sections continue to be distinguishable from each other when the theme changes.
When the pointer is over cards and table cells, all elements belonging to the same metric are highlighted together: hovering over a card makes the corresponding column in the Backend Service table stand out, and hovering over a column's header or any of its cells makes the related card stand out. In a cluster setup, the highlight covers the column of every device together. Mutual matching occurs only for metrics that have both a card and a column: Current Sessions is highlighted together with the table in every type, while HTTP Request/s and Avg. Response Time are highlighted together with it only in HTTP vServices.
In a cluster setup, the dashboard shows each section in a separate column per device, and the device names are located above the columns; in a standalone setup, no column heading is written. Values are not summed across devices: each device shows only the traffic passing through itself. When the peer device cannot be reached, that device's column stays empty and no separate warning is displayed on the screen.
Duration of the live stream
A live stream session lasts about 30 minutes; since the duration check runs once per minute, the stream ends by itself between 30 and 31 minutes. The values on the screen stay as they were last read and are not refreshed.
The end is not reported by the server: the indicator continues to appear active, only the pulse stops and the icon turns into the stop sign. If monitoring is to continue, the page must be refreshed, or the LIVE indicator must first be turned off and then turned on again. Changing the refresh interval also re-establishes the stream and restarts this duration.
The shortest interval in a Network vService is 5 seconds
The counters of Network (L4) vServices are read from a different source and are not refreshed every second. For this reason, the shortest refresh interval in these vServices is fixed at 5 seconds: the 1s chip stays on the screen but cannot be clicked. Since the preference is kept in two separate places, Network vServices never see the 1-second selection: if there is no stored preference, the default 1 second is silently raised to 5 seconds, this raise is not written back, and the user's stored preference for HTTP vServices does not change.
Frontend
In this section, the current state of the vService's traffic engine, its frontend and the delays on the Backend Service side is summarized in cards. None of the cards shows the device as a whole; the system cards also belong only to that vService's own traffic engine.
| Card | What it shows |
|---|---|
| Uptime | The uninterrupted running time of the traffic engine. The value is written in stages according to the duration: seconds and milliseconds below one minute, minutes and seconds below one hour, hours, minutes and seconds below one day; for longer durations, day, month and year breakdowns are also added. |
| CPU | The instantaneous processor utilization (%) of the vService's traffic engine. |
| Memory Usage | The instantaneous memory usage of the vService's traffic engine. |
| SSL TPS | The number of TLS sessions established per second. It is displayed only if at least one of the vService's listeners terminates TLS. |
| SSL Connections | The number of TLS connections open at that moment. It is displayed only in vServices that terminate TLS. |
| Incoming Compression | The rate of data read before compression. It is displayed only if a compression profile is assigned to the vService. |
| Outgoing Compression | The rate of data sent after compression. It is displayed only if a compression profile is assigned to the vService. |
| Cache | The cache hit and lookup counters, written side by side in the hits/lookups format. The two values are not divided and are not based on a window; both are totals accumulated since the traffic engine started running. It is displayed only if a cache profile is assigned to the vService. It is the only card on the dashboard that does not mark value changes with an arrow. |
| Current Sessions | The number of client sessions open at that moment. The tooltip of the card displays the peak value of the session count and the defined upper limit. In HTTP vServices, its badge also contains the number of requests currently in progress to the Backend Services. The asterisk at the end of the badge indicates that there is an explanation behind it; when the pointer is anywhere on the card, it is explained why this number is lower than the number of open connections (since connections stay open between requests, the number of requests being processed is normally much lower). In L7 TCP vServices, since a client connection corresponds to a single server connection throughout its lifetime, this badge is not added. |
| Queued Requests | The total of requests waiting to be forwarded in the Backend Services. |
| HTTP Request/s | The number of HTTP requests per second. It exists only in HTTP vServices. |
| Rate Max | The highest per-second new connection rate seen since the traffic engine started running. It is not a window value and does not drop until the engine is restarted. It is displayed only in L7 TCP vServices, in place of the HTTP Request/s card. |
| New Connection/s | The number of new connections established per second. |
| Avg. Response Time | The average of the response times of the Backend Services, weighted by the service weights. The tooltip shows the highest response time seen in the Backend Services since the traffic engine started running (Highest Seen); if there is no measurement yet, the tooltip is not displayed. It exists only in HTTP vServices. |
| Throughput | The instantaneous data flow rate in which the frontend traffic and the traffic of the Backend Service servers are calculated together. Since Incoming and Outgoing show only the frontend's own counters, this card is not equal to their sum; in a normal proxy flow, it is about twice as much. |
| Incoming | The instantaneous data rate coming to the frontend. |
| Outgoing | The instantaneous data rate going out of the frontend. |
| Wait/Connect | The averages of the queue waiting and connection establishment times of the Backend Services, weighted by traffic share; written side by side in the wait / connect format. Both are times that pass before the response starts; which one grows tells whether the problem is saturation or network latency. The tooltip lists the two values separately. |
| Retries /s | The total of retries and redispatches per second. The tooltip lists the two separately. |
| Connection Errors /s | The total of connection and response errors per second. The tooltip lists the two separately. |
Limit badges
If a limit is defined for the vService on the Bot/DDoS side, a percentage badge showing the ratio of the measured value to the soft limit is added to the related card. The cards that can carry a badge are HTTP Request/s and New Connection/s in this section, and Active IPs, Peak Req/IP, Peak Conn/IP and Peak Err/IP in the Source IP Statistics section.
The badge is displayed only while the soft limit is greater than zero; its color reflects the current pressure level. When the pointer is anywhere on the card, the explanation of the badge opens: the soft limit and the operating mode are always written, while the hard limit and the measurement window are written if defined. Since the badge is a percentage, it does not repeat the card's own unit and, unlike the badge on the Current Sessions card, does not carry an asterisk.
Cards not present in a Network vService
In Network (L4) vServices, the Avg. Response Time, HTTP Request/s, Rate Max, Wait/Connect, Retries /s and Connection Errors /s cards are not present; these measurements are not produced in this vService type. The Source IP Statistics, Traffic Mirroring, Action Hits and Live Traffic sections are not displayed at all either.
The Queued Requests card continues to be displayed, but since no queue counter is produced in this vService type, it permanently reads zero. For the same reason, the peak value and upper limit tooltip of the Current Sessions card also stays empty.
Source IP Statistics
This section summarizes in cards the density of the source IPs connecting to the vService in the last measurement window. There are eight cards in HTTP vServices; in L7 TCP vServices, three request-related cards drop out, leaving five cards. The cards are divided into two groups and wrap in groups of four in narrow columns.
The card labels other than Active IPs carry a suffix such as (10s); this suffix shows the window length and is not written as a fixed value, but comes with the measurement itself. The values are not per-second rates but raw counts counted over the window.
| Card | What it shows |
|---|---|
| Active IPs | The number of distinct source IPs showing at least one activity in the window. Any of connection, request, error and data transfer counts as activity. |
| Peak Req/IP | The highest number of requests reached by a single source IP in the window. It exists only in HTTP vServices. |
| P95 Req/IP | The 95th percentile value of the number of requests per source IP. The value is calculated approximately from a bucket-based distribution and covers only the sources active to that extent. It exists only in HTTP vServices. |
| Peak Err/IP | The highest number of errors produced by a single source IP in the window. It exists only in HTTP vServices. |
| Peak Conn/IP | The highest number of connections established by a single source IP in the window. |
| P95 Conn/IP | The 95th percentile value of the number of connections per source IP. It uses the same approximate calculation as P95 Req/IP. |
| Peak In/IP | The highest amount of data received from a single source IP in the window. |
| Peak Out/IP | The highest amount of data sent to a single source IP in the window. |
The Peak Req/IP, Peak Conn/IP and Peak Err/IP cards carry the percentage badge showing the ratio to the soft limit if a per-source limit is defined on the Bot/DDoS side. The badge on the Active IPs card, on the other hand, reflects not a per-source limit but the limit defined for the number of active sources.
The data of this section and of the Live Traffic table is not read again on every refresh; source telemetry is collected every few seconds, and the last collected value is shown in the refreshes in between. For this reason, the numbers here can be a few seconds old, regardless of the selected refresh interval.
Difference between the peak value and the average
The values in this section show not the total of the vService but the highest density of a single source. A rise in the Peak Req/IP value while the total request rate is normal means that the load has shifted to a single address; the P95 cards approaching the peak cards, on the other hand, shows that the density is spread not to a single address but to a wide set of sources.
Traffic Mirroring
This section exists only in HTTP vServices; since traffic mirroring is an L7 rule, it is not displayed at all in L7 TCP and Network vServices. In an HTTP vService, too, it is displayed only if mirroring is defined and the mirroring profile has started producing data.
Each active mirroring profile is listed in its own block; the block starts with a server icon and the name of the profile, and five cards are located below it. If the name of the profile cannot be resolved, the ID of the rule is written in the heading.
| Card | What it shows |
|---|---|
| Sampling % | The sampling rate of the mirrored traffic. The card does not mark value changes with an arrow. |
| In-flight | The number of requests being mirrored at that moment. The value is the sum of the instantaneous counts on all mirroring targets of the profile. |
| Mirrored/s | The number of requests mirrored per second. |
| Skipped/s | The number of requests skipped, that is, not mirrored, per second. |
| Dropped/s | The number of requests dropped per second. Those dropped because of the in-progress request limit, the body limit and errors are summed in a single value. |
Backend Services
This section lists all Backend Services of the vService in a single table and is displayed only if at least one Backend Service is defined. The rows are not grouped under Backend Group headings; each Backend Service is located in its own row. The order is not random: services belonging to conditional groups are listed at the beginning of the table, and those belonging to the default group at the end.
If a conditional Backend Service is defined in the vService, a second line is added below the name column of every row; rows belonging to a conditional group show that group's condition, while rows belonging to the default group show Default backend. If no conditional Backend Service is defined, this second line is not created at all.
The colored strip in the name column shows the decision the traffic engine has made for that service. This reading reflects not what the health check background believes but where the request is being directed at that moment.
| Strip | Meaning |
|---|---|
| Green | Healthy: the service is serving. |
| Dark green | No Check: no health check is defined for the service; the engine continues to direct traffic to the unchecked service. |
| Red | Unhealthy: the service is considered down. |
| Yellow | Maintenance, Draining or Not Balancing: the service has been manually put into maintenance, is being drained or has been taken out of distribution. |
| Gray | The traffic engine has not yet reported a state for this service, or the state it reported is not recognized. |
When the pointer is over the name cell, the full name of the service and the readable equivalent of the state are displayed. The traffic engine's own expression is added only if it carries a detail that the state name cannot convey: fractions such as UP 1/3 in transition states and the maintenance reason are written this way. Then the last check result and the number of failed checks, how many times it went down, the total downtime and the time elapsed since the last state change are listed; these four values are written only if they are greater than zero.
The weight of the service appears at the end of the name cell as a small suffix in the W=1 format. The weight is not a live measurement but configuration information; for this reason, it does not get its own column.
| Column | What it shows |
|---|---|
| Name | The name of the Backend Service, the status strip, its weight and its condition, if any. |
| Current Sessions | The number of sessions open to the service at that moment. |
| Last Session | The time elapsed since the last request to the service. If no session has ever landed on the service, - is displayed in the cell. |
| HTTP Request/s | The number of requests forwarded to the service per second. In L7 TCP and Network vServices, the column is shown as New Connection/s. |
| Avg. Response Time | The average response time of the service. In L7 TCP and Network vServices, the column is shown as Avg. Response Time(ttime). |
| Frontend Traffic | The sum of the incoming and outgoing data rates of the service. |
| 4xx/s | The number of 4xx responses produced by the service per second. It exists only in HTTP vServices. |
| 5xx/s | The number of 5xx responses produced by the service per second. It exists only in HTTP vServices. |
When the pointer is over a cell in the error columns, all response classes of the service (2xx, 3xx, 4xx, 5xx, 1xx and others) are listed with their per-second rates; in this way, the two error columns are placed on a common denominator. The row in which a Backend Service is considered down is additionally highlighted in the table.
In a cluster setup, the table is repeated as a separate dashboard per device, like the other sections of the dashboard; each dashboard carries its own name and measurement columns and shows only the reading of its own device. The device names are written in the column headings at the very top of the page.
Action Hits
This section exists only in HTTP and L7 TCP vServices; it is not displayed at all in a Network vService. In these two types, too, it is displayed only if there is at least one action rule that keeps a counter and the rule has started producing data. Each rule is listed in its own card, with the rule's name and the number of matches per second; if the rule has not been given a name, the card's label becomes the rule's ID. The cards are sorted by ID and arranged in rows of four.
The section is data-driven: when a rule matches for the first time, its card appears on the screen, and in a vService that produces no counters, the section is not displayed at all.
Live Traffic
This section consists of two parts and does not exist in Network (L4) vServices.
On the left side, the Country HTTP Request/s map shows the distribution of the traffic across source countries by color intensity. In L7 TCP vServices, the map carries the Country Connection/s title and counts connections instead of requests. The color scale is logarithmic; for this reason, the transition is not linear, and countries from which few requests come also remain visible on the map. The map can be dragged and zoomed; when the position is changed, a button appears that allows returning to the initial view. Country and region codes that have no place on the map are summarized as chips below the map: if there are more than five codes, the first four are written one by one and the rest are combined in a single total chip; with five or fewer codes, all of them are listed one by one.
On the right side, the source IPs that stand out in the last measurement window are listed in a table of at most 20 rows. The rows are collected not from the sorting of a single column but in turn from the leaders of each column; in this way, the source that transfers the most data or produces the most errors also finds a place in the table, just like the source that sends the most requests. When the column narrows, the table moves below the map. The values in the table are not per-second rates but raw values counted over the window. The row of a newly appearing source glows with a brief highlight; numeric cells carry a direction arrow when their value changes. If there is no source, the notice No active source IPs in the last 10 seconds is displayed in place of the table.
| Column | What it shows |
|---|---|
| Left (10s) | The time remaining until the source drops out of the measurement window, shown as a draining ring: as the source goes quiet, the arc shortens. When the pointer is over the ring, the time elapsed since the last request and the length of the window are written. In a source that does not report its idle time, the ring is not displayed, and the column stays in place. |
| Source IP | The source address. The cell carries the country flag of the address and a box that opens information about the address. |
| Req (10s) | The number of requests received in the window. It exists only in HTTP vServices. |
| Conn (10s) | The number of connections established in the window. |
| Err (10s) | The number of errors produced in the window. It exists only in HTTP vServices. |
| In (10s) | The amount of data received from the source in the window. |
| Out (10s) | The amount of data sent to the source in the window. |
In HTTP vServices, the table is initially sorted by the number of requests from most to least; in L7 TCP vServices, since this column does not exist, no initial sorting is applied. The sorting is changed in both types by clicking a column heading.
Scope and Limits
INFO
- Data is not stored. Live Stats shows only the instantaneous state; Dashboard is used for historical examination, and Report for detailed output.
- No time range can be selected. The only window control is the refresh interval.
- The panels do not lead to another screen. Cards, table rows and the map carry no links to another page; Logs & Tracking and Dashboard are used for detailed examination. The clickable elements on the screen are the stream controls, the table column headings (sorting), the map itself and the button for returning to the initial view, the summary chip of the codes outside the map and the source IP cell; the source IP cell opens an information and reputation window about the address.
- Card rates are per second regardless of the selected interval. Selecting the 30-second interval does not enlarge the values; it only changes how often the dashboard is refreshed and over which window the rate is smoothed. In contrast, the values in the Source IP Statistics and Live Traffic sections are not per-second rates but raw counts of their own measurement windows; this window is independent of the refresh interval and is written in the card labels.
- The Backend Service table follows the configuration live. When a Backend Service is added or removed, the table is updated on the next refresh; the stream does not need to be re-established.
- Rates can read zero once on reconfiguration. Since the counters are reset when the traffic engine is reconfigured, the rates can read zero once in the refresh that coincides with that moment. The same happens when the refresh interval is changed: since the stream is re-established, there is no previous measurement to compare against in the first round.
- A read error and the absence of traffic cannot be distinguished on the screen. When a counter read fails, the dashboard does not show an error; it shows the related values as zero or writes
-. In a section that constantly reads zero, whether there is really traffic must be verified through Logs & Tracking.
