
Smarter by Design.Simpler for Business
Event Logs
What Is Event Logs?
Event Logs is the log screen on which every request that one of the three protections has decided on is examined one by one on a vService under the Bot/DDoS protection. A row does not only say "this request was blocked"; it gathers in a single window which protection gave the decision, which rule or threshold was triggered, the measured value with the limit, the bot score of the client and the factors that produced this score, whether the TLS fingerprint and the User-Agent claim hold together, the reputation record of the address and the type of the network it comes from.
The real value of the screen is that it makes the decision verifiable. Every row carries its justification: which protection, which rule, which measurement and in which mode. In this way, besides the question "what happened", the question "why was it decided this way" is also answered. What a configuration working in the monitoring mode will do on the live traffic is read from here without stopping any request.
This is an event log, not a traffic log: clean traffic does not produce a row. When the same actor continues the same behavior, a row is not written for every request either; a continuity brake that works at the source suppresses the repetitions and the row written says itself which event number it is.
3
Deciding Protections
L7 DDoS Protection · IP Reputation Protection · Bot Protection are separated in a single column
4
Situations That Write a Row
The action applied · the monitoring stamp · the score signal · the listed address
With a Brake
Repeat Suppression
The continuity brake suppresses the repetitions; the row written says which event number it is
Two Layers
Filtering
The scope fetched from the server and the 14-group strip that narrows the log fetched
4 Tabs
Event Preview
Summary · Bot · IP Reputation · L7 DDoS; only the tab that has data is displayed
Narrative
The What Happened Sentence
The justification of the decision is turned into a full sentence together with the measured value and the limit
One Click
Defining an Exemption
The address, network, ASN, country, User-Agent or JA4 identities are added to the whitelist from the preview
Permanent
Storage on the Disk
The past logs are preserved up to the Disk Management limits
Cluster
A Single Combined List
The logs of the two devices are combined in a single list and sorted by date
The event log does not have a separate switch for turning it on
Every vService whose Bot/DDoS protection is on produces its own event log without an additional setting being turned on. The only thing that can be adjusted on the screen is from which score the "passed but was suspicious" rows will be written (Event Log Score Floor). The events of all the Bot/DDoS protected vServices, on the other hand, are gathered in a single table on the Global Event Log screen.
Supported vService Types
Since the Bot/DDoS protection is enabled on HTTP and L7 TCP vServices, Event Logs is produced on these two types as well. On L7 TCP vServices the columns that do not carry a request detail stay empty:
HTTP
L7 TCP
Network
How Does It Work?
The chain works in four steps: the protection evaluates the request, the decision drops onto the disk as a row, the continuity brake suppresses the repetitions of the same actor, and the screen reads and narrows these rows. The decision given at the end of the examination is bound to the configuration from the same window: the setting form that sets up the reason of the row is opened directly, or the identity of the actor is added to the exemption list.
01 · DecisionThe protection evaluates the requestOne of the three protections evaluates the request; it applies an action or, in the monitoring mode, puts the "would have been" stamp. The measured value and the limit are frozen at the moment of the decision.
02 · RowThe decision drops onto the diskThe decision is written to the vService's own log file as a single-line record. The record carries the score, the factors triggered, the fingerprints and the reputation information of the address together.
03 · BrakeThe repeated rows are suppressedIf the same actor continues to produce the same decision, the rows are suppressed; only the transitions, the first events and the milestones are written. The row written carries the total number and the instantaneous rate.
04 · ExaminationThe logs are read and narrowedThe screen reads the rows in the selected range, narrows them with the filter strip and, in the preview, shows the justification of the decision with a full sentence; from there it is passed to the setting or to the exemption.
Operational Best Practices
- A new configuration must first be read in the monitoring mode. Before the protection is taken to the Active mode, it is run in the Monitor mode for a while and the Would… rows that accumulate on this screen are examined. In this way which legitimate traffic will undergo enforcement is seen without any request being stopped.
- An empty list does not mean "there is no attack". While a protection is Off, the rows of that protection are not written at all; while Bot Protection is off, the score signal rows are not produced either.
- A row without a
×Nbadge is not a single event. The badge is displayed only from the tenth repetition onwards; the event #N expression in the preview appears from the second repetition onwards. For the real volume of an actor, the preview of the row must be looked at. - The narrowing must be set up in the server filter. The row limit cuts the result, not the scan: when the filter is defined on the server side, the reading backwards continues until the limit is full. Narrowing the filter gives a faster result than enlarging the limit.
- The filter strip narrows only the rows fetched. The numbers on the chips tell not the total on the device but the window that is on the screen at that moment. For a broader picture, the date range must be changed and the logs must be fetched again.
- The justification of the decision must be read before an exemption is given. The What happened sentence in the preview writes the measured value and the limit together; before an address is taken into the whitelist, it must be verified from this sentence that the event is really a false positive.
- The narrowest identity must be selected. The preview menu offers the address, the network, the ASN, the country, the User-Agent and the JA4 identities separately. Exempting a country or an ASN is a much broader door than exempting a single address.
- This screen must not be used for live monitoring. The list does not refresh by itself; Live Stats is used for instantaneous tracking and Dashboard for a periodic summary.
In Which Situation Is a Log Produced?
Clean traffic does not produce a row. A row being written for a request depends on one of four situations:
| Situation | When it occurs | An example Action value |
|---|---|---|
| The action applied | A protection decided in the Active mode and applied an enforcement. | Blocked · CAPTCHA shown |
| The monitoring stamp | A protection is in the Monitor mode; the enforcement was not applied, what would be applied was recorded. | Would show CAPTCHA · Monitor |
| The score signal | No rule was triggered, but the bot score reached the Event Log Score Floor value. | Allowed · Insufficient score |
| The listed address | The address of the client is recorded in a reputation category; a record was produced even though no enforcement was applied. | Allowed · No-action category |
The score floor gates only the third situation
The Event Log Score Floor value filters only the score signal rows; the action applied, the monitoring stamp and the listed address rows are written independently of the floor. The floor is compared with the raw score before the trust signals are subtracted.
The score signal row also requires that Bot Protection is not off: while the protection is Off, since this arm is not set up at all, the row is not produced.
The traffic that gets an exemption does not have its own row
A request that matches the whitelist or that is exempted from the enforcement because it is a verified bot is logged only if it also meets one of the four situations above. For this reason the exemption rows can appear fewer than expected in the event class filter; the exemption itself does not make a row be written on its own.
The challenge infrastructure is not logged
The own requests of the challenge page (the image, the solver and similar auxiliary calls) are deliberately kept outside. Otherwise every auxiliary request of an actor that has been directed to the challenge would leak back into the list with the Allowed · Insufficient score label. The keeping outside covers only the score signal and listed address arms: if an enforcement is really applied to a request on an infrastructure path, the row is still written. The solving attempt itself (/verify), on the other hand, is logged and appears as Captcha solved or Captcha failed according to its result.
The file layout and the storage
The logs are written to one file per vService and per hour. The files older than two hours are compressed; the reading opens the compressed files transparently. How long the logs will be kept depends on the Disk Management settings.
On the source side there is a writing budget per hour and this budget is a byte ceiling (approximately 64 MB per vService, roughly 150,000 events). In an hour that reaches the ceiling, all the remaining rows of that hour drop: neither the repetitions nor the first events of the actors seen for the first time in that hour are written. A single interruption mark is left in the file and the writing stops until the end of the hour. The screen reports this situation with a warning in the toolbar and writes how many hours have been affected.
This ceiling is a mechanism separate from the continuity brake explained below: the brake thins out the repetitions, and the ceiling silences that hourly file completely.
Behavior in the cluster
Every device keeps its own log. The screen combines the logs of the two devices in a single list and sorts them by date. From which device the log comes is displayed in the Source column; this column is not located anywhere outside a cluster installation.
The continuity brake works per device and is not copied to the peer: a flood that continues after a configuration has been applied writes a few rows again, because the brake counters are reset.
The Continuity Brake
The brake works with the rule "the transition is the event, the continuity is the counter". Every row is bound to an actor; according to the surface that gives the decision, the actor can be the source address, the combination of the source address and the User-Agent, a country or network type rule, a limit block, a penalty box key or a challenge identity. The combination of the source address and the User-Agent is used only on HTTP vServices; on L7 TCP vServices the actor is the source address.
A row is not written for every request of an actor. A row is written only in the following situations:
- A transition: the actor was silent for at least one minute and has been seen again.
- The first events: the first three events of the actor are written in every case.
- The milestones: the digit changes such as the tenth, the twentieth, the hundredth, the two hundredth and the thousandth.
- The hourly pulse: for an actor that is continuously active, at most one hour of silence remains.
- The moment of entering the penalty box: since the stamping is a transition, it is always written.
There is an upper limit for the number of rows that can be written per actor per hour (24 rows). The first events, the hourly pulse, the moment of entering the penalty box and the rows whose actor key cannot be resolved are exempt from this limit.
The suppression does not lose information
Every row written carries itself which event number it is of that actor and the event rate in the last minute. In the table this information appears as the ×N badge from the tenth repetition onwards, and in the preview in the form event #N · N/min from the second repetition onwards. The number of the suppressed rows is read from these two values; the counters and the reports are not affected by the suppression.
Access to Event Logs
- Left Monitor Panel is opened.
- Bot/DDoS Protected vServices is selected from the category tabs at the top left.
- The vServices defined on TR7 that have the Bot/DDoS protection enabled are listed.
- The vService to be monitored is clicked; the screen opens with the Dashboard tab that carries the vService's name.
- On the screen that opens, the Event Logs tab is clicked.
The tab is created only while the Bot/DDoS protection is on on the vService and is not shown to the users that do not have monitoring permission in the Load Balancer area; when the protection is turned off, the tab is also removed. The Global Event Log screen, which gathers the events of all the Bot/DDoS protected vServices in a single table, on the other hand, is opened from the Configuration Menu and is not shown to the users whose permission is limited to certain vServices.
The Log Listing Screen
The event records of the selected vService are reached by following the Bot/DDoS Protected vServices → Event Logs path. The screen lists the event rows in the selected date range in a single table; the strip above carries the filter groups, and the information row below the table the number of records and the page size.
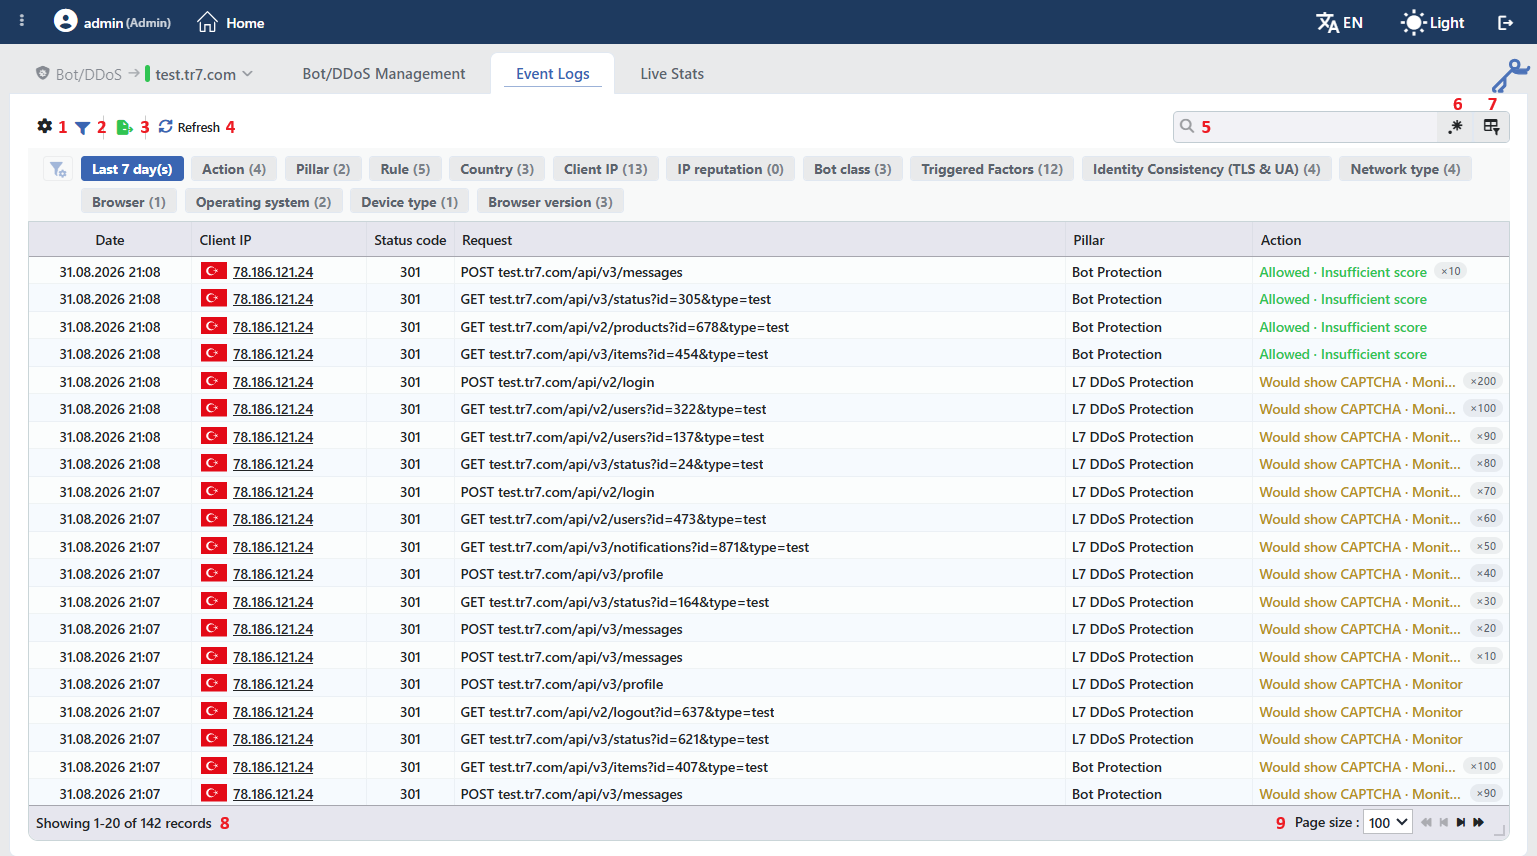 The Log Listing Screen
The table opens with the following columns by default:
| Column | Description |
|---|---|
| Date | The time of the event, in the DD.MM.YYYY HH:mm format. |
| Client IP | The address of the client, with the country flag. If the address is recorded on the black or the white list, it is colored accordingly. When the cell is clicked, the information window of the address opens. It does not carry port information. |
| Status Code | The HTTP status code returned to the request. It stays empty in the requests that are silently dropped and on L7 TCP vServices. |
| Request | The method, the host and the path. On L7 TCP vServices, instead of the method, the fixed TCP is written. |
| Pillar | The protection that gives the decision (The Pillar Column). |
| Action | The decision itself (The Action Values). |
The following columns are hidden by default and are added from the column selector:
| Column | Description |
|---|---|
| Bot Score | The bot score of the client, in the color of the band. |
| IP Reputation | The reputation category in which the address is recorded. |
| Trigger | The measured value and the limit (in the form 229 / 150). |
| Repeats | Which event number of the actor it is and its rate per minute. |
| User-agent | The User-Agent made readable; the raw value appears in the tooltip. |
| Rule | The rule or the block triggered. |
In a cluster installation, next to the Date column, the Source column that shows from which device the log comes is added and it comes on by default; outside a cluster installation this column is not located anywhere.
The Action Values
The Action column writes the decision with a text in two parts: the verb and, if there is one, the reason. The text is colored with one of three tones; in which lane the decision is is read from the color.
| Tone | Meaning |
|---|---|
| Red | An enforcement was applied. |
| Orange | The monitoring mode: an enforcement was going to be applied, it was not applied. |
| Green | The request was let through; the row was written for information purposes. |
The actions applied:
| Text | Meaning |
|---|---|
| Blocked | The request was rejected with a status code. |
| CAPTCHA shown | The client was directed to the challenge. |
| Tarpitted | The request was held by being slowed down. |
| Redirected | The client was redirected to another address. |
| Content shown | A ready content page was returned. |
| Silently dropped | The connection was dropped without a response being produced. |
| Blocked by quarantine | The request was stopped because the actor was in the penalty box. |
The monitoring mode: the same verbs are written in the Would… form and with · Monitor added to their ends: such as Would block · Monitor, Would show CAPTCHA · Monitor and Would quarantine · Monitor.
The requests let through: the verb is Allowed and the reason is the justification for being let through.
| Text | Meaning |
|---|---|
| Allowed · Whitelist | The request matched the exemption definition of a protection. |
| Allowed · Trusted bot | The client is a verified search engine robot. |
| Allowed · No-action category | The address is recorded in a reputation category, but there is no rule bound to that category. |
| Allowed · Insufficient score | No rule was triggered; the row was written because it exceeded the score floor. |
The challenge result: the rows that carry a solving attempt appear as Captcha solved (green) or Captcha failed (red). The n/threshold pair next to a failed attempt writes together which attempt number has been made and at what the quarantine threshold is; this pair is added only while the challenge quarantine is on.
The additions: if the actor has been taken into the penalty box with this request, → Quarantined is added to the end of the text; the protection that sent it to quarantine is written in parentheses: IP reputation, Bot score, DDoS limit or Failed captcha (e.g. → Quarantined (Bot score)). The same addition is also in the exported table. When the repeat number of the actor reaches ten, the ×N badge is added to the right of the cell. In the tooltip of the badge the event rate per minute is written only when the rate reaches one; in the rates below it only the repeat number appears.
The Pillar Column
The Pillar column writes the protection that gives the decision: L7 DDoS Protection, IP Reputation Protection or Bot Protection.
The column does not always show the one that "gives the decision"
If no protection has applied an enforcement, the column writes the name of the protection that observes the event. For example, in a row that carries only a score signal Bot Protection appears, and in a row that carries only a reputation record IP Reputation Protection. This does not mean that that protection has taken an action; what the decision is is read in the Action column.
The items in the toolbar are arranged from left to right in the following order; the last two items (Page Information and Page Size) are located in the information strip below the table.
Columns
Which columns are shown in the table is selected. In the same panel, columns are reordered by dragging and alignment is selected per column; the row height is fitted to the page with the Fit rows to the page button, and the column layout is reset to default with the Reset button. The layout is stored per user.
Filter
The Filter button opens and closes the filter strip and, if there is an active selection, carries a badge on it; the strip comes open by default. On this screen there are two separate filter layers: the server filter that determines which logs will be fetched from the server and the filter strip that narrows the rows fetched.
Export Table
The table is exported as Excel, CSV or PDF by clicking the Export Table button. In the window that opens, the Filename, Format and Data Source, together with the Columns to be exported, are determined; the remaining fields are displayed according to the format: CSV Separator for CSV, Excel Sheet Name for Excel, and Page Orientation and Page Size for PDF.
Refresh
The Refresh button fetches the logs again with the server filter in force. While the fetching is going on, the button becomes passive and turns into a spinning symbol.
Search
Used to search all information in the table. The search works over the values seen on the screen and without regard to upper/lower case.
RegExp Search
Used to search all information in the table with a regular expression (RegExp).
Column Based Search
Used to perform a column-based search on the information in the table.
Page Information
Contains information about the total number of fetched logs and the range of logs displayed in the list: Showing N-M of T records. Since the rows cannot be selected on this screen, the number of selected rows is not shown.
Page Size
The maximum number of logs to be displayed on the page is selected. The default is 100; the options are 50, 100, 250 and All. The selection is not stored.
On this screen the rows cannot be selected and there is no right-click menu for the rows; the operations on an event are made from the preview heading.
The Server Filter
The fixed tab at the far left of the filter strip determines with which scope the logs will be fetched from the server. While the other groups on the strip narrow the rows fetched, the settings here change the fetching itself.
 The Server Filter Tab
INFO
Date Range Default: Last 7 day(s)
From which time range the logs will be read is selected. The range is defined either relatively in the form of the last N minutes/hours/days/weeks/months/years, or absolutely with a start and an end date. In an absolute range the end must be after the start; in an invalid range the field turns red and the fetch button becomes passive.
INFO
Line Limit Default: 1000
It is the maximum number of rows to be fetched; its default value is 1000.
The limit counts the rows that survive: if a filter is defined, the older files continue to be read until the limit is full or the range ends. For this reason scanning a wide range with a narrow filter can take a long time. The largest value that can be entered on this screen is 20,000. The scan is also bound to a 120-second timeout; if the period expires, the rows collected up to that moment are returned.
INFO
Request Unique ID
A search is made with the identity of a single request. While the field is empty, all the requests are fetched and All requests is written as the placeholder. The identity does not replace the advanced filter below: when the two are defined together, they are combined with an and relationship.
INFO
Log Filter
With the + Add advanced filter link, a detailed filter that works on the server side is set up. The conditions are selected from three categories:
| Category | Fields |
|---|---|
| Decision | The event class, the protection, the action applied, the monitoring stamp, the bot score, the bot band, the factors triggered, the reputation category and the three exemption flags. |
| Client | The address, the country, the network type, the User-Agent. |
| Request | The method, the host, the path, the status code. |
Every condition consists of a field, an operator and a value. In the text fields equality, containment, start/end, regular expression and list membership; in the numeric fields comparison; and in the address field network membership (CIDR) can be used. The Exists operator, which checks only whether the field is filled or not, does not ask for a value. In addition to these three categories, an Expression (JSONata) condition that makes it possible to write an expression over the whole of the record is also present.
The conditions are combined with and / or and at most ten condition groups are defined. The text comparisons do not regard upper/lower case.
INFO
Save & Get Logs
The Save & get logs button saves the changes on the tab and fetches the logs again with the new scope. The button becomes active only when a change has been made and while the form is without an error.
The settings are stored per user: when the same user returns to the screen, the range, the row limit and the filter come as they are.
The Filter Strip
The logs fetched from the server are narrowed from the strip above the table. Every tab on the strip represents a field; the fixed tab at the far left, on the other hand, is the server filter.
The Information That Can Be Filtered
On the strip there are fifteen groups by default:
| Group | What it filters |
|---|---|
| Action | The decision itself: the action applied, the monitoring stamp, the reason for being let through or the challenge result. |
| Pillar | The protection that gives the decision. |
| Rule | The rule triggered: a limit block, a country or network type rule, a reputation category, a bot threshold, an exemption. |
| Country | The country of the client. |
| IP Tags | The IP Tags that match the client address; untagged addresses are collected under the No Tags option. |
| Client IP | The address of the client. |
| IP Reputation | The reputation category in which the address is recorded. |
| Bot Class | The band into which the score falls. |
| Triggered Factors | The factors that produce the score; a row can carry more than one factor. |
| Identity Consistency (TLS & UA) | Whether the TLS fingerprint and the User-Agent claim hold together or not. |
| Network Type | The type of the network from which the address comes. |
| Browser · Operating System · Device Type · Browser Version | The client information resolved from the User-Agent. |
Seven more groups that are not located on the strip by default are defined: Would Act (monitor), Host, Method, Status Code, TLS Fingerprint (JA4), User-Agent Claim and Path. These are added from the own editing menu of the strip.
The number in parentheses in the group title says how many different values are present for that group in the rows loaded at that moment; it is not the number of rows. IP reputation (0) being written means that there is no reputation record in any of the rows fetched.
The Combination of the Selections
The selections in the same group are combined with an or relationship and the selections in different groups with an and relationship; the counters of every group are recalculated according to the active selections of the other groups.
The strip does not bring new rows from the server
The filter strip narrows only the rows that have been fetched. If the record looked for is not in the selected range or in the row limit, it does not appear on the strip at all; to widen the scope, the Server Filter is used.
Preview of the Selected Log
When a row in the list is clicked, the preview of the event opens on the right of the screen. In the title the summary of the decision, below it the request itself, and at the top right at most two operations are located.
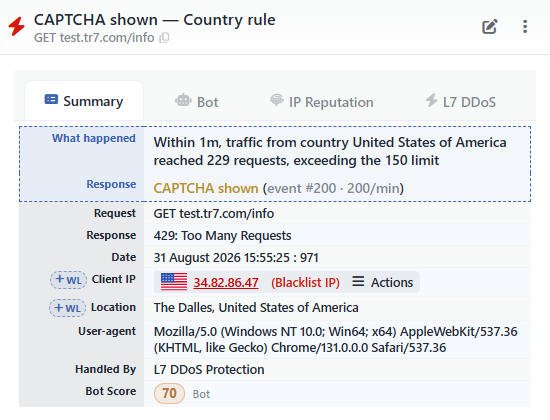 The Preview - The Summary Tab
The title is set up with the following pattern: <verb> · <reason> — <rule>. Both the reason and the rule name are conditional: in most of the enforcement rows the title stays in the form <verb> — <rule>, and in the rows let through the reason says the justification and the rule name is not added. The symbol in the title shows the protection that gives the decision and is painted with the tone of the decision. The copy symbol in the row below takes the unique identity of the request to the clipboard; this identity is a bridge to the detailed record of the same request.
| Operation | What it does |
|---|---|
| Edit Corresponding Setting | Opens directly the setting form that sets up the reason of this row: the limit block, the country or network type rule, the reputation category, the bot threshold or the penalty box setting that triggers it. If there is no edit permission or if there is no setting target that can be resolved from the row, it is passive. |
| The exemption menu | Adds the identities in the row to the whitelist list of the related protection. It is present only if there is an identity for which an exemption can be defined; in a row whose deciding protection cannot be resolved it is not located anywhere. |
The identities in the menu change according to the protection that gives the decision
In the menu only the identities that are really present in that row and that the protection giving the decision accepts are listed. The exemption types are distributed to the protections as follows:
| Identity | In which protection it can be defined as an exemption |
|---|---|
| IP Address · IP Network (CIDR) · ASN (Autonomous System) | In all three protections |
| JA4 Fingerprint · JA4 Family · User-Agent (Exact Match) | Only Bot Protection |
| Country | Only L7 DDoS Protection |
The practical result of this is as follows: in an L7 DDoS row a User-Agent exemption and in a Bot row a country exemption are not offered; in a row that belongs to an IP Reputation decision, on the other hand, only the address, network and ASN options are present. The User-Agent exemption is also an exact match, it does not make a partial match.
An identity that is already exempt appears with a green check symbol and as passive. The selection opens a confirmation window and the record is written to the exemption list of the protection that gives the decision.
The same operation is also made with the WL badge at the beginning of the related rows in the preview: the badge opens the same confirmation window.
In the window there are at most four tabs. The tabs are conditional: only the tab that has data in that event is located there. For the Bot tab the bot score is not a requirement; if any one of the score, the score band, the factor triggered, the JA4 family or the User-Agent family is present, the tab is formed. For this reason the Bot tab is also present in a row that has no score but whose fingerprint has been resolved.
Summary
Tells what happened and what TR7 did with a full sentence; it carries the identity card of the request and the client.
Bot
Shows the bot score, the factors that trigger it and the identity consistency.
IP Reputation
Shows the reputation record, the location and the network type of the address.
L7 DDoS
Shows the limit rule triggered and the measured value.
Summary Tab
The first two rows of the tab tell the decision:
- What Happened: the justification of the event is written with a full sentence. The sentence carries the measured value and the limit together: Within 1m, traffic from country United States of America reached 229 requests, exceeding the 150 limit. In the bot decisions the pattern Bot score 90 entered the 'Score ≥ 85' action rule and in the reputation decisions the pattern The client IP is listed as
<category>in threat intelligence is used. - Response: what TR7 did is written: the action applied, in the monitoring mode the explanation monitor mode: traffic was not blocked, the event was only logged, or the justification for being let through. If the repeat number of the actor has reached two, the repeat information is added to the end of the row in the form (event #200 · 200/min).
Then the identity card of the event comes:
| Row | Its content |
|---|---|
| Request | The method, the host, the path and the query. |
| Response | The HTTP status code returned to the request and its name. |
| Date | The time of the event. |
| Client IP | The address of the client. If the address is on the blacklist, it is written in red and the (Blacklist IP) label appears next to it. |
| Location | The resolved location of the address. |
| User-agent | The client information made readable. |
| Handled By | The protection that handles the event. |
| Bot Score | The score and the band into which it falls. |
The Actions menu in the Client IP row
The Actions menu next to the address adds the address to the device-wide black or white list or removes it from there. Since these lists affect all the vServices, the operation asks for a separate confirmation window. The removal option is offered only if the record is on the operator's own list; a record that comes from the feed sources cannot be removed, but it is made ineffective by being added to the white list.
To give an exemption at the vService level, not this menu but the exemption menu in the title or the WL badges are used.
Bot Tab
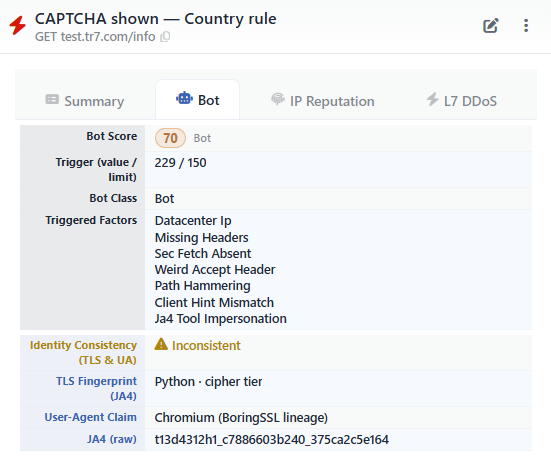 The Preview - The Bot Tab
| Row | Its content |
|---|---|
| Bot Score | The score and its band. |
| Trigger (value / limit) | The measurement that gives rise to the decision: in the limit rules the measured value and the limit, and in the bot decisions the score and the threshold. |
| Bot Class | The name of the band into which the score falls. |
| Exempted | It is checked if the request matched the Bot Protection exemption. |
| Triggered Factors | The factors that produce the score, with their names on the Factors screen. The value appears in a single field as the whole of the list that the row carries. |
| Identity Consistency (TLS & UA) | Whether the client family that the TLS fingerprint points to and the family that the User-Agent claims hold together or not. |
| TLS Fingerprint (JA4) | The client family resolved from the fingerprint and the certainty of the match. |
| User-Agent Claim | The client family that the User-Agent claims. |
| JA4 (raw) | The raw fingerprint value. |
Identity Consistency can take four values:
| Value | Meaning |
|---|---|
| Consistent | The two sides show the same client family. |
| Inconsistent | The fingerprint shows a browser but the User-Agent does not confirm this: either another family is claimed or no User-Agent has been sent at all. It appears with a warning symbol. |
| Compatible | The tool claimed runs on a stack of browser lineage; it is not counted as a contradiction. |
| Could not resolve | One of the sides could not be resolved. |
The fingerprint match has two levels of certainty
The addition next to the TLS Fingerprint (JA4) value says how certain the match is. An exact match is evidence close to the identity of the client; a match at the cipher suite level, on the other hand, only confirms the lineage of the TLS library. This distinction is deliberate: for example, a client appearing as Chromium (BoringSSL lineage) does not mean that it is necessarily a browser.
IP Reputation Tab
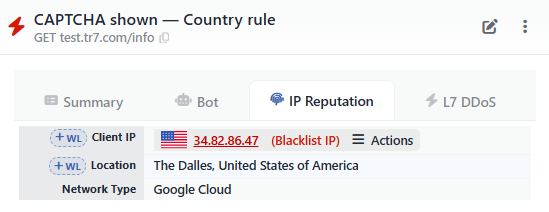 The Preview - The IP Reputation Tab
| Row | Its content |
|---|---|
| Client IP | The address of the client and its blacklist state. |
| Location | The resolved location of the address. |
| Network Type | The own name of the network group from which the address comes (Amazon AWS, Hetzner, Tor Exit Node and the like; 21 groups in total). It is not a generic type name but the own name of the group. |
| IP Reputation Category | The reputation category in which the address is recorded. |
| Exempted | It is checked if the request matched the IP Reputation exemption. |
The category field writes the first category found for the address; "first" here is the first one that matches according to the order in the rule list. A category that is not bound to any rule is never written to this field, even if the address is recorded in that category. If the address is recorded on more than one list, all of them are not shown.
L7 DDoS Tab
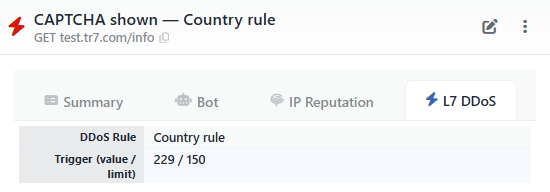 The Preview - The L7 DDoS Tab
| Row | Its content |
|---|---|
| DDoS Rule | The rule triggered: one of the six limit blocks (Total Request Rate, Total Connection Rate, Source IP Request Rate, Source IP Connection Rate, Source IP Error Rate, Active Source Count), one of the two hard ceilings, or Country Rule / Network Type Rule. |
| Trigger (value / limit) | The measurement frozen at the moment of the decision: the value observed and the limit. |
| Exempted | It is checked if the request matched the L7 DDoS exemption. |
The country and network type rules are written without a number
Every row in the rule list is a separate rule, but in this field all of them appear with the same name (Country Rule or Network Type Rule). Which row has been triggered cannot be distinguished from the table; the country or the group that the rule covers is written in the What happened sentence on the Summary tab.
Scope and Limits
INFO
- The screen does not refresh by itself. The list is refreshed only when the tab is opened, with the Refresh button and when the server filter is saved. The automatic fetch at the opening is made only while the vService is running: on a stopped vService the tab opens empty and the logs are brought with Refresh. Live Stats is used for instantaneous tracking.
- The row limit and the cluster. Independently of the row limit in the server filter, the screen shows at most 10,000 rows at once; in a cluster installation this limit is applied after the rows of the two devices have been combined and sorted by date. To reach the older records, the date range must be narrowed or the server filter must be used.
- The permission. The screen is opened to the users that have monitoring permission in the Load Balancer area. Fetching the logs also requires change permission: a user that has only read permission sees the tab, but the rows cannot be brought. Adding an exemption and opening the setting form also depend on the edit permission.
- Its differences from the WAF event log. The two screens share the same skeleton, but their examination surfaces are different. On this screen there is no row selection and no bulk teaching button; a false positive is remedied not by selecting a row but by adding one of the identities in the preview to the exemption list. The counterparts of the Attacks and Severity columns are the Trigger, Bot Score and Bot Class fields here. Instead of the log suppression rules, there is the continuity brake that works at the source.
