
Smarter by Design.Simpler for Business
Analysis & Learning
What Is Analysis & Learning?
Analysis & Learning is the offline analysis that examines the past traffic of a host group collectively and produces page type and rule suggestions belonging to that group. Which addresses the application actually serves, which parameters it takes and within which size limits it works are derived with this analysis; when the result is examined and confirmed, it turns into the WAF Rules rule set of the host group.
The analysis is started manually; it has no scheduler that runs by itself. Its source data is the learning log: a request is written into this log only while the host group is in the Learning mode or when it arrives with the Conditional Learning identity. For this reason, being able to get a result from the analysis depends on at least one of these two conditions having been met in the selected period.
The analysis reads the set that falls into the log as it is. While the Smart Sampling setting on the Log Settings screen is on, only the first samples of the same request shape are written in full, so the analysis sees this sampled set as well.
Its difference from the other learning methods
AI Learning and Teacher under Learning Methods are the methods that run continuously in the background and remove the false positives one by one. Analysis & Learning, on the other hand, works once and collectively: it reads the whole of the selected period and sets up or widens the rule set of the host group from the beginning.
The two do not use the same record and do not trigger each other. Conditional Learning, on the other hand, is the setting that produces the raw data the analysis will read; the analysis consumes its product.
How Does It Work?
Deriving manually which addresses a web application serves, which parameters it takes and in which sizes it works is a job that takes days even on a medium-sized site. Analysis & Learning has this job done by the traffic itself: the past learning log is read, the real structure of the site is turned into a page tree and a rule set consisting of measured values is suggested for every page type. Before it is written, the administrator sees this suggestion, narrows it and confirms it.
Offline
Way of working
The analysis runs in a separate process; it does not touch the traffic, the WAF inspection and the rules in force
3 months
Default range
The ready ranges extend from one day to three months; with a custom range it is possible to go ten years back
8
Analysis filter
The country, status code, bot, source address and host filters with three ready elimination options
3
Rule creating mode
Every page is learned, only the pages that carry data are learned or the page is not learned
Confirmed
Application
No rule is written before the result is examined and confirmed; the suggestion and the live rule set are kept separate
01 · RecordThe traffic is written into the logWhile the host group is in the Learning mode or when the request arrives with the Conditional Learning identity, the path, the method, the parameters and the status code of the request fall into the hourly learning log.
02 · AnalysisThe log is read, the tree is set upThe files of the selected period are read in a separate process; the lines that pass the filters are mapped to the host group and the addresses are placed into a directory tree.
03 · EditingThe tree is narrowedOn the Analyze Page Types screen the similar addresses are gathered into a single pattern, the irrelevant directories are taken out of the analysis and the lower-limit thresholds are determined.
04 · ApplicationThe rule set is writtenThe log is read a second time, the values of every page type are produced and the result is written into the Page Types list of the host group.
The Analysis Stage
The analysis reads the hourly learning logs in the selected time range from beginning to end. Every line is parsed and passes through three eliminations in order: the filters defined in the window (the country, the status code, the bot, the source address, the host), which host group the request belongs to and whether that group has been included in the analysis. The reason breakdown of the eliminated lines is kept in the Filter Reasons list, so that the question "why have so few logs been processed" is not left to guesswork.
Every request that passes the elimination is written into a tree node over its path. In the node there is not only the address but also the measurements belonging to that address: the number of requests and visitors, the source IP and country distribution, the methods used, the body types, the status codes and the number of dynamic requests. Whether a request will produce its own page type is determined by Rule Creating Mode: Comprehensive counts every address as a separate page type, Data Based only the ones that carry a query, a body or a dynamic method, and Page Independent none of them.
The analysis is entirely offline. It runs in a separate process, does not touch the traffic and the rules in force; its result is only a suggestion record.
The Application Stage
The application does not write the saved tree as it is. The log of the same time range is read a second time and the values of the rule are produced by being measured for every page type: the allowed HTTP methods, the path length and depth limits, the query and body sizes, the allow lists consisting of the header and parameter names. For this reason the operation takes at least as long as the analysis itself and its progress is watched from its own bar.
Since an estimate is not used instead of a measurement, the produced rule set carries the limits of the behavior the site actually shows: a method the application never uses does not enter the allow list, a parameter name that has never been seen is not accepted. The protection value comes from here as well; the narrower the rule set, the smaller the area the attacker can try.
The Two Counters
The size of the result is watched with two numbers. Analysis Page Count is the number of the different addresses the analysis has found raw and does not change. Current Page Count is the number of the pages remaining in the tree after the grouping and the thresholds have been applied; it is recalculated with every change on the editing screen and, when applied, gives the number of the page types to be written.
The difference between the two shows how much work the editing has done: when thousands of addresses are reduced to tens of page types with a few glob patterns, the rule set both stays manageable and falls below the application limit.
Operational Best Practices
- The analysis should be run after the learning has matured enough. The rule set is produced only from the traffic that has fallen into the log; if the flows that run only in certain periods such as a campaign, a season or the end of a month are not in the log, the addresses and the parameters of those flows do not enter the rule set either. The analysis range should be selected wide enough to cover all the business flows of the site.
- The Country Filter default should be reviewed in every analysis. By default the window comes with only Local Networks and Turkey selected. In an application that serves from abroad, if this setting is not changed, the greater part of the real traffic stays out of the analysis and an incomplete rule set is produced.
- The existing rule set should be exported before the application. The application replaces the rule list of the host group with the analysis result and there is no undo operation. The backup taken with Export is the only way to return to the previous state in an unexpected result.
- A new analysis should be taken in a host group in which manual editing has been done. The application takes as its basis the rule copy at the moment the analysis was created. The editings made manually after the analysis date are lost whatever value Ignore Old Rules has; for the current state to be preserved, the analysis should be run again.
- Rule Creating Mode should be selected by thinking of the permanent policy of the vService. The application updates the Rule Creation Policy setting on the Learning Methods screen with the value selected in the analysis and does not ask for a separate confirmation for this. If it is not wanted that the permanent policy change, the field should be left the same as the existing policy.
- The number of page types should be lowered before the application is tried. While Current Page Count is above 500, the application is rejected. The addresses that carry an identity, a date or an order number should be gathered with the Suggest Globs suggestions and the directories that are not permanent should be taken out of the analysis. A narrow tree is necessary not only for not exceeding the limit but also for the maintenance cost.
- The result should not be tried directly in the Blocking mode. Although the rule set that comes out of the analysis is based on measurement, a legitimate flow that has never been seen in the log may be blocked. After the rule set is applied, the host group should be watched for a while in the Monitor mode and the Blocking mode should be passed to after the false positives have been sorted out over Event Logs.
- In a cluster setup both devices should be selected as the source. Every device reads only the log on its own disk. If a single device is selected, the traffic that passes over the peer does not enter the analysis and the rule set does not recognize that traffic.
- The old analysis records should be deleted regularly. The records are not cleaned by themselves; when 250 records across the device and 50 records per vService are reached, a new analysis cannot be started. The records that have been applied or that have stayed without a result should be removed from the list.
The Analysis & Learning Row on WAF Management
On the WAF Management screen the mode card of every host group carries at least two rows. The second of the fixed rows is the Analysis & Learning row and next to it there is the explanation analyses past traffic and produces rule suggestions; the analyses that are going on are listed as separate rows above these rows.
 WAF Management - The Analysis & Learning Row
The two elements in the row go to different places:
| Element | The screen it opens |
|---|---|
| the house icon | The list of the past analyses belonging to that host group. |
| The Analysis & Learning text | The new analysis creation window. |
The badges in the row
If there is a new analysis result that has not been applied, the New badge is displayed in the row. When the badge is clicked, the parameter summary of the analysis opens; from here the result can be edited, applied, ignored or deleted. When Ignore is selected, the result is not deleted, the badge is only hidden for that user.
If an application without an error has been made within the last five minutes, the Applied badge is displayed in the row; this badge is not clickable.
If there is an analysis going on, the progress bar and the number of the logs read up to that moment are displayed in the row.
If there is more than one host group
If more than one host group is defined in the vService, there is additionally the Collective Analysis & Learning row on the host group management card and it offers the same two targets for the whole of the vService. While there is a single host group, this row is not displayed.
The List of the Past Analyses
When the house icon in the Analysis & Learning row is clicked, a new tab titled Analyze - <host group name> opens and the analyses that have been run before for that host group are listed. Over this screen the analysis creating, editing, applying and deleting operations are done.
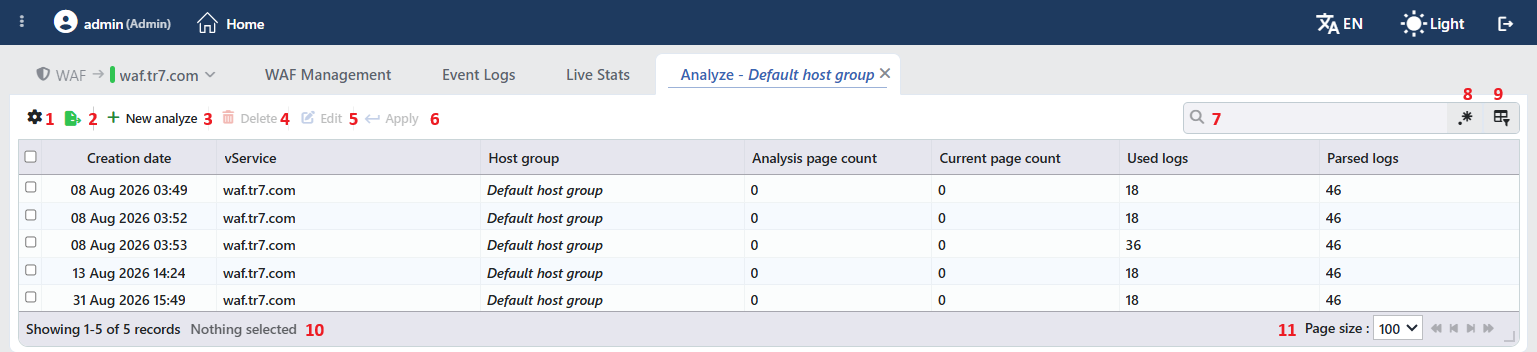 The List of the Past Analyses
The table opens with the following columns by default:
| Column | Description |
|---|---|
| Creation Date | The date and time at which the analysis was created. |
| vService | The vService on which the analysis was run. |
| Host Group | The host group the row belongs to; an analysis run for more than one host group produces a separate row for every group. |
| Analysis Page Count | The number of the different addresses the analysis has found raw (The Two Counters). |
| Current Page Count | The number of the page types remaining after the grouping and the thresholds have been applied, to be written when applied. |
| Used Logs | The number of the log lines that match this host group and pass the filters. |
| Parsed Logs | The number of the log lines read across the vService in the selected period. |
There is no column hidden by default.
The items in the toolbar are arranged from left to right in the following order; the last two items (Page Information and Page Size) are located in the information strip below the table.
Columns
Which columns are shown in the table is selected. In the same panel, columns are reordered by dragging and alignment is selected per column; the row height is fitted to the page with the Fit rows to the page button, and the column layout is reset to default with the Reset button. The layout is stored per user.
Export
The table is exported as Excel, CSV or PDF by clicking the Export button. In the window that opens, the Filename, Format and Data Source, together with the Columns to be exported, are determined; the remaining fields are displayed according to the format: CSV Separator for CSV, Excel Sheet Name for Excel, and Page Orientation and Page Size for PDF.
New Analyze
The new analysis creation window is opened by clicking the New Analyze button.
Delete
When one or more rows are selected and the Delete button is clicked, the related analysis records are deleted. The operation is verified with the Are you sure? confirmation. The same operation is also in the right-click menu.
The deletion removes only the selected row, that is the analysis and host group pair; if the analysis has been run for more than one host group, the record stays in the list for the other groups. When the whole of the analysis is deleted, the application history belonging to it is removed as well. The rules that have been applied before are not touched under any condition.
Edit
When a single row is selected and the Edit button is clicked, a new tab titled Analyze Page Types - <host group name> opens and the analysis result is edited before it is applied.
On the left side there is the learned page tree, on the right the sub elements of the selected node; the result can be applied directly from this screen. The whole of the screen is explained in the The Analyze Page Types Screen section.
If there is no log processed in the selected analysis, the editing screen does not open; instead a warning that suggests deleting the analysis is displayed.
Apply
When one or more rows are selected and the Apply button is clicked, the analysis result is applied to the rule set of the host group. The operation is verified with the Are you sure? confirmation. The details are in the The Application of the Analysis Result section.
Search
Used to search all information in the table.
RegExp Search
Used to search all information in the table with a regular expression (RegExp).
Column Based Search
Used to perform a column-based search on the information in the table.
Page Information
There is information belonging to the total number of the analyses and to the analysis range displayed in the list: Showing N-M of T records and the number of the selected rows (N selected, Nothing selected while there is no selection).
Page Size
The maximum number of the analyses to be displayed on the page is selected. The default is 100; the options are 5, 10, 20, 50, 100, 200, 500 and All. The selection is not stored.
The numbers not matching each other
Parsed Logs counts all the log lines read in the selected period across the vService; Used Logs, on the other hand, only the lines that match this host group and pass the filters. In the difference between them there are, besides the traffic the filters eliminate, the traffic of the other host groups and the host names that match no group; only the share of the filters is seen in the Filter Reasons list in the preview window.
While Used Logs is high, Analysis Page Count may stay low: if the Rule Creating Mode setting is at a value other than Comprehensive, the simple requests that carry no query, body or dynamic method are processed but do not produce their own page type. When Page Independent is selected, on the other hand, no request produces a page type.
Both numbers being zero means that there is no learning log in the selected period.
Right-Click Menu
When a row is right-clicked, a menu with three operations opens. The operations are applied only to the right-clicked analysis; the selection made in the list does not affect the menu.
| Operation | What it does |
|---|---|
| Delete | It deletes the analysis record; the same confirmation question as the deletion on the toolbar is displayed. |
| Edit | It opens the Analyze Page Types tab on which the analysis result is edited. |
| Apply | It applies the analysis result to the rule set of the host group; the same confirmation question as the Apply on the toolbar is displayed. |
While the operation is going on, the menu items are not displayed. New Analyze does not take place in the menu.
The Preview of the Selected Analysis
When an analysis is clicked in the list, the preview window opens on the right side of the screen. In the title of the window there is the name of the host group, and below it the vService on which the analysis was run.
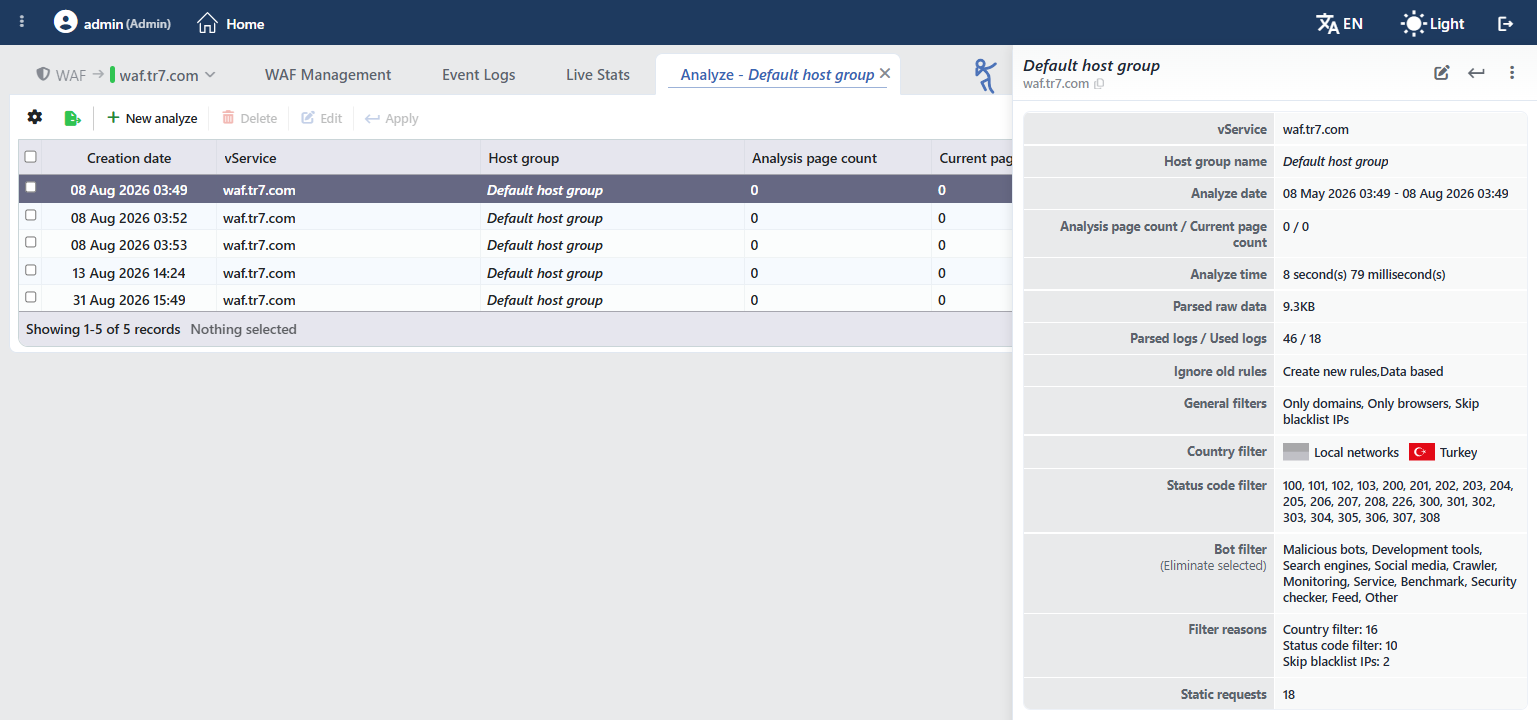 The Preview of the Selected Analysis
| Operation | What it does |
|---|---|
| Edit | It opens the Analyze Page Types tab on which the analysis result is edited. |
| Apply | It applies the analysis result to the rule set of the host group; the details are in the The Application of the Analysis Result section. |
| Delete | It takes place in the menu in the title; it deletes the analysis record. |
In the window all the parameters of the analysis are listed: vService, Host Group Name, the Analyze Date range, Analysis Page Count / Current Page Count, Analyze Time, Parsed Raw Data, Parsed Logs / Used Logs, the Ignore Old Rules policy with the selected Rule Creating Mode, General Filters, Country Filter, Status Code Filter, Bot Filter, Source IP Filter, Host Filter, the Filter Reasons breakdown and the number of Static Requests; in a cluster setup there is additionally the Source field. In the title of the filters that have been set up in the Eliminate Selected direction, this information is written as a lower line. If the analysis has ended with an error, the error message is displayed here as well.
Creating a New Analysis
When the Analysis & Learning text on the mode card or the New Analyze button in the list is clicked, the window titled New Analyze for <vService name> opens.
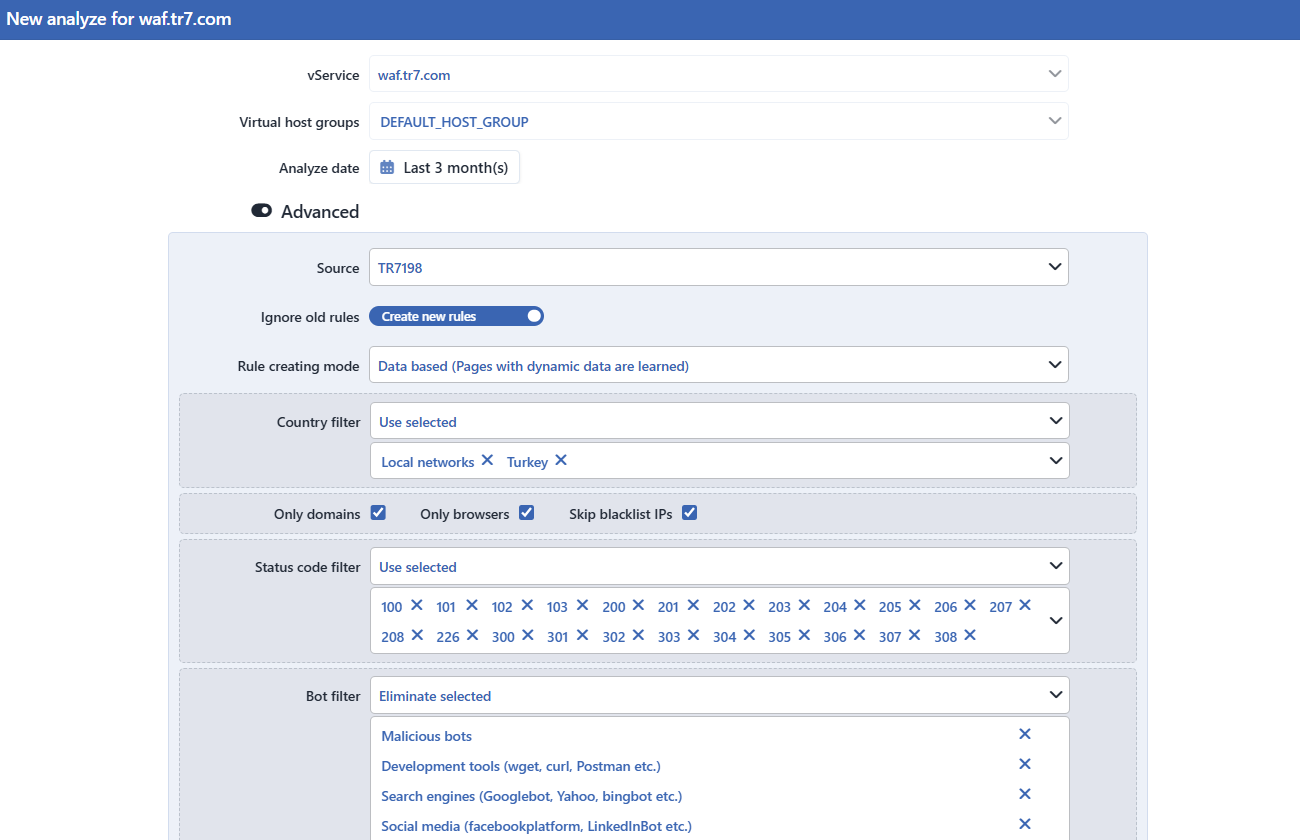 Creating a New Analysis - The Basic Fields and the Upper Half of the Advanced Section
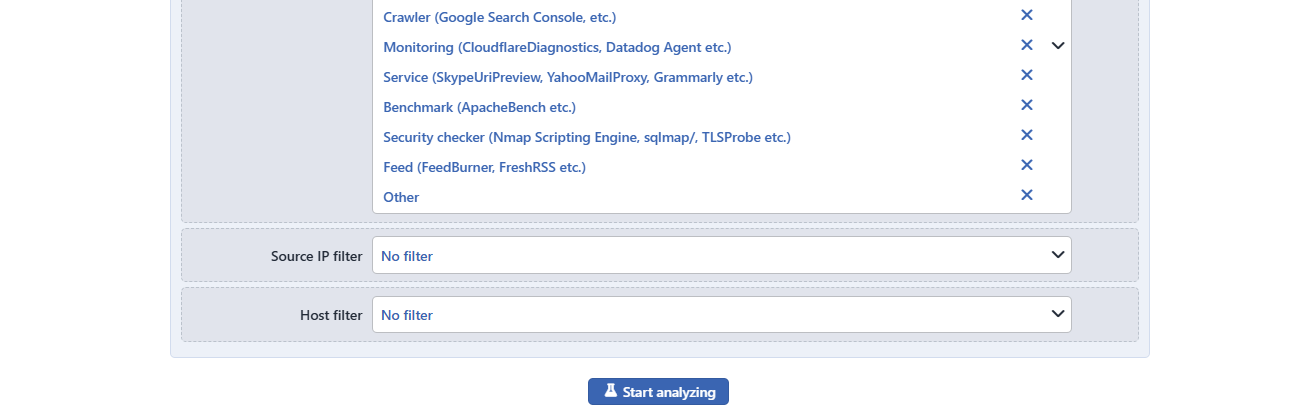 Creating a New Analysis - The Lower Half of the Advanced Section
INFO
vService
The vService on which the analysis will be run is selected. In the list there are all the vServices with WAF protection enabled.
When the window is opened from the WAF management of a vService, this field is passive and is fixed to that vService.
INFO
Virtual Host Groups
The host groups to be included in the analysis are selected; more than one group can be selected together and a separate analysis result is produced for every group.
When the window is opened from a certain host group, the field is passive and is fixed to that group; when it is opened from the vService level, on the other hand, all the groups come selected.
Leaving this field empty leads to the analysis being completed without a result; at least one group should be left selected.
INFO
Analyze Date Default: Last 3 month(s)
The time range the analysis will cover is selected. The ready ranges are offered as Last 1 day(s), Last 3 day(s), Last 1 week(s), Last 2 week(s), Last 1 month(s) and Last 3 month(s).
With Custom Duration a custom duration in minutes, hours, days, weeks, months or years; with Custom Date Range a start and end date can be entered. The range resolution is one minute.
The widest range that can be selected is approximately ten years; when a bigger range is entered, the field gives an error.
The hours in the range in which there is no learning log are skipped silently; for this reason selecting a wide range does not lengthen the analysis, only the existing logs are read.
INFO
Advanced Default: On
It determines the visibility of the advanced fields. When the switch is turned off, the fields are hidden but their values are preserved and are sent to the analysis; the values sent are the form values saved earlier by the user, not the defaults of the fields.
The position of the switch is not stored: at every opening of the window the advanced section comes open.
INFO
Source
It is selected whose learning log the analysis will read. The options are both devices and the own names of the devices; by default the device being worked on is selected.
This field is displayed only in cluster setups. When both devices are selected, a separate analysis runs on the two devices and the results are combined.
INFO
Ignore Old Rules Default: Create New Rules
It determines what the analysis will do with the existing rules. The text of the selected state is written above the switch.
| Option | Meaning |
|---|---|
| Create New Rules | The existing rule list of the host group is ignored and the rule set is set up from scratch. |
| Combine With Old Rules | The existing rules are preserved and are widened with the analysis result; the numeric limits are loosened, the argument lists are merged. |
INFO
Rule Creating Mode Default: Data Based
It determines which requests the analysis will count as a separate page type.
| Option | Meaning |
|---|---|
| Comprehensive (Each page is learned) | Every request produces its own page type. Every access that has not been learned is blocked; it is the narrowest rule set and the one that requires the most maintenance. |
| Data Based (Pages with dynamic data are learned) | Only the requests that carry a query, a body or a dynamic method produce a page type; the simple page accesses fall to the default rule. |
| Page Independent (Pages are not learned) | No page type is produced; all the access is inspected over a single default rule. |
INFO
Country Filter Default: Use Selected
It is determined which countries the requests to be included in the analysis come from.
| Option | Meaning |
|---|---|
| No Filter | No country distinction is made. |
| Use Selected | Only the requests coming from the selected countries are analyzed. |
| Eliminate Selected | The requests coming from the selected countries are left out of the analysis. |
By default only Local Networks and Turkey are selected; an analysis run with the default settings leaves out all of the requests coming from the other countries.
The Local Networks option at the beginning of the list meets the local and private network addresses; for the intra-organization traffic to be included in the analysis, this option needs to stay selected. The public IP addresses that have no counterpart in the geographic database have no counterpart in the list: in the Use Selected mode these requests stay out of the analysis whichever countries are selected.
INFO
Only Domains Default: Checked
When it is checked, the requests whose Host header is not in a valid domain name form are left out of the analysis. The Host headers that contain an upper-case letter, that carry a port (site.example:8443) and that use an IPv6 literal are eliminated this way. The accesses made with a plain IPv4 address count as valid and are not eliminated.
INFO
Only Browsers Default: Checked
When it is checked, only the requests coming from the clients that are recognized as a browser are analyzed. The requests that carry no client information or that cannot be parsed as a browser are eliminated.
INFO
Skip Blacklist IPs Default: Checked
When it is checked, the requests coming from the sources that take place as individual addresses in the IP Intelligence & Reputation blacklist are left out of the analysis. Thus learning a rule from the traffic of the known malicious sources is prevented.
The network (CIDR) entries in the blacklist do not match in this filter: although WAF continues to block these networks, the analysis reads their traffic.
INFO
Status Code Filter Default: Use Selected
It is determined which status codes the requests to be included in the analysis carry. The options are No Filter, Use Selected and Eliminate Selected.
By default all the codes below 400 are selected. The requests that return an error (400 and above) stay out of the analysis by default; since these requests are mostly invalid or attacker traffic, learning a page type and an argument list from them is not wanted.
INFO
Bot Filter Default: Eliminate Selected
It is determined whether the traffic coming from the automatic clients will be included in the analysis or not. The options are No Filter, Use Selected and Eliminate Selected.
By default Eliminate Selected is selected and all of the following categories are checked; that is, all the bot traffic is left out of the analysis.
- Malicious Bots
- Development Tools (wget, curl, Postman etc.)
- Search Engines (Googlebot, Yahoo, bingbot etc.)
- Social Media (facebookplatform, LinkedInBot etc.)
- Crawler (Google Search Console, etc.)
- Monitoring (CloudflareDiagnostics, Datadog Agent etc.)
- Service (SkypeUriPreview, YahooMailProxy, Grammarly etc.)
- Benchmark (ApacheBench etc.)
- Security Checker (Nmap Scripting Engine, sqlmap/, TLSProbe etc.)
- Feed (FeedBurner, FreshRSS etc.)
- Other
The requests that carry no client information are caught by this filter independently of the selected mode and stay out of the analysis.
INFO
Source IP Filter Default: No Filter
The source addresses to be included in or left out of the analysis are determined. The options are No Filter, Use Selected and Eliminate Selected.
An IP address and a network mask (CIDR) are entered in every line; a wildcard character is not supported. The lines entered invalid are ignored silently.
If Use Selected is selected and the list is left empty or all the lines are invalid, no request matches and the analysis stays without a result. The requests that carry no source address are caught by this filter independently of the selected mode.
INFO
Host Filter Default: No Filter
The host names to be included in or left out of the analysis are determined. The options are No Filter, Use Selected and Eliminate Selected.
A host name is entered in every line. A wildcard character is supported (such as dev*); the entries that carry no wildcard are evaluated as an exact match and the case distinction is observed.
If Use Selected is selected and the list is left empty, no request matches and the analysis stays without a result. The requests that carry no Host header are caught by this filter independently of the selected mode.
INFO
Start Analyzing
The analysis is started by clicking the Start analyzing button. The operation runs in the background; the window closes and the progress is watched from the bar on the mode card. The details are in the Starting the Analysis section.
The argument lists are not managed from this window
Whether the argument lists (the allowed query parameter, header and form field names) will be learned or not is determined not from this window but from the Argument Checks setting on the Checks screen of the vService. While the analysis is being created, the setting at that moment is saved and the application works according to this saved value as well.
The form being remembered
When the analysis is started, the filters selected in the window are stored per user, separately for every vService, and the window comes with these values at the next opening. Host Filter (including its mode), Ignore Old Rules, the Advanced switch and the host group selection are not stored within this scope; these come with their default values at every opening.
Starting the Analysis
When the analysis is started, the window closes and the operation continues to run in the background. The analysis runs as a single process for all of the host groups selected in the window; the progress is displayed as a separate bar on the mode card of every selected host group.
The Progress Bar
 The Analysis Progress Bar
The label of the bar carries two values together: the completion percentage and the number of the log lines read up to that moment. The percentage is calculated according to the size of the log files read; not according to the number of the log lines.
The bar of a process is displayed only on the cards of the host groups it has taken into its scope; if more than one process is running for the same host group, every one of them is listed as a separate bar. If an analysis has been run for more than one host group, the same process is seen separately on the cards of the related groups and the two values in the bar are the same on every card as well: both of them belong to the whole of the process. The number of the lines falling to the host group is displayed only in the Used Logs value in the detail window.
The same bar is displayed while the analysis result is being applied as well; in this case the Task Type field takes the value Applying Rules and the bar is shown in a different color.
The Details of the Running Analysis
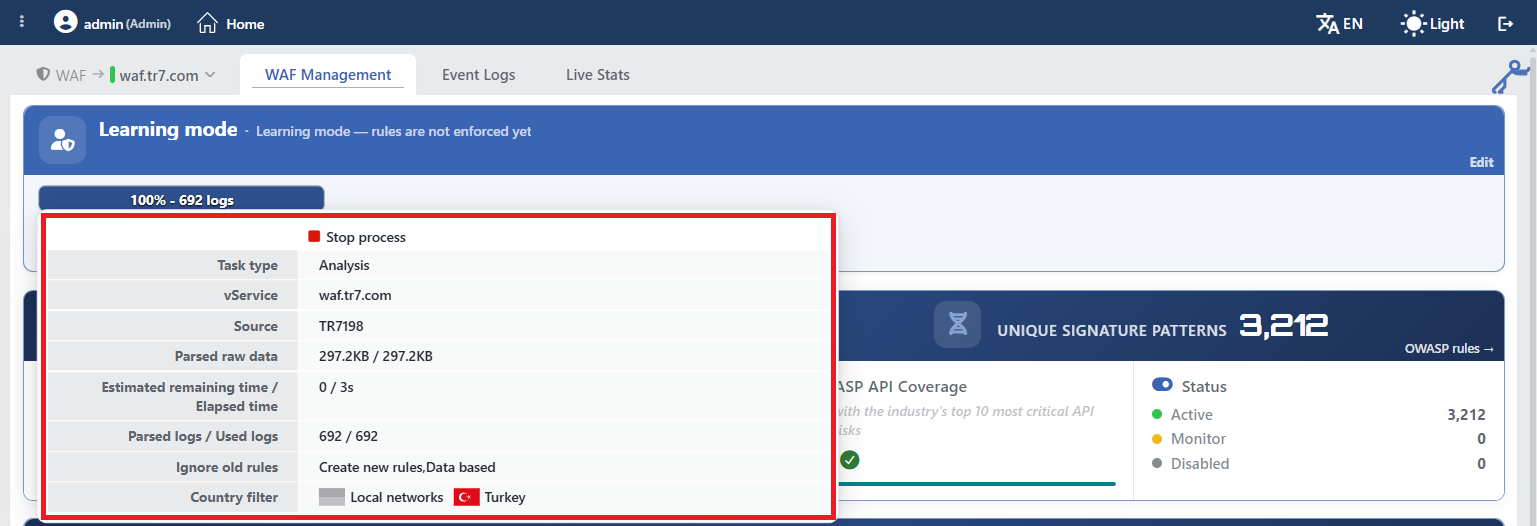 The Details of the Running Analysis
When the progress bar is clicked, the window that shows the current state of the analysis opens. In the window there are the following fields:
| Field | Meaning |
|---|---|
| Task Type | The type of the running job. |
| vService | The vService on which the analysis was run. |
| Source | The device from which the logs are read. |
| Parsed Raw Data | The amount of data read and the total amount of data. |
| Estimated Remaining Time / Elapsed Time | The estimated remaining time and the elapsed time. |
| Parsed Logs / Used Logs | The total log lines read and the number of the lines falling to this host group. |
| Ignore Old Rules | The attitude of the analysis towards the old rules and the selected Rule Creating Mode value are shown together, separated by a comma. |
| General Filters, Country Filter, Status Code Filter, Bot Filter, Source IP Filter, Host Filter | The filters selected in the analysis. |
| Filter Reasons | The reason breakdown of the eliminated logs. |
The filter rows are listed only if that filter has been used; the filters left empty do not take place in the window. In the cases in which the filter has been set up in the Eliminate Selected direction, this information is added as a note below the field name.
The estimated remaining time is calculated from the elapsed time and the completion percentage. Since the log density changes from file to file, this value is recalculated as the analysis progresses.
Stop Process ends the analysis without a result
The Stop Process operation above the window ends the running analysis process. The process closes with the message User ended the process; a partial result is not produced from the logs read up to that moment, no rule suggestion is formed.
A record is formed in the list for the stopped analysis as well; this record carries an error message instead of a result. Since the record is included in the analysis count limits, it should be deleted manually if it is not needed. If the analysis is to be run again, the process starts from the beginning.
The source and the detail view in a cluster setup
In a cluster setup the Source row is added to the window. If both devices have been selected as the source, by opening the Details switch at the beginning of the row, the data read, the duration, the log numbers and the Filter Reasons breakdown are displayed in separate columns per device. If an error has occurred on one of the devices, the error message is listed only in this view as well. The position of the switch is stored per user.
The Completion of the Analysis and the New Badge
When the analysis is completed, the progress bar disappears and the New badge appears at the right end of the Analysis & Learning row.
The badge is displayed for the newest analysis of that host group and only while the result has not been applied yet. When the result is applied, the New badge disappears; in its place comes the Applied badge that states that the operation has been completed without an error. This badge is temporary and is displayed only for five minutes after the application; afterwards no badge remains in the row. If the application has ended with an error, the badge is not displayed at all. The Applied badge is for information purposes, it is not clicked.
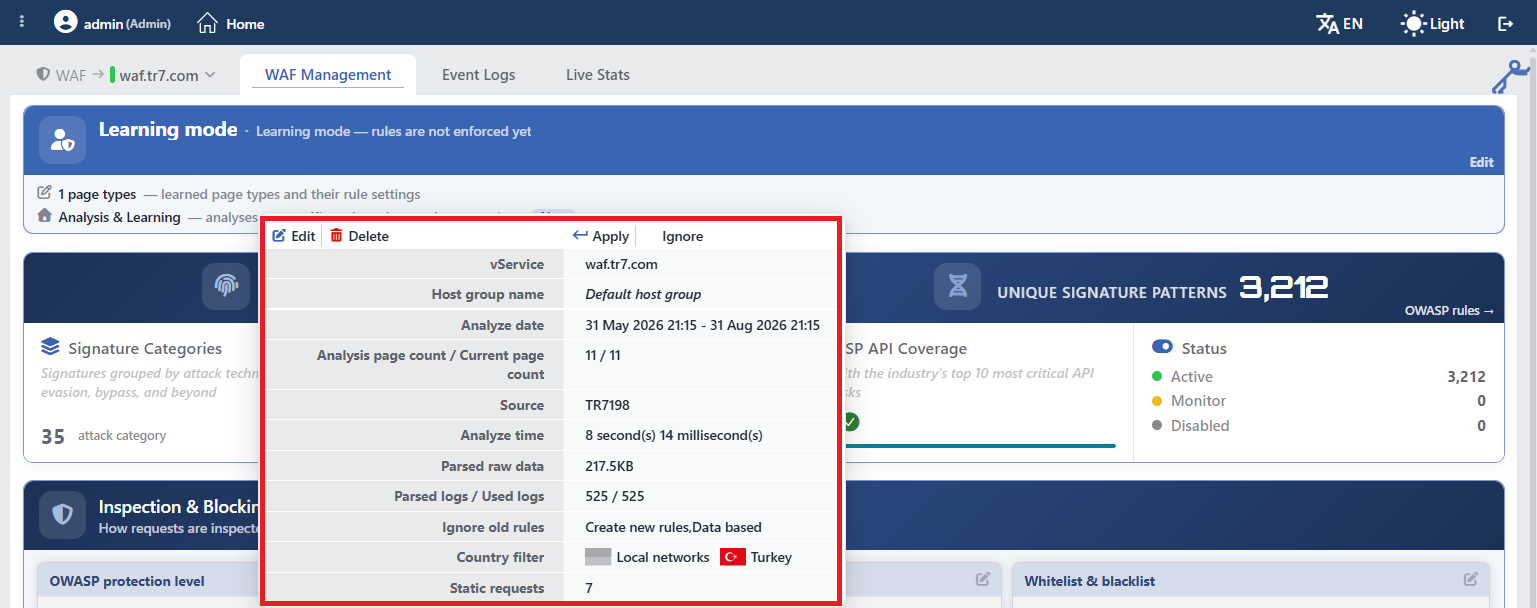 The New Analysis Badge and the Result Summary
When the badge is clicked, the summary of the analysis opens. The content of the window is the same as The Preview of the Selected Analysis; the operation buttons, on the other hand, are four:
| Operation | What it does |
|---|---|
| Edit | It opens the Analyze Page Types tab on which the analysis result is edited. |
| Delete | It deletes the analysis record; it is verified with the Are you sure? confirmation. If the analysis has been run for more than one host group, only the record of the related host group is deleted. |
| Apply | It applies the result to the rule set of the host group; it is verified with the Are you sure? confirmation. |
| Ignore | It removes the badge. |
What Ignore changes
Ignore does not delete the analysis and does not touch the rule set; it only hides the badge. The ignoring information is stored per user: when another user opens the same host group, the badge continues to be seen.
The ignored analysis continues to stay in the list of the past analyses and can be edited and applied from there. When a newer analysis is completed for the same host group, the badge is displayed again.
The Analyze Page Types Screen
The page tree the analysis produces is edited on the Analyze Page Types screen before it is written into the rule set. The screen is opened in three ways: by selecting a row in the list of the past analyses and clicking the Edit button, with the Edit icon in the preview window or from the window of the New badge on the mode card. In all three ways a new tab titled Analyze Page Types - <host group name> opens.
If there is no log processed in the analysis for the related host group, the tab does not open; instead a warning that suggests deleting the analysis is displayed.
The purpose of the screen is to narrow the raw analysis result: the addresses that are the same as each other are gathered into a single pattern, the irrelevant directories are taken out of the analysis and the thresholds needed for a page to produce a rule are determined. With every change made, the tree is recalculated; the number of the page types to be written when applied is watched in the Current Page Count field. This value is displayed in the summary window at the right end of the toolbar and in the list of the past analyses.
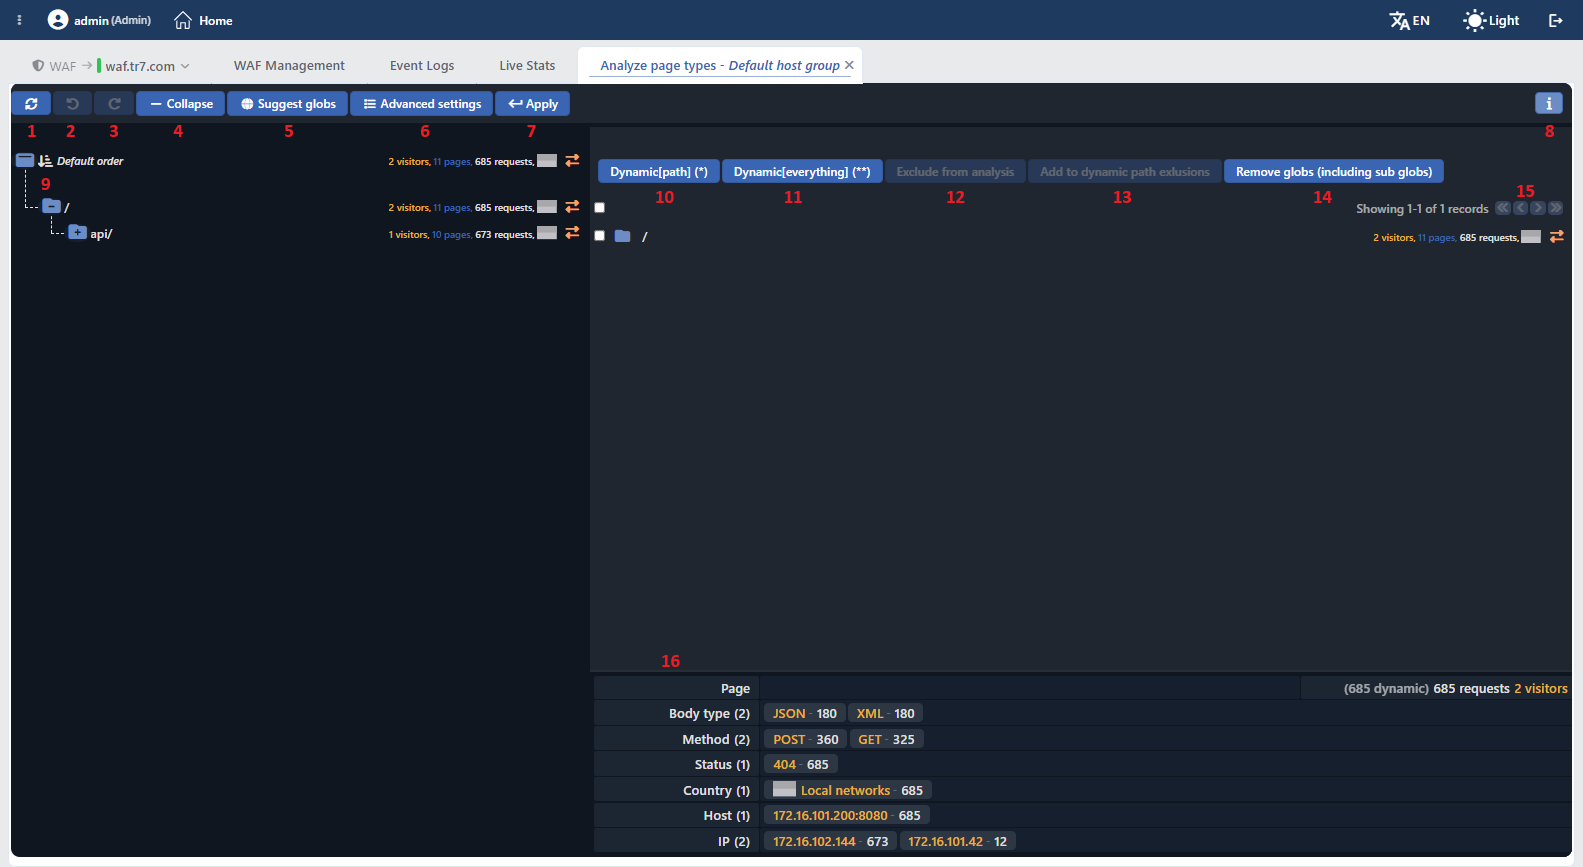 The Analyze Page Types Screen
The screen consists of two panes: on the left the tree of the learned addresses, on the right the sub elements of the selected node and the operations that work on those elements. In the left tree only the directories are listed; the pages are displayed in the right pane. At most 30 sub directories of a branch are listed, the rest are gathered in the +N row.
In every row the number of visitors and the number of requests, and in the directory rows additionally the number of sub pages with the country of the row that receives the most requests are displayed; the counters whose value is zero are not written. The Page Has Data icon at the end of the row becomes active in the addresses in which there is a request that carries a query, a body or a dynamic method, and is displayed pale if there is no such request; in the tooltip of the icon the number of dynamic requests is written.
The Reset, Undo and Redo operations on the toolbar take place only with an icon; their names are displayed in the tooltip of the icon.
Reset
It removes all the editings made on the tree and returns the analysis result to its first state. The resetting returns to the default not only the glob and exclusion lists but also the thresholds under Advanced Settings and the Don't Learn OWASP Exclusions selection. The operation itself is also recorded as a step that can be undone.
Undo
It undoes the last editing. The button is passive if there is no step to be undone.
Redo
It applies the undone editing again. The button is passive if there is no step to be redone.
Collapse
It closes all the branches in the tree and only the root level stays open.
Suggest Globs
It scans the tree and suggests a glob pattern for the addresses that resemble each other. The button first opens a form in which the suggestion parameters are entered:
| Field | Meaning | Default |
|---|---|---|
| Minimum Glob Depth | The smallest directory depth at which the suggestion can start. | 2 |
| Minimum pages for a glob | The least number of pages that need to be below a pattern for it to be suggested. In this version the suggestion threshold is calculated with a fixed base value independently of the value of the field. | 3 |
| Maximum consecutive stars (*, */* ...) | The maximum number of stars that can come one after another in a pattern. | 5 |
| Globstar (**) | Whether the ** patterns that cover all the sub depths will be suggested or not. | Off |
| Minimum pages for globstar | The least number of pages needed for a ** pattern to be suggested. | 10 |
| Maximum Depth Before Globstar | The maximum directory depth at which the ** pattern can start. | 3 |
| Minimum Lowest Glob Similarity | The lowest similarity threshold between the addresses that will enter the pattern. | 0.5 |
| Minimum Average Glob Similarity | The average similarity threshold of the addresses that will enter the pattern. | 0.8 |
The last two fields are displayed only while Globstar (**) is on.
The suggestions are listed with the Glob, Glob Members, Average Similarity and Minimum Similarity columns; Glob Members shows the number of the pages the pattern covers, and the tooltip the covered addresses. The addresses that have already been gathered in a pattern or that are in the exclusion list stay out of the scan.
The selected patterns are added to the Dynamic Paths list with the Accept selected globs button; without any pattern being selected, this button cannot be used.
Advanced Settings
It opens the settings that determine how the tree will be set up. At the top of the window there are four setting groups and the fields of the selected group are displayed:
| Group | Its content |
|---|---|
| Excluded Paths | The addresses to be left out of the analysis. The addresses here are taken out of the tree and produce no rule; a glob pattern can also be written in the lines. |
| Dynamic Paths | The glob patterns to be accepted as dynamic. The addresses the pattern covers are gathered in a single page type. |
| Dynamic Path Exclusions | The addresses that will preserve their own page type even if they enter the scope of a dynamic pattern. |
| Filter | The lower limits needed for a page to produce a rule and the learning scope. |
The fields in the Filter group are the following:
| Field | Meaning |
|---|---|
| Min Requests | The least number of requests needed for a page to produce a rule. |
| Min Visitors | The least number of visitors needed for a page to produce a rule. |
| Min Ips | The least number of source IPs needed for a page to produce a rule. |
| Country Limit | The least number of countries needed for a page to produce a rule. |
| Max Logs Per Path | The maximum log lines to be processed for a page; its default value is 10,000. |
| Don't Learn OWASP Exclusions | When it is checked, the signature exclusions are not learned. |
The smallest value of the numeric fields is 2; for a field left empty no threshold is applied.
When the Min Ips field is filled, the Min Visitors threshold is not evaluated; the visitor threshold is applied only while Min Ips is empty. Max Logs Per Path, on the other hand, is not processed when it is changed on its own; for the new value to be valid, it needs to be saved together with another setting.
Apply
It applies the edited result to the rule set of the host group. The operation is verified with the Are you sure? confirmation; after the confirmation it is inspected whether there is a log processed in the analysis and if there is no log, the application is not started. The details are in the The Application of the Analysis Result section.
The Analysis Summary
The icon at the right end of the toolbar opens the parameter summary of the analysis being edited. The content is the same as The Preview of the Selected Analysis; in this window there are no operation buttons.
The icon is displayed when the screen is opened with the Edit icon in the preview window or from the New badge; it does not take place in the tab opened with the Edit button in the list of the past analyses.
Sorting
When the sorting field at the very top of the tree is clicked, a window opens. In the window the criterion is determined from the Order By list (Default Order, Total Visitors, Alphabetical Order, Total Requests, Top Country), and the direction (Ascending Order / Descending Order) from the options below it. The icon at the beginning of the field shows the direction in force, it is not clickable.
In the .. row of the right pane there is a separate sorting field that carries the same options; the sorting of the two panes is independent of each other.
Dynamic[path] (*)
It accepts as dynamic the single directory level in which the selected elements are: for that level the <path>/* and <path>/*/ patterns are created and the addresses at the level are gathered in a single page type. If there are elements at the same level that have not been selected, these are added to the Dynamic Path Exclusions list so as to preserve their own page types.
If no element has been selected, the operation covers all the elements in the open directory and no exclusion is created. The button cannot be used only while the open directory is empty.
Dynamic[everything] (**)
It accepts as dynamic the directory in which the selected elements are and all the depths below it; for this a single <path>/**/* pattern is created. The selection and exclusion behavior is the same as Dynamic[path].
Exclude From Analysis
It adds the selected addresses to the Excluded Paths list; these addresses are taken out of the tree and produce no rule. The button cannot be used without at least one element being selected.
Add To Dynamic Path Exlusions
It adds the selected addresses to the Dynamic Path Exclusions list. Thus an address that enters the scope of a dynamic pattern preserves its own page type. The button cannot be used without at least one element being selected.
Remove Globs (Including Sub Globs)
It removes the glob patterns below the selected rows, together with their sub patterns, from the Dynamic Paths list. Thus the gathered addresses produce a page type one by one again. If no row has been selected, the operation works for the whole of the open directory.
Pagination
In the right pane at most 15 rows are listed on a page. If the number of rows exceeds this, the pages are navigated with the arrows in the title; on the left side the displayed and the total number of rows are written.
The Summary of the Selected Page
When a row is clicked, the summary belonging to that address opens at the bottom of the screen: the number of requests and visitors, the number of dynamic requests with the Extension, Body Type, Method, Status, Country, Host and IP breakdowns. The number next to every title states how many different values have been seen in that field; in every breakdown the first eight most seen values are listed.
The Extension and Body Type breakdowns are displayed only when they carry a value; the other titles are listed with the (0) number even if there is no value.
Navigation and selection
When a branch is selected from the tree in the left pane, the right pane lists the sub elements of that branch. By double-clicking a branch in the tree, the branch is opened and closed; when it is right-clicked, on the other hand, a menu that runs the Dynamic[path], Dynamic[everything], Exclude from Analysis, Add to dynamic path exlusions and Remove Globs operations for that branch opens.
In the right pane one enters into a directory by double-clicking it, and returns to the upper directory by double-clicking the .. row at the beginning of the list.
The elements are selected with the boxes at the beginning of the rows; the box in the title selects together not only the visible page but all the elements in the open directory. The operation buttons work on the selected elements.
The changes are saved instantly and permanently
Every editing made on the tree is written into the analysis record without a separate saving step and is preserved even if the tab is closed. The editing does not touch the rule set; the live rules change only with Apply.
The Undo and Redo history, on the other hand, is kept only in the running process: when the service is restarted, the step history is reset, the editings themselves are preserved.
The page type limit of the application
While the Current Page Count value exceeds 500, the application is rejected. In this case the addresses should be gathered with the glob suggestions or the tree should be narrowed by raising the lower-limit thresholds.
The screen during the application
When the application is started, the progress bar is displayed at the right end of the toolbar and the screen is closed to editing. When the bar is clicked, the detail window of the process opens. When the operation ends, the Rules applied notification is given; in a cluster setup, if an error has occurred on one device, the error text is shown together with the device name.
As soon as the application ends, the Apply Date information and the application time are displayed in the same place; this information disappears after five minutes have passed since the last application.
The Application of the Analysis Result
The Apply operation writes the analysis result into the live rule set of the host group. The operation is verified with the Are you sure? confirmation; if the confirmation window is cancelled, the request is not sent.
When the application is completed, if the editing screen of that analysis is open, the Rules applied notification is displayed; if an error has occurred on one of the devices, instead of the notification a message that gives the error with the device name appears. When the application is started from the list or from the preview title, a separate completion notification is not given; the result is watched from the Apply Date information on the editing screen and from the Applied badge on the mode card.
 The Application Completed Notification
The result is written into the Page Types list of the host group. Every page type the analysis produces is listed with its own path pattern; the Check Fields column shows which inspection fields have been defined in that page type. The italic Any Paths row at the end of the list is the default rule the requests that match no pattern fall to.
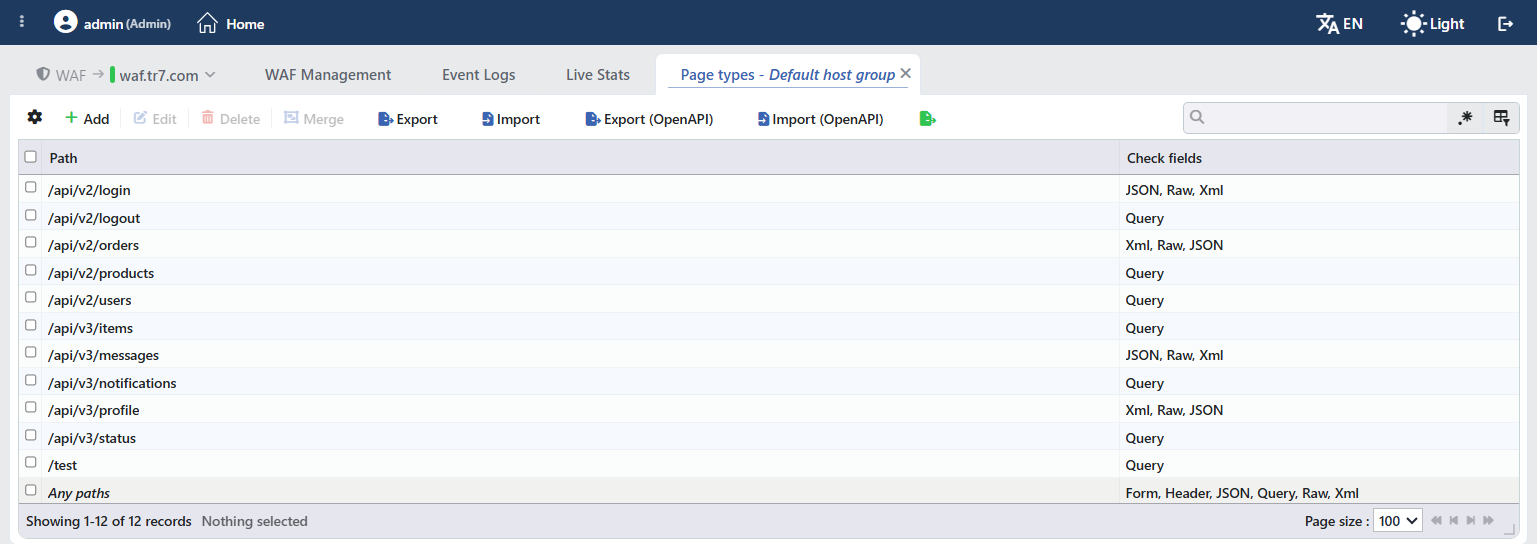 The Page Types List After the Application
The application changes the rule set of the host group
During the application the rule list of the host group is replaced with the analysis result. The name, the mode, the host patterns and the default group mark of the group are preserved; the rules, on the other hand, take the state the analysis has produced.
If the host group has been deleted after the analysis was created, this protection does not work: the group is created again with the old name, mode and host list the analysis carries.
The application takes as its basis the rule copy at the moment the analysis was created. For this reason the rule editings made manually after the analysis date are lost whatever value the Ignore Old Rules setting has. While the setting is in the Create New Rules state, on the other hand, the old rules are thrown away entirely and the rule list of the host group consists only of the rules the analysis has produced.
There is no separate operation for undoing the application. Since the application of the analysis, differently from the teaching operations made manually, does not produce a user log record, it cannot be undone with the Revert Learning operation on the Log timeline either. If the rules need to be preserved, they should be exported with Export before the application.
The application also updates the Rule Creation Policy setting
When the analysis is applied, the Rule Creation Policy setting on the Learning Methods screen of the vService is updated with the Rule Creating Mode value selected in the analysis. A separate confirmation is not asked for this change.
If it is not wanted that the permanent policy change, while the analysis is being created the Rule Creating Mode field needs to be left the same as the existing policy of the vService.
How the application works
The application does not content itself with writing the saved tree: it also produces the values of the rules (the allowed methods, the size and length limits, the argument lists) by reading again the learning log in the same time range. The signature exclusions are learned only if the Don't Learn OWASP Exclusions option on the editing screen has been removed; this option is checked by default.
Since the reading is done again, the operation takes at least as long as the analysis itself. Since there is no line limit in the application reading as there is in the analysis creation, it may take even longer in very big logs.
The upper limits of the argument number and of the signature exclusions are read not from the frozen copy but from the settings of the vService at the moment of the application.
The result is applied in the same way as editing a single WAF rule from the interface: the WAF configuration is produced again and put into service, a separate deployment step or a service restart is not needed.
The applied analysis is not deleted from the list and can be applied again later. However, the reapplication reads the logs in the state they are on the disk at that moment: if the log files have been deleted or rotated in the time that has passed, the missing files are skipped silently and the produced rule set may be narrower than the previous one.
The cases in which the application is prevented
While another application is going on for the same host group, a second application cannot be started.
If the number of the page types in the result exceeds 500, the application is rejected; in this case the tree should be narrowed from the editing screen by raising the lower-limit thresholds or by leaving the directories out of the analysis.
If no log has fallen to this host group in the analysis, that is if the Used Logs value is zero, the application is not started; instead a warning that suggests deleting the analysis is displayed. This inspection is done in the interface: while a single analysis is being applied, the request is not sent at all.
If the page tree of the analysis has not been prepared yet, the application is rejected.
When it is wanted that more than one analysis be applied at the same time, if one of the selected ones is caught by the ongoing application, the page type number or the unprepared tree inspection, the request is rejected entirely and none of them is applied. The Used Logs inspection is separate from this: a separate deletion question is displayed for every selection with zero logs, and if at least one of the selected ones contains a log, the request is still sent.
Scope and Limits
INFO
- The analysis does not affect the traffic. The analysis is an entirely offline log reading job; it runs in a separate process and does not touch the traffic, the WAF inspection or the existing rules. Only while the analysis or the application process is running, the hourly compression of the learning logs of the related vService is postponed.
- The reading limits. If more than 5,000 different paths are seen in a host group, only the 5,000 paths that receive the most requests are carried into the analysis; the rest fall silently and Analysis Page Count is limited at this value. While the analysis is being created, at most 10 million lines are read from a single hourly log file; the rest of the file that exceeds this limit is not read. In the rereading at the application stage this limit is not applied.
- The analysis count limits. At most 250 analysis records are kept on the device and at most 50 per vService. The counting is per host group: an analysis run for three host groups counts as three records. Since the inspection is done before the analysis is started, an analysis with many host groups may carry the total somewhat above the limit. When the limit is reached, a new analysis cannot be started and an error that asks for the old records to be deleted is displayed; the analysis records are not cleaned by themselves. At most three application histories are kept for every analysis. This number is per analysis record: in an analysis run for three host groups a single application fills all of the three records.
- The behavior in a cluster. The analysis runs on the device selected in the Source field and every device reads the logs on its own disk. When both devices are selected, the results are combined and a device based breakdown can be displayed in the preview. The application runs on both devices and the results are combined. If one of the devices gives an error, the rule set is not changed at all: the error is displayed, a record without a result is written into the application history and Rule Creation Policy is not updated either. The analysis records are not synchronized between the devices: every device keeps its own list. The applied rules, on the other hand, are carried to the peer with the normal configuration synchronization.
