
Smarter by Design.Simpler for Business
Route Tables & L4 DDoS
What Is Route Tables & L4 DDoS?
Route Tables & L4 DDoS lists the route tables defined on TR7 in the Left Monitor Panel together with their statuses and the value of a selected network or L4 DDoS metric. All the route tables including DEFAULT are in the list. Every row is a route table; the colored strip on the left of the row shows the status of the route table and the column on the right shows the value of the selected metric. When a row is clicked, the Dashboard tab of that route table opens on the main screen.
In the list, the network traffic metrics of the route tables and the L4 DDoS protection metrics (threat state, quarantine, dropped traffic, protection modes) are selected together; the three metrics of Bot/DDoS that are calculated for all the vServices are also in the list. The list is filtered by name and by status. The selected category, the filters and the view settings are stored per user; when the session is opened again, the panel comes in the same state.
Route Tables
Scope
All the route tables including DEFAULT are listed
Up
Statuses
The status strip counts the network statuses
2
Filter Tabs
Name, Status
5s
Refresh
The default refresh interval; 10s, 30s and 60s are also selected
Accessing the Screen
- Left Monitor Panel is opened.
- Route Tables & L4 DDoS is selected from the category tabs at the top left.
- The route tables defined on TR7 are listed.
- The route table to be monitored is clicked; the screen opens with the Dashboard tab that carries the name of the route table.
If Route Tables & L4 DDoS is not seen in the category list, the user does not have the network authorization or the category has been removed with the Edit Tabs arrangement in the category list; a removed category is added again from the same arrangement.
The Route Tables & L4 DDoS Screen
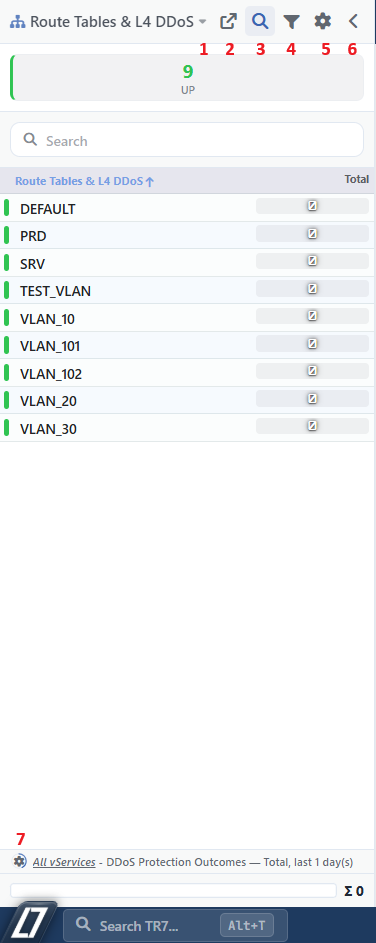 The Route Tables & L4 DDoS Screen
At the top part of the screen there are the category selector and the toolbar, below them the status strip, the search box and the route table list, and at the very bottom the metric information row and the total strip. In the image the table is displayed with the following columns:
| Column | Description |
|---|---|
| The status strip | The colored strip on the left of the row shows the status of the route table; the colors are the same as the colors in the status strip. When it is hovered over, the status name is displayed. |
| Route Tables & L4 DDoS | The name of the route table. Long names are shortened; when they are hovered over, the full name is displayed. |
| Total | The value of the selected metric. Since the metric in the image is All vServices - DDoS Protection Outcomes, the cell is a colored bar that shows the share of the outcome types; when there is no measurement the bar stays gray and writes 0. Since this metric is calculated for all the vServices and not by route table, the same value is displayed in every row. |
The metric column belongs to the selected Primary Metric value; when another metric is selected in the View Settings window, the columns of that metric come in place of the column. In single-valued metrics a number is displayed in the cell, and in the metrics that carry a large number of data sources a bar. When the value changes, an arrow of two seconds appears in the metric cell, and when the status changes, in the name cell; in the cells shown with a bar the arrow is not displayed.
By default the table is sorted by name from A to Z. The sorting is changed by clicking a column header: the first click on a column that is not sorted sorts the name and status strip columns from the smallest to the largest and the metric columns from the largest to the smallest; a second click on the same column reverses the order and a third click removes the sorting. In the table one navigates between the rows with the ↑ and ↓ keys; the selected row opens half a second later and the Enter key opens the row immediately. The ← and → keys pass to the previous or the next category.
When a row is clicked, the Dashboard tab that carries the name of the route table opens on the main screen; the Dashboard comes with the Display Period value in the panel.
The Category Selector
Which object group the panel will list is selected. When the label or the arrow next to it is clicked, the category list opens; the default order is Load Balancer vServices, WAF-Protected vServices, AGS-Enabled vServices, Bot/DDoS Protected vServices, Backend Services, Backend Service Groups, GTM, Interfaces and Route Tables & L4 DDoS. The categories for which the user has no authorization are not displayed in the list.
With the Edit Tabs button in the list, the categories are reordered by dragging, are added with Add Tab and are edited or deleted with the buttons on the right of the row. The changes are saved with the check mark; Discard changes undoes the changes made and Reset to Defaults returns to the default category list.
Route Tables & L4 DDoS List
By clicking the Route Tables & L4 DDoS list button, the Route Tables listing screen opens on the main screen.
Search
The Search button shows or hides the search box above the table. The search is made only in the name of the route table and the table is filtered as it is typed. The cross mark in the box clears the search; the Esc key or clicking the button again hides the box and clears the search. Whether the box is open or closed is stored per user; by default it is open.
Filter
By clicking the Filter button, the Filter window opens. While a filter is active, a dot appears on the button and the tooltip of the button writes how many route tables are shown in the form Showing X of Y.
View Settings
By clicking the Settings button, the View Settings window opens.
Collapse
The Collapse button collapses the panel. The collapsed panel turns into a narrow icon strip: every category is shown with an icon and the small status dots below it. When the icon is hovered over, the category name and the status distribution are displayed; when the icon is clicked, the panel expands again with that category. The width of the panel is changed by dragging its right edge and is stored per user.
The Metric Information Row
It shows the selected metric of the table, its calculation type and its period; in the image it writes All vServices - DDoS Protection Outcomes — Total, last 1 day(s). If the metric is bound to a parameter, the value of the parameter (in the image, All vServices) is displayed underlined in front of the metric name. By clicking the row, the View Settings window opens. While the data is loading, the settings icon in the row turns; the ring around the icon shows the time remaining until the next refresh.
The total strip below it gives the total of the rows that are visible in the table at that moment (with the filter and the search applied). In the metrics shown with a bar, the strip is displayed as a single bar that combines all the rows and, next to it, the total value (Σ); in the metrics that cannot be added up, such as a percentage or a ratio, the average (x̄) is shown instead of the total.
The Status Strip
The strip below the toolbar shows the number of the route tables in the list by status; there is a box for every status that has a route table at that moment. The boxes are counted according to the other filters; the search and the Status filter do not change the numbers, so all the statuses continue to be seen on the strip.
| Status | Color | Meaning |
|---|---|---|
| Up | Green | The route table is running in the system. |
| Absent in system | Red | The route table is not present in the system. |
| Host is down | Gray | The device has no connection with the network service; the status cannot be read. |
When a box is clicked, that status is added to the Status filter in the Filter window and the table shows only the route tables in that status; when it is clicked again, the status is removed from the filter. More than one box can be selected and the selected boxes are displayed highlighted. The strip is hidden with the Show status bar option in the View Settings window.
The Filter Window
In the window that opens by clicking the Filter button, the route tables in the table are filtered according to the values in the tabs.
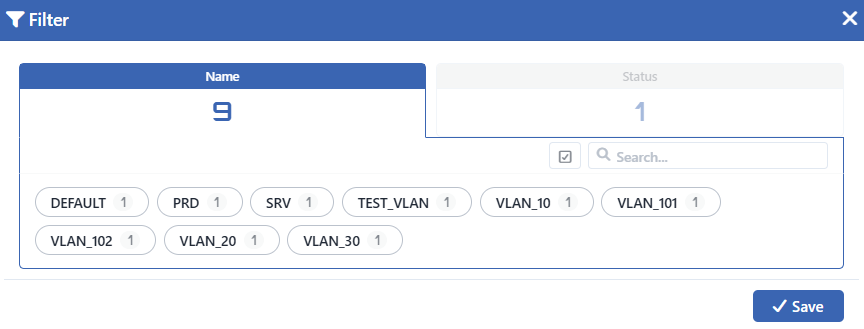 The Filter Window
In the header of every tab the number of values in that tab is written, and next to every value the number of route tables that have that value. When no value is selected in a tab, that tab does not filter the list. When more than one value is selected in a tab, the route tables that match any one of them are listed, and when a selection is made in different tabs, the route tables that match the condition of all the tabs are listed.
Tabs
INFO
Name Default: All
The names of the route tables are listed; the selected route tables are shown in the table.
INFO
Status Default: All
It is filtered by the status of the route table; the statuses in the list are listed as labels with the colors in the status strip. Clicking a box in the status strip also changes the selection in this tab.
Window Controls
INFO
Select All
The Select all button selects all the values displayed in the tab; while all the values are selected, the button becomes Deselect all and removes the selection.
INFO
Search
In the Name tab the values are filtered according to the text typed in the search box; Select all is applied only to the filtered values. In the other tabs there is no search box.
INFO
Save
By clicking the Save button, the selected filters are applied and stored per user. If the window is closed without the Save button being clicked, the selections made are not applied.
The View Settings Window
In the window that opens by clicking the Settings button or the metric information row, which metric the table will show, its sorting and its refresh period are set.
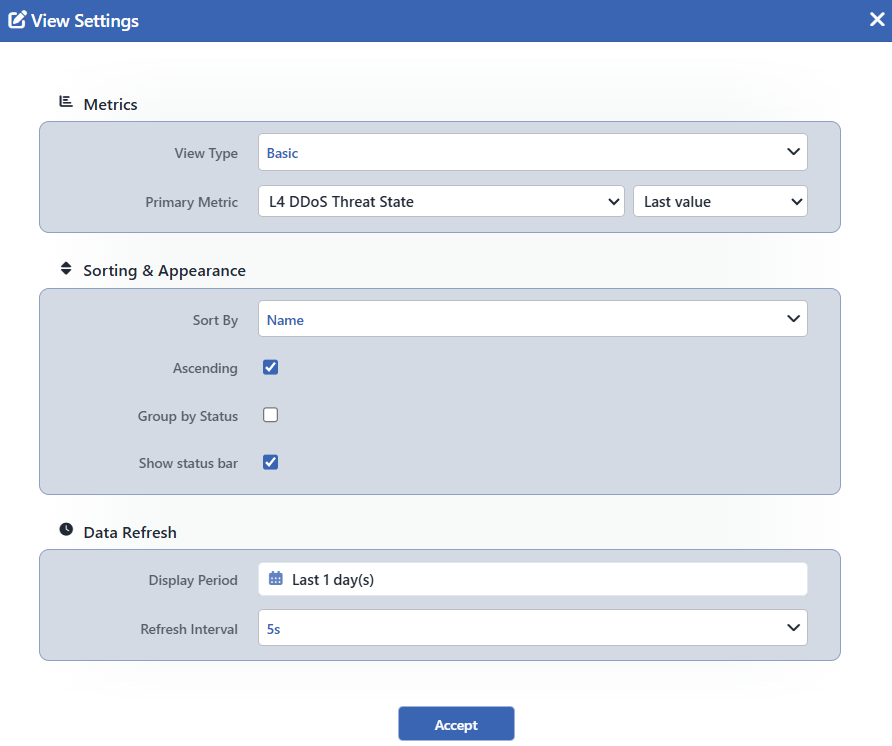 The View Settings Window
The settings are stored per category and per user; a setting made for Route Tables & L4 DDoS does not affect the other categories.
Metrics
INFO
View Type Default: Basic
The view of the list is selected:
- Basic: the route tables are listed as a table with the columns of the selected metric.
- Advanced: every route table is shown as a card; on the card there are at most five additional metrics together with the Primary Metric. In this view the Additional Metrics field in which the additional metrics are selected is added to the window.
INFO
Primary Metric
The metric to be shown in the table and the calculation type are selected. In the first box the following metrics are listed:
- the network metrics of the route table (e.g. Namespace Bandwidth, Namespace Packets, Network Namespace Errors),
- the L4 DDoS metrics of the route table (e.g. L4 DDoS Threat State); these metrics are the panels on the Dashboard screen of the route table,
- the All vServices - DDoS Protection Outcomes, DDoS Bandwidth Limiting and DDoS Trigger Attribution metrics of Bot/DDoS that are calculated for all the vServices; these metrics are not separated by route table.
In the Static group there is the Counts information: the number of interfaces (Interfaces) and IP addresses (IPs) bound to the route table.
There is no default metric defined in the category; the category opens with the first metric in the list and this selection is stored per user. In the setup in the image the first metric is All vServices - DDoS Protection Outcomes / Total (the main screen image). In the window image the setting is displayed changed to the L4 DDoS Threat State metric and to the Last value calculation type.
Sorting & Appearance
INFO
Sort By Default: Name
The sorting criterion of the table is selected: Default Order, Name, Status or one of the columns of the selected metric.
INFO
Ascending Default: Checked
While it is checked, the sorting is made from the smallest to the largest (from A to Z), and while it is not checked, from the largest to the smallest.
INFO
Group by Status Default: Not checked
When it is selected, the route tables are grouped by their statuses; the groups are arranged in the order Host is down, Absent in system and Up. At the beginning of every group the status name and the number of route tables are written; by clicking the group header, the group is opened or closed.
Data Refresh
INFO
Display Period Default: Last 1 day(s)
The period over which the metric value will be calculated is selected. The ready options are 1 minute, 5 minutes, 15 minutes, 30 minutes, 1 hour, 6 hours, 12 hours, 1 day, 1 week, 1 month, 3 months and 1 year; the period is also entered manually. The field is not displayed when no time-dependent metric is selected in the saved setting and in the window (e.g. when a metric is selected only from the Static group). The Dashboard that opens when a row is clicked comes with this period.
INFO
Refresh Interval Default: 5s
The refresh interval of the values in the table is selected: 5s, 10s, 30s, 60s.
INFO
Accept
By clicking the Accept button, the settings are saved and the table is refreshed with the new settings.
