
Smarter by Design.Simpler for Business
Debug Logs
What Are Debug Logs?
Debug Logs are the detailed diagnostic records that TR7 keeps for each HTTP request when a vService is put into the Debug Mode state. They record everything the standard HTTP log records and, on top of that, add a deep diagnostic layer that shows how the request is processed inside TR7.
They gather the entire path a request follows from the client to the Backend Service in a single record: the connection chain, millisecond-level timing, the request's termination reason, the number of retries made to the Backend Service, the TLS handshake, the sent and received headers, the request and response bodies, and the threat assessment. In this way, the answers to questions such as "why was this request slow, why did it return 502, why did TLS fail, which header was added?" are based not on guesswork but on the record itself.
This level of detail makes visible the problems that do not appear in ordinary logs: the retries an unstable Backend Service silently makes, a WAF action that intervenes, a faulty certificate chain or unexpected client behavior. Debug Logs work like a black box recorder that shortens troubleshooting time for a vService.
End to End
Client → Backend
The entire journey of a request is followed in a single record
Superset
Above the HTTP log
Every field of the standard log, plus deep diagnostics
ms
Millisecond timing
Breakdown of connection, queue and response times
Root Cause
Fast diagnosis
The source of slowness, 5xx and TLS errors
TLS
Certificate detail
Two-sided handshake and encryption information
Conditional
Targeted diagnostics
Only the traffic of interest with Conditions
Load Balancer
Part of the product
Enabled separately for every vService
Debug Logs are produced only while the vService is in the Debug Mode state; while it is off, they do not occupy system resources. When it is enabled, every detail of the traffic is recorded in a form ready for troubleshooting. Debug Logs are a part of the Load Balancer module and are enabled separately for every vService.
Supported vService Types
HTTP
L7 TCP
Network
How Are Debug Logs Enabled?
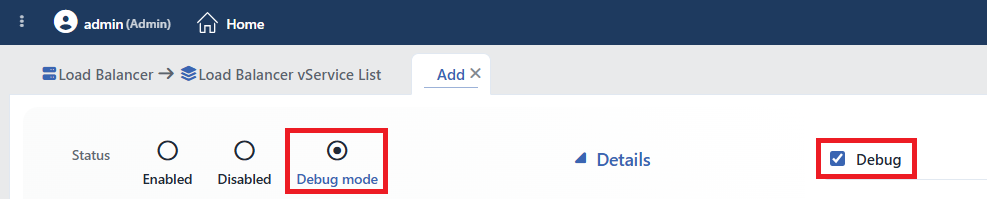
Debug Logs start being produced when the vService is put into the Debug Mode state from its Status field, or when the Details panel is opened in the vService form and the Debug box is set to Enable.
The Debug Mode option is off by default and appears only in the HTTP vService form.
 How Are Debug Logs Enabled?
1
Step 1 The vService edit form is opened
The edit form of the related HTTP vService is opened by following the Load Balancer → Load Balancer vService List path.
2
Step 2 Debug Mode is selected from the Status field
The Debug Mode option is selected in the Status field at the top of the form. Alternatively, the Details panel is opened in the vService form and the Debug box is checked.
3
Step 3 The change is saved
When the form is saved, the vService runs in the Debug Mode state and a Debug Log is created for each HTTP request.
How long records are kept
There is no adjustable retention period for Debug Logs; records are limited by a disk budget of 128 MB per vService. Files rotate by size, not by time: each engine thread keeps its own file pair; when a file reaches the limit allotted to it, it is handed over to its backup and the previous backup file is deleted entirely. For this reason, the viewable history varies between half and all of the budget.
Since Debug records are detailed, the size per row is also large; for this reason, the same budget covers a noticeably shorter time range compared to HTTP logs. Debug records are not forwarded to an external log server with a Logs profile; in cases that require permanent retention, only HTTP and TCP records are forwarded.
WARNING
Debug Mode is a diagnostic mode and keeps a detailed record for each request. This level of detail leads to additional CPU and memory usage; in vServices with heavy traffic, it can cause high resource consumption and a rapid increase in log volume. For this reason, Debug Mode should be enabled only for troubleshooting purposes and temporarily; when the examination is completed, turning off Debug Mode is recommended. Leaving it permanently on can negatively affect performance in production environments.
What Is Conditional Debug?
Conditional Debug allows Debug Mode to include in the Debug Log only the requests that match the specified conditions instead of all traffic. This narrowing is defined using the standard Conditions structure on TR7: they are the same conditions used in actions and other rule engines.
 Conditional Debug
When no condition is defined, Debug Mode produces a Debug Log for all HTTP requests coming to the vService. In environments with heavy traffic, this leads to a large number of records being created and the requests to be examined getting lost in the noise. With Conditional Debug, recording focuses only on the traffic of interest; log volume and system load decrease, and troubleshooting speeds up.
Examples of the criteria by which Debug recording can be limited:
- Source IP / IP range: only requests coming from a specific client or network.
- Host or URL path: only requests directed to a specific domain name or application path.
- HTTP method: only specific methods such as
GET,POST. - Country / geographic location: only requests coming from a specific country.
- HTTP header, cookie or query parameter: requests carrying a specific header, cookie or parameter value.
These conditions, used singly or combined with AND / OR logic, ensure that a Debug Log is kept only for requests that match the traffic pattern to be examined.
Custom Debug Log Entries
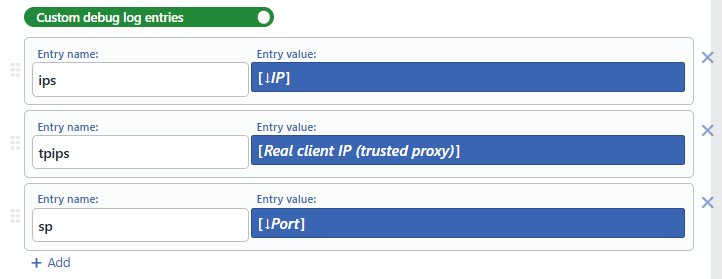
When the Custom Debug Log Entries switch below the Debug box is turned on, the fields defined by the administrator are also written to each record in addition to the ready-made fields carried by the Debug Log. The switch is off by default.
 Custom Debug Log Entries
Each row consists of two fields:
| Field | Description |
|---|---|
| Entry Name | The name under which this value will be kept in the record. It is required and must be filled in on every row. |
| Entry Value | The value to be written to the record. The field is a selection box that offers the Variables of the log stream; values resolved at runtime are selected, such as the client's address, its port, the real client address behind a trusted proxy, or a header or cookie value. |
A new row is added with Add. A newly added row automatically selects the first of the smart variables not used until that moment; in this way, rows added one after another do not repeat the same value.
The defined fields are kept in the record in a separate section from the ready-made fields; for this reason, even if an Entry Name carries the same name as a ready-made field, it does not replace it. The values are listed in a table titled Custom Entries in the Summary tab of the preview panel of the selected record. If there is no definition at all, or none of them produced a value, the table is not displayed.
Viewing Debug Logs
- Left Monitor Panel is opened.
- Load Balancer vServices is selected from the category tabs at the top left.
- The vServices defined on TR7 are listed.
- The vService to be monitored is clicked; the screen opens with the Dashboard tab that carries the vService's name.
- On the screen that opens, the Logs & Tracking tab is clicked and Debug Mode Logs is selected.
Debug Logs Listing Screen
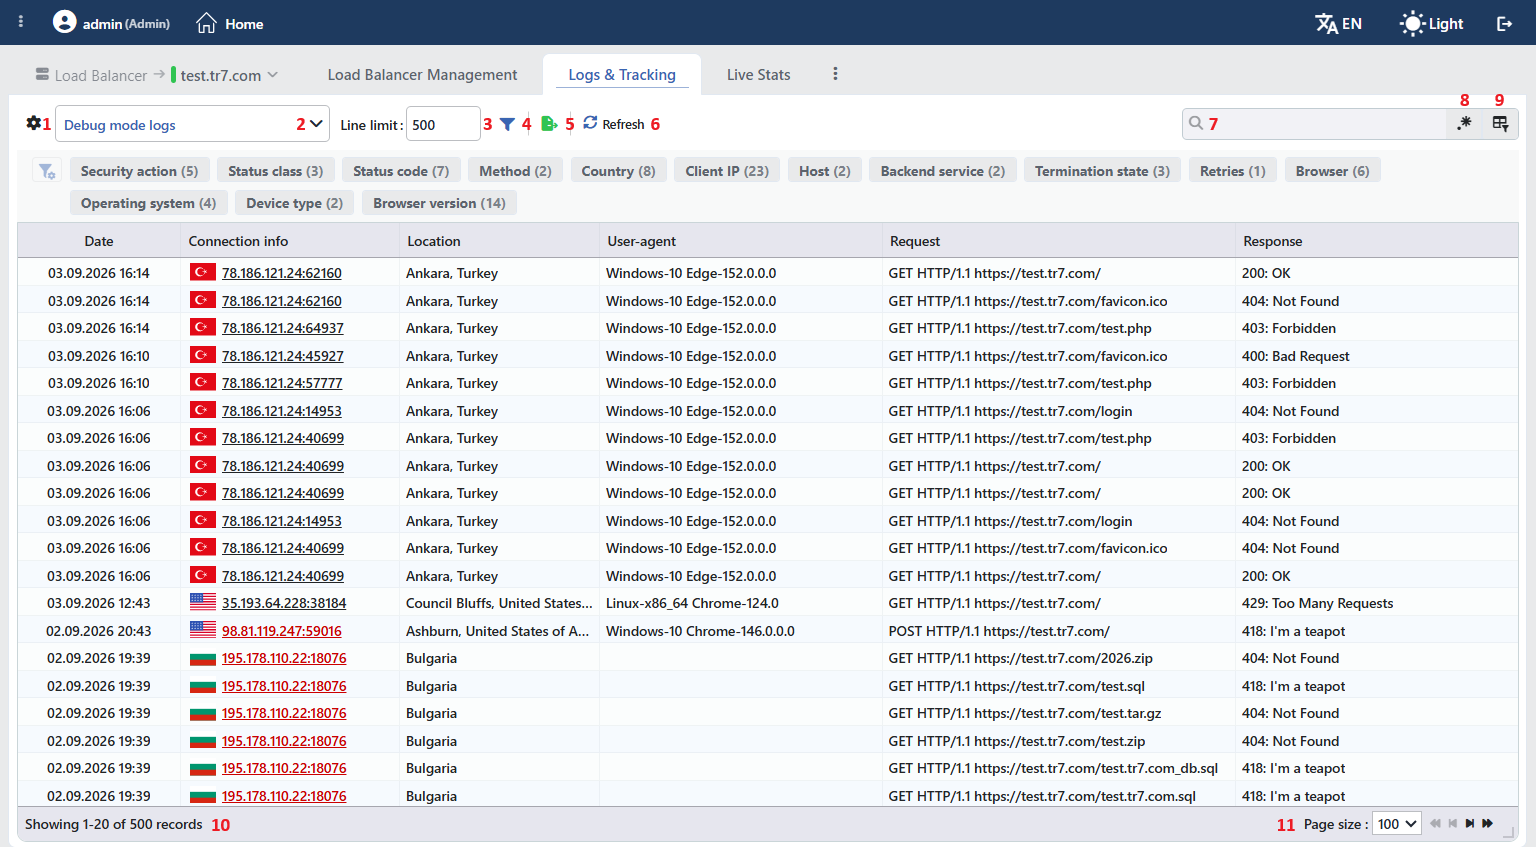
When the Debug Mode Logs source is selected in the Logs & Tracking tab, the diagnostic records are listed as a table. When the screen opens, the records are fetched automatically; when the log source is changed, the fetch is renewed. Filter chips narrow the fetched records and do not start a new fetch.
 Debug Logs Listing Screen
The table opens with the following columns by default:
| Column | Description |
|---|---|
| Date | The date and time the record was created. |
| Connection Info | The address information (IP:port) and country flag of the client that established the connection. The full connection chain is shown in the preview panel. |
| Location | The client's geographic location (city, country; e.g. Ankara, Turkey). |
| User-Agent | The client application that sent the request. It is written in the table in a shortened form (e.g. Windows-10 Edge-152.0.0.0); the full raw identification string is displayed in the cell's tooltip and in the preview panel. |
| Request | The request line; method, HTTP version and full URL. |
| Response | The response status; HTTP status code and its description. |
The following columns are hidden by default and are added from the column selector:
| Column | Description |
|---|---|
| Source | The name of the device that produced the record. Meaningful only in cluster setups. |
| Termination State | Status information indicating how the request ended. (Specific to Debug Mode) |
| Security Action | Which security module terminated the request, in the <module> · <decision> format (e.g. Threat Protection · Blocked). If both Bot/DDoS and WAF said something, the cell writes the module that actually ended the request; if both made a decision of the same weight, Bot/DDoS wins. The other's sentence is displayed in the cell's tooltip. If neither module produced an event, the cell stays -. The cell is colored according to the weight of the decision. (Specific to Debug Mode) |
Why Security Action is off by default
The Debug Log is enabled for many reasons, and most records contain no security decision; for this reason, the column is initially hidden. If a block is being traced, the column is turned on from the column selector.
For a security decision to be written to a record, the related module must also have produced its own event record: on the WAF side, requests without an attack ID (learning mode, whitelist, clean traffic), and on the Bot/DDoS side, requests that carry no action or monitoring stamp stay empty in this column. The signal band and whitelist exemption events of Bot/DDoS are also not written to this column; they are real events, but they have been left out of scope because they would fill all clean requests.
Termination State Values
Termination State summarizes how the request ended as a two-part sentence: first at which stage the request ended is written, then for which reason it ended, and the two are joined with · (e.g. During Request · TR7 Intercepted). If the request completed without problems, neither part is present and the value is written only as Normal. The raw two-character code produced by the engine is never shown in the interface.
Stage values:
| Stage | Meaning |
|---|---|
| During Request | Ended while the request was being read. |
| While Queued | Ended while the request was waiting in the Backend Service queue. |
| While Connecting to Backend | Ended while connecting to the Backend Service. |
| During Response Headers | Ended while the response headers were being received. |
| During Data Transfer | Ended while data transfer was in progress. |
| During Final Data | Ended while the last piece of data was being transferred. |
| While Tarpitted | Ended while the request was being deliberately delayed. |
Reason values:
| Reason | Meaning |
|---|---|
| Client Aborted | The connection was cut by the client. |
| Server Aborted/Refused | The connection was cut or refused by the Backend Service. |
| TR7 Intercepted | The request was caught by TR7 (an intervention took place). |
| Handled by TR7 | The request was answered directly by TR7. |
| Resource Exhausted | A resource limit was reached. |
| Internal Error | An internal error occurred during processing. |
| Server Down | The Backend Service was unreachable. |
| Server Shutdown | The Backend Service was shutting down. |
| Admin Killed | The connection was terminated by an administrator. |
| Client Timeout | A timeout occurred on the client side. |
| Server Timeout | A timeout occurred on the Backend Service side. |
The items in the toolbar are arranged from left to right in the following order; the last two items (Page Information and Page Size) are located in the information strip below the table.
Columns
Which columns are shown in the table is selected. In the same panel, columns are reordered by dragging and alignment is selected per column; the row height is fitted to the page with the Fit rows to the page button, and the column layout is reset to default with the Reset button. The layout is stored per user.
Logs Type
Determines the log source to be listed. Debug Mode Logs is selected to view Debug Logs. The selector is populated according to the vService's configuration and leaves out the WAF and Bot/DDoS sources.
Line Limit
Determines at most how many records are scanned from the source. It is displayed only in the Debug Mode Logs, HTTP Logs and WAF log sources; since the WAF source is not listed in this tab, in practice it is present in Debug and HTTP logs. An integer between 1 and 50000 is entered; the default value is 1000. The selection is stored per user and also applies to the other vService log screens opened by the same user.
Filter
The Filter button opens and closes the filter strip. While the panel is open, the values carried by the fetched records are listed above the table as chip groups; the number next to each chip is the number of records carrying that value. When a chip is selected, the table is narrowed to that value.
Filters that come open by default in Debug Mode:
| Filter | Description |
|---|---|
| Security Action | The security module that terminated the request and its decision. The record carries the decisions of both modules; for this reason, a WAF block is also found in records where the cell was taken by the Bot/DDoS action. (Specific to Debug Mode) |
| Status Class | HTTP response status class (2xx, 3xx, 4xx, 5xx). |
| Status Code | HTTP response status code (200, 404, 503, etc.). |
| Method | HTTP method (GET, POST, PUT, DELETE, etc.). |
| Country | The country the request came from. |
| IP Tags | The IP Tags that match the client address; untagged addresses are collected under the No Tags option. |
| Client IP | The IP address of the client that sent the request. |
| Host | The host (domain name) the request is directed to. |
| Backend Service | The Backend Service that answered the request. |
| Termination State | The termination state of the request. (Specific to Debug Mode) |
| Retries | How many times TR7 retried to establish a connection while forwarding the request to the Backend Service. 0 indicates that the connection was made on the first attempt (healthy state); values greater than zero point to Backend Service connection problems such as connection refusal, timeout or the server being temporarily unreachable. (Specific to Debug Mode) |
| Browser | The client browser. |
| Operating System | The client operating system. |
| Device Type | The client device type (desktop, mobile, tablet, etc.). |
| Browser Version | The client browser version. |
The following filters are hidden by default and are added from the filter manager:
| Filter | Description |
|---|---|
| Response Source | The source of the response. It comes hidden in Debug Mode because the table already carries the answering Backend Service in a separate filter. |
| Backend Group | The Backend Group the request was distributed to. |
| TLS Version | The TLS version of the connection. Connections that do not use TLS are grouped as Plain HTTP. |
| HTTP Version | The HTTP version of the request (HTTP/1.1, HTTP/2, etc.). |
| Path | The request path (URL path). |
| X-Forwarded-For | The client IP address carried in the X-Forwarded-For header. The value is read from the request headers stored in the record; for this reason, it is present only in Debug Mode. (Specific to Debug Mode) |
Which filters are shown, their order and their appearance can be arranged as needed.
Export
The table is exported as Excel, CSV or PDF by clicking the Export button. In the window that opens, the Filename, Format and Data Source, together with the Columns to be exported, are determined; the remaining fields are displayed according to the format: CSV Separator for CSV, Excel Sheet Name for Excel, and Page Orientation and Page Size for PDF.
Refresh
The records are fetched again by clicking the Refresh button. When the screen opens and when the log source is changed, the fetch is done automatically; when the Line Limit value is changed, however, this button must be clicked for the new value to be applied. While fetching is in progress, the button stays inactive and shows a spinning icon.
Search
Used to search all information in the table.
RegExp Search
Used to search all information in the table with a regular expression (RegExp).
Column Based Search
Used to perform a column-based search on the information in the table.
Page Information
Contains information about the total number of fetched records and the range of records displayed in the list: Showing N-M of T records. Since rows cannot be selected in this source, the number of selected rows is not shown.
Page Size
The maximum number of records to be displayed on the page is selected. The default is 100; the options are 50, 100, 250 and All. The selection is not stored.
Preview of the Selected Log
When any record in the list is clicked, a detailed preview panel of that request opens on the right side of the screen. The panel consists of three tabs: Summary, Request (request side) and Response (response side).
Summary Tab
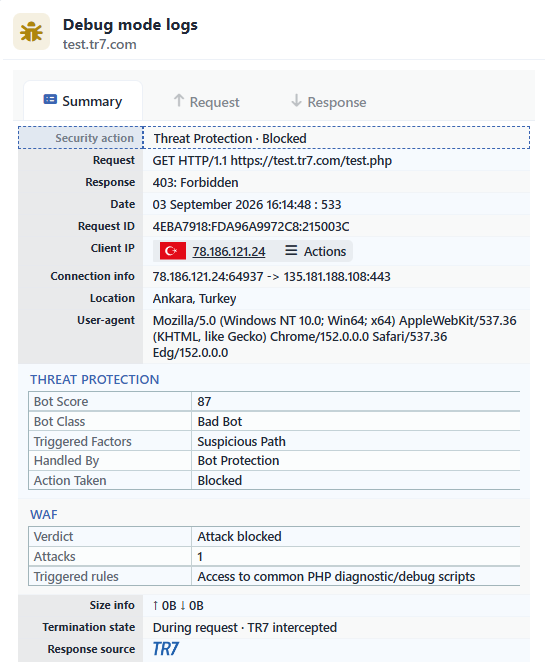
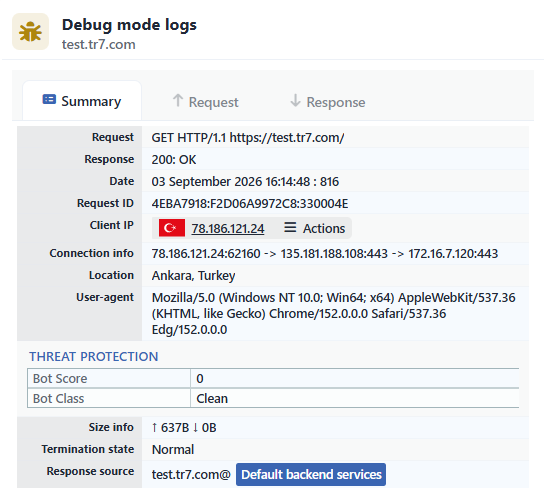
Gathers the summary information of the request and the response in a single list. Rows without information are not displayed at all; for this reason, the length of the panel varies from record to record.
 Preview: Summary (blocked request)
| Information | Description |
|---|---|
| Security Action | Which module terminated the request. It is displayed in a framed row at the very top of the panel. It is present only if at least one of the security modules produced an event for this request. |
| Request | The summary of the request; method, HTTP version and full URL including the query string. |
| Response | The HTTP status of the response (e.g. 403: Forbidden). |
| Date | The date and time the request was processed (with millisecond information). |
| Request ID | The unique identifier assigned to the request. Used to match the same request across different records. |
| Client IP | The IP address and country flag of the client that sent the request. Quick operations for this address are performed from the Actions menu next to it. |
| Connection Info | The connection chain; source/destination IP and port information. CLIENT IP→TR7 vService IP→Backend Service IP:PortIf the request never reached the Backend Service, the chain ends at TR7. |
| Location | The client's geographic location (city, country). |
| User-Agent | The client application / browser information that sent the request. |
| Threat Protection | The assessment produced for this request by the Bot/DDoS Protection module. Its sub-rows: Bot Score, Bot Class, Triggered Factors, IP Reputation Category, Handled By (the protection that made the decision), Action Taken (the action applied) and, in monitor mode, Monitor Mode. Only rows that produce a value are written; if there are none, the box is not displayed. |
| WAF | The assessment produced for this request by the WAF module: Verdict, Attacks (number of attacks) and Triggered Rules (names of the triggered rules). If WAF did not write an event for this request, the box is not displayed. |
| Custom Entries | The fields defined with Custom Debug Log Entries and the values they took at runtime. If there is no definition, the box is not displayed. |
| Size Info | The transferred data size; the amount of data received from the client (↑) and sent to the client (↓). |
| Termination State | The termination state of the request (e.g. During Request · TR7 Intercepted). |
| Timing Info | The processing times of the request; given in a single-row table with the Ta, R, W, w, cr and d columns. When the d value is zero, <1ms is written in the cell. |
| Response Source | The source that produced the response; the Backend Service that answered the request and the group it belongs to, or TR7 directly. |
The image below belongs to a clean request for which no security module produced a decision: the Security Action row and the WAF box are not present, the Threat Protection box carries only the score and class rows, and the connection chain extends to the Backend Service.
 Preview: Summary (clean request)
Request Tab
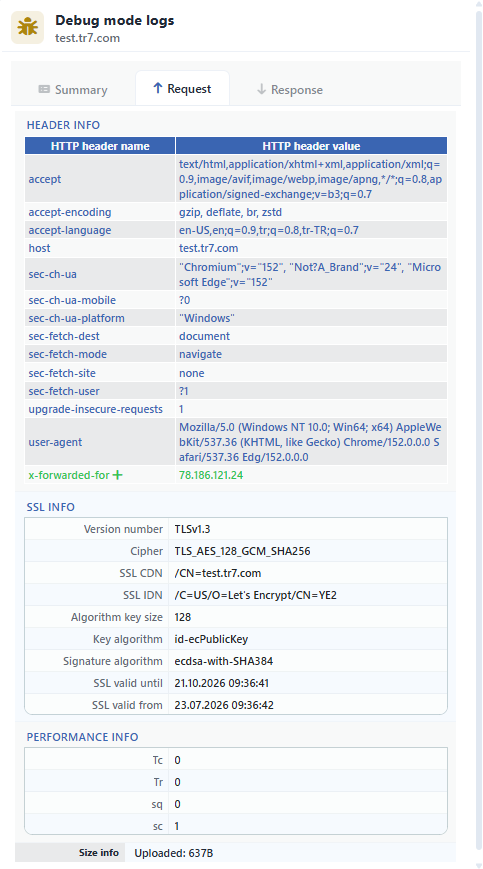
Shows the details of the request (client → TR7 direction).
 Preview: Request
| Information | Description |
|---|---|
| Header Info | The name/value list of the request HTTP headers. Headers added by TR7 are shown in green with a plus sign, deleted headers in red with a trash can sign, and modified headers in yellow with a right arrow sign. In the value cell of a modified header, the old value is written faded and the new value prominent, both together. |
| Body Content | The request body. The section is added only when the request carries a body (e.g. POST, PUT); at most 16 KB of the body is captured. The body text comes closed at first and is opened by clicking the eye icon in the title. |
| SSL Info | The details of the TLS connection between the client and TR7: Version Number, Cipher, SSL CDN, SSL IDN, Algorithm Key Size, Key Algorithm, Signature Algorithm and the certificate validity dates (SSL Valid From / Until). If the connection does not carry TLS, the section is not displayed. |
| Performance Info | Low-level timing and connection counters belonging to the request side (Tc, Tr, sq, sc). Duration values are in milliseconds (ms) and are printed in the cells without a unit. |
| Size Info | Uploaded: the amount of data received from the client. |
| Cookie Info | The name/value list of the cookies that came with the request. If the request does not carry cookies, it is not displayed. |
Response Tab
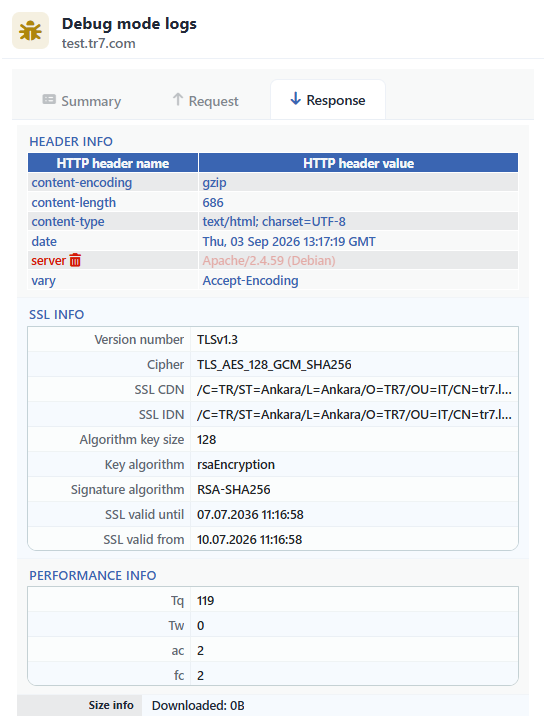
Shows the details of the response (TR7 → client direction).
 Preview: Response
| Information | Description |
|---|---|
| Header Info | The name/value list of the response HTTP headers. The color and sign codes and the old/new value display of a modified header are the same as for request headers (added, deleted, modified). |
| Body Content | The response body. The section is added only when the response carries a body; at most 16 KB of the body is captured. The body text comes closed at first and is opened by clicking the eye icon in the title. |
| SSL Info | When the connection to the Backend Service is made over TLS, the certificate details of the TLS connection between TR7 and the Backend Service are shown here. If the Backend Service does not use TLS, it is not present. |
| Performance Info | Timing and connection counters belonging to the response side (Tq, Tw, ac, fc). Duration values are in milliseconds (ms) and are printed in the cells without a unit. |
| Size Info | Downloaded: the amount of data sent to the client. |
