
Smarter by Design.Simpler for Business
L4 DDoS Live View
What Is L4 DDoS Live View?
L4 DDoS Live View shows what the protection is doing right now: it gathers on a single screen which rules are under pressure, how many sources are in quarantine at that moment and how the open connections of the device are distributed.
This is a different question from the neighboring tabs. Dashboard draws the history and answers the question "what happened"; L4 DDoS Management shows the configuration and answers the question "what is set"; Quarantine History keeps the persistent record of the sources that entered quarantine and answers the question "who was quarantined". This screen, on the other hand, shows only the present and is the only action surface: a source taken into quarantine is released from here, added to the exemption list or the quarantine list of a rule is emptied completely.
The screen refreshes itself every ten seconds. The refresh is not a stream but a regular query: in every round the state at that moment is read again and, by comparing it with the previous round, the newly arrived sources are marked.
10 s
Refresh Interval
It is fixed; it cannot be changed from the interface, it is only turned on and off
24
Rules Watched
The rules that produce measurements are distributed into four family cards
5
Table Columns
Six with the source device column in a cluster setup
3
Row Operations
Adding to the exemption, removing a single source and emptying a rule
2500
Rows per Device
Above it is trimmed; the counter continues to write the real total
Quarantine Only
The Mode That Fills the Table
The rules in the Block mode write no row to this table at all
An empty table does not mean "there is no attack"
The table reads only the lists the rules in the Quarantine mode keep. Even if all the rules in a route table are in the Block mode and continue to drop the attack, the table stays permanently empty; in that case what shows that the protection is working are the counter badges and the family cards.
In addition there are rules that can send no source to quarantine at all: Blacklist, the private address range rule, the dead connection cleanup, the TCP reset limit and the ICMP permission. Whatever mode they are in, these write no row to the table.
The quarantine membership falls by itself when the quarantine duration of the route table expires. The sources of an attack that ended ten minutes ago are no longer on the list.
Access to L4 DDoS Live View
- Left Monitor Panel is opened.
- Route Tables & L4 DDoS is selected from the category tabs at the top left.
- The route tables defined on TR7 are listed.
- The route table to be monitored is clicked; the screen opens with the Dashboard tab that carries the name of the route table.
- On the screen that opens, the L4 DDoS Live View tab is clicked.
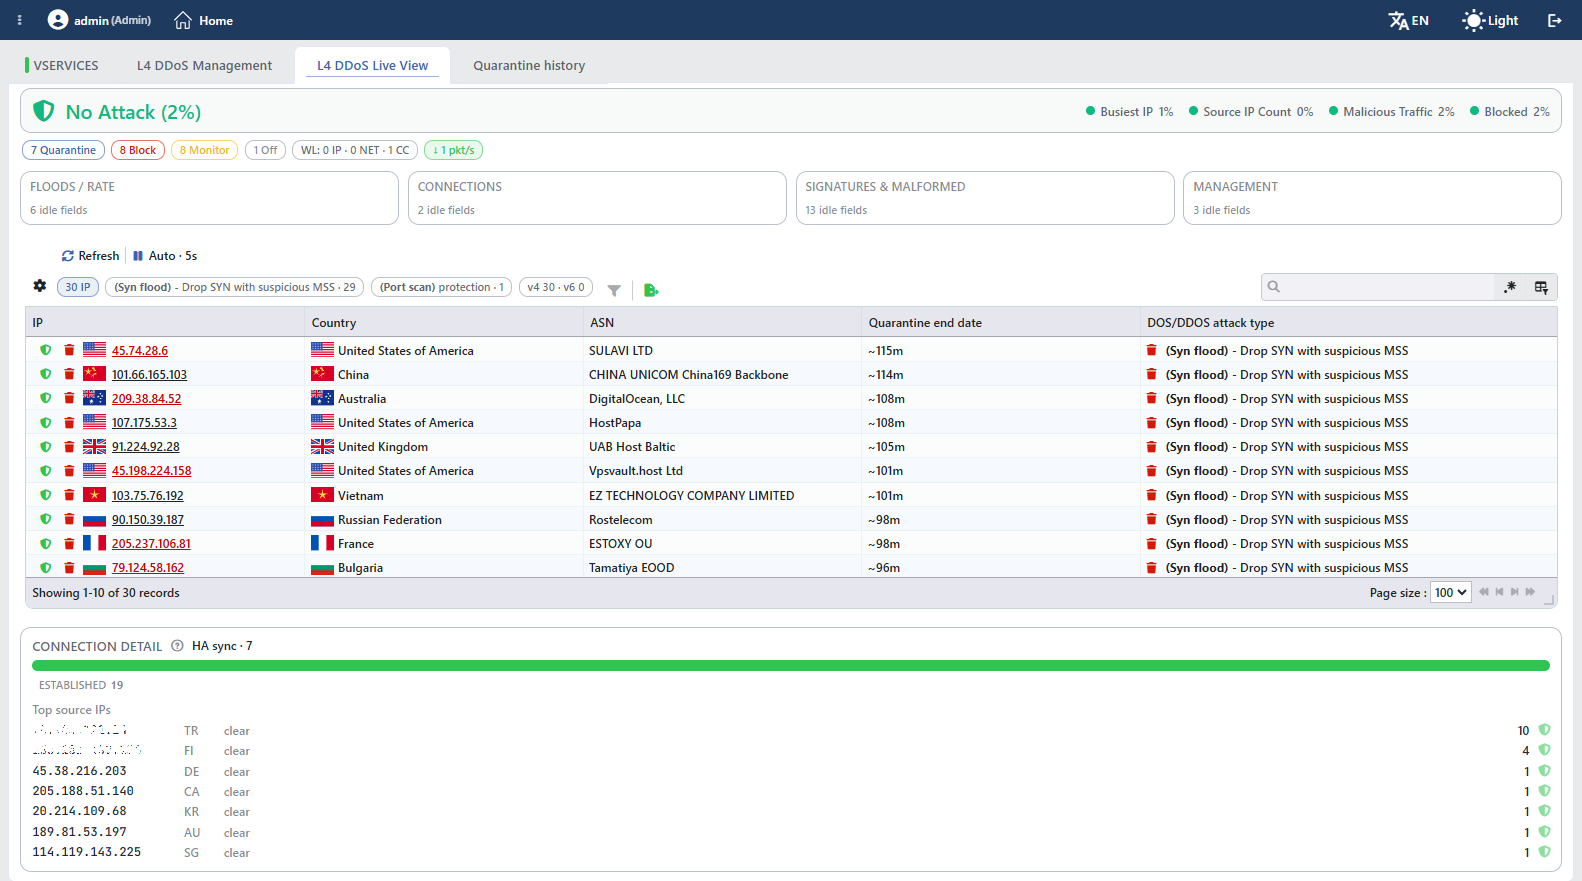 L4 DDoS Live View
The screen consists of five layers from top to bottom: the threat strip, the counter badges, the family cards, the quarantine table and the connection detail panel.
The Threat Strip
On the left of the strip there are the shield icon, the threat status of the route table and the general pressure percentage in parentheses. The status is one of five bands:
| Band | What it tells |
|---|---|
| No Attack | The measurements are in the ordinary range. |
| Low Activity | There is a rise, it is not meaningful yet. |
| Possible Attack | Even a single axis has risen meaningfully; this band is the ceiling of a rise with a single witness. |
| Attack Detected | At least two axes are witnessing at the same time. |
| Active Attack | The highest band; both axes have leaned on the upper bound. |
On the right of the strip there are at most four axis badges and each of them carries its own percentage. An axis whose value is zero is also displayed as 0%; an axis is hidden only when all the rules that feed it are off or cannot be read, that is, when its value cannot be calculated at all:
| Axis | What it measures |
|---|---|
| Busiest IP | The fullness of the single busiest source according to the limit of its own rule. |
| Source IP Count | The breadth of the sources that exceed the limit among the sources that enter the measurement. While the number of sources that enter the measurement is less than twenty, its value reads 0%. |
| Malicious Traffic | The rate per second of the traffic counted as malicious. |
| Blocked | The magnitude of the reaction the protection gives. |
The fifth axis is not found on this screen
The threat calculation uses a taxonomy common with the L7 side and there is one more axis there named Load. Since no counter is produced for this axis on the L4 side, it is never displayed on the strip.
The percentage read is the average of three pressure axes: Busiest IP, Source IP Count and Malicious Traffic. The Blocked axis does not enter the average; it only pulls the percentage up to a certain ceiling.
The strip and the table are fed from different sources
The threat strip is refreshed in the same round as the table and the cards, but it does not take its values from the same query as they do: it reads from the monitoring records written every five seconds. For this reason the value on the strip can be up to five seconds behind.
If the record has not been refreshed for longer than a minute, the strip fades to state that the data has gone stale. If no record is found at all, the strip is not displayed at all. In a cluster setup the higher of the values of the two devices is shown.
When the general pressure reaches fifty percent, the Check smart advisor → shortcut is added to the strip and takes the screen to the L4 DDoS Management tab.
The Counter Badges
The row below the strip summarizes the current stance of the route table. The badges are informational; they cannot be clicked and carry no detail tooltip.
| Badge | What it counts | When it is not seen |
|---|---|---|
N Quarantine | The number of rules in the quarantine mode. | While the number is zero. |
N Block | The number of rules in the blocking mode. | While the number is zero. |
N Monitor | The number of rules in the monitoring mode. | While the number is zero. |
N Off | The number of rules that are off. | While the number is zero. |
WL: N IP · N NET · N CC | The breakdown of the entries in the exemption list by type: single address, network block and country. | When the rule list cannot be read at all; in that case the whole badge row is not displayed. |
peers on (N) | The number of derived peer servers. | While the trust in one's own servers setting is off. |
↓ N pkt/s | The total per second of the packets all the rules drop. | While the value is not known yet, for example in the first round. |
The sum of the four mode badges is always 24
The badges do not separate the enforcement levels one by one either: the permission and the on/off settings that are on are counted in the Block column. In addition the badges count not the whole of the rule catalog but the rules that produce measurements. Eight of the fields in the catalog produce no telemetry and do not enter this number: the quarantine duration, the quarantine log forwarding, the exemption list, the trust in one's own servers, the SYN cookie setting, the source routing setting and the two quarantine fields that have been withdrawn from use.
The Family Cards
Below the badges there are four cards and the 24 rules watched are distributed into these cards. At the end of the card body, the number of rules in that family in which no pressure is seen at that moment is written in the form N idle fields.
| Card | How many rules | Which rules |
|---|---|---|
| Floods / Rate | 6 | The rules that measure the rate per second per source: the TCP handshake flood, the UDP flood, the DNS flood, the ICMP echo query rate, the reflected amplification and the SMB attack. |
| Connections | 2 | The rules that measure concurrency: the number of open connections per source and the dead connection cleanup. |
| Signatures & Malformed | 13 | The rules that look at the packet form and at the reputation data. |
| Management | 3 | The ceilings of the connections opened to the management ports of the device itself. |
When is a rule counted as idle?
The measure of being counted as idle is the pressure, not the existence of traffic. The pressure is the ratio of the measured value to the limit of the rule; in the rules that carry no limit an approximate value over the rate is used.
A rule is listed as idle when its pressure does not exceed two percent of its limit. Even if pressure is seen, the rules that are off stay idle; the only exception to this is the two rules watched independently of the mode: the ICMP permission and the TCP reset limit.
When the idle row of the card is hovered over, the names of the idle rules in that family are listed.
If a rule is not idle, it is displayed with its own row in the card body. In the row there are the name of the rule, the mode badge and the measured value; in the rules that have a limit, a proportional bar showing the pressure and the number of sources are displayed as well. The color of the bar is the same as the color of the threat bands. The rows are ordered from the largest to the smallest according to the pressure.
The Management card is displayed in every route table
The card counts three rules that are meaningful only in the DEFAULT route table of the main device. On the other hand the card itself is displayed in all the route tables and writes 3 idle fields in those tables as well.
These three rules enter the number of the mode badges as well. In another route table these rules do no work and cannot send a source to quarantine.
Screen Controls
Below the cards there are two controls; in a cluster setup a source device selector is added to them and the change of the selection makes a full refresh.
| Control | What it does |
|---|---|
| Refresh | It brings the whole screen again; it is one of the operations that refresh the connection detail panel. |
Auto · <N>s | It turns the automatic refresh on and off. The number in the label is the seconds remaining until the next refresh and decreases every second (Auto · 5s in the image). While it is off it writes Auto off. |
The automatic refresh has a fixed interval and stops when the tab is hidden
The interval is 10 seconds and cannot be changed from the interface. When the browser tab is taken to the background the refresh stops and the control reads Auto · idle; half a second after returning to the tab a new round starts.
If the answer of a round takes longer than half of the interval, the next round is skipped; thus the requests do not overlap on a slow device.
When the screen is left and returned to, the automatic refresh always starts on; its having been turned off is not stored.
On the device side there is a short cache of two and a half seconds: a Refresh used repeatedly can return the same reading.
The connection detail panel is not refreshed automatically
The automatic rounds bring only the threat strip, the cards and the table. The connection detail panel at the bottom of the screen is refreshed only when Refresh is used, when the route table is changed or when the cluster source is changed; in between it shows its old values.
The question mark in the title of the panel is a tooltip stating this behavior, not a clickable element.
The Quarantine Table
The table lists the sources that are in quarantine at that moment.
The table opens with the following columns by default:
| Column | Description |
|---|---|
IP | The address of the source; together with the country flag in the addresses whose country can be resolved. The address is clickable; next to an address that matches an IP Tag the icon is displayed. |
Country | The resolved country of the address. The addresses in the private network ranges are marked as a local network. |
ASN | The name of the operator the address belongs to. Although the column title implies the number, the number is not displayed; if it is not known, a dash is displayed. |
Quarantine end date | The time remaining until the quarantine ends, not the date. It is written in the form ~45s below two minutes, ~116m below two hours, ~3h below forty-eight hours and ~2d above it; in a row whose time has passed 0s is read without the tilde. When it is hovered over, the real end time is displayed. In the records that have no duration a dash is displayed. |
DOS/DDOS attack type | The name of the rule that sent the source to quarantine. |
In a cluster setup the Source column showing the name of the device reporting the record is added to the beginning of the table; outside a cluster setup this column is not found.
The remaining time advances only with a refresh
The time is calculated not from the clock of the browser but from the server time of the last round. For this reason, while the automatic refresh is off, the number stays in place and decreases only when a new round arrives.
The Status Chips
The chips are informational as well and cannot be clicked.
| Chip | What it shows |
|---|---|
N IP | The total number of sources in quarantine. It counts all the rules, the two IP versions and, in a cluster, the two devices together; in the tooltip there is a breakdown per rule. |
<rule name> · N | The four rules with the highest number of members and the number of members of each. |
+N | The number of rules that do not fit on the list; in the tooltip there is the full breakdown. |
v4 N · v6 N | The distribution of the members according to the IP version. |
<device> N · <device> N | The distribution of the members according to the devices in a cluster. |
+N new | The number of sources newly arrived compared to the previous round. |
⚠ N known IPs in quarantine | How many of the sources known to belong to one's own infrastructure have fallen into quarantine. It is a false positive warning. |
showing first N of M | It states that the list has been trimmed. |
Peer device unreachable | It states that no answer could be taken from the peer device in the cluster. |
The newly arrived and the false positive rows are marked in the table as well
The row of the sources newly arrived compared to the previous round turns green, and the row of the sources known to belong to one's own infrastructure turns red. If both are valid, red takes precedence.
Separately from the row color, the text color of the address in the IP column shows the IP reputation status of the address: an address on the IP Intelligence & Reputation blacklist is written in red, an address on another blacklist in orange, and an address on a whitelist in green. If none of these states applies, a tagged address is written in the tag color and an untagged address in the default color.
The newly arrived mark is not displayed in the first round, in the first round after the route table or the cluster source is changed and in the case in which the previous list was empty; because there is no previous list to compare with.
The items on the toolbar are located from left to right in the order below; the status chips are informational and have been explained above, and the last two items (Page Information and Page Size) are in the information strip below the table.
Columns
Which columns will be shown in the table is selected. In the same panel the columns are reordered by dragging and the alignment is selected per column; with the Fit rows to the page button the row height is fitted to the page, and with the Reset button the column layout is taken back to the default. The layout is stored in the user account.
Filter
The Filter button is used to filter the table. It offers multiple selection under four headings: Rule, Country (a search is made inside the card), IP Tags (with the No Tags option for untagged addresses) and IP Version; in a cluster setup Device is added to them. The panel starts closed and the number of selected filters is displayed as a badge on the button. The selections are not stored: when the screen is left and returned to, the filter opens empty. Only the order and the layout of the headings are stored in the user account.
Export
By clicking the Export button, the table is exported as Excel, CSV or PDF. In the window that opens, Filename, Format and Data Source together with the Columns to be exported are determined; the remaining fields are displayed according to the format: CSV Separator in CSV, Excel Sheet Name in Excel, Page Orientation and Page Size in PDF. The column list consists by default of the columns visible at that moment, and the data source of the filtered and sorted data.
Search
Used to search across all information in the table. The search text is not stored.
RegExp Search
Used to search all information in the table with a regular expression (RegExp).
Column Based Search
Used to perform a column-based search on the information in the table.
Page Information
The displayed record range and the total number of records are located here: Showing N-M of T records. Since the table is scrollable, the range shows the rows standing on the screen at that moment. Since the rows cannot be selected, the number of selected rows is not shown.
Page Size
The maximum number of records to be displayed on the page is selected. The default is 100; the options are 20, 50 and 100. There is no option that shows all of them on a single page.
What does the table write while it is empty?
If there is no source in quarantine, No records to show is read in the table body. When the expression entered in the search box matches no row, on the other hand, the text No results for the search query is displayed.
The number on the left is not the page but the range of visible rows
Since the table is scrollable, the range on the left shows the rows standing on the screen at that moment. While the page size is 100, it is ordinary to read Showing 1-10 of 15 records in a list of 15 records: all of the records are on the first page, and ten of them are on the screen at that moment.
2500 rows are brought per device
The list is ordered starting from the one whose remaining time is the longest and is trimmed at 2500 rows per device. The same limit is applied to every quarantine list as well, that is, per rule and IP version. Since the lists coming from the two devices in a cluster are merged, the upper bound is 5000 rows.
When trimming occurs, the total counter continues to write the real number and a chip stating the trimming is displayed on the chip row of the table.
When a rule is taken out of the quarantine mode its rows fall off the list
The quarantine members are kept on the device independently of the mode of the rule and stay there until their own durations expire. When the rule is taken out of the quarantine mode, the screen stops reading that list: the sources disappear from the table but do not continue to be blocked, they stay in the record until their durations expire. If the rule is taken into the quarantine mode again, the same sources are seen on the list again.
The way to really empty the list of a rule is to use the trash can in the attack type cell while the rule is still in the quarantine mode. After the rule leaves the mode, since its rows are not listed, there is no icon left to click either.
The Row Operations
In the address cell there are two icons and in the attack type cell one icon.
| Icon | Where | What it does |
|---|---|---|
| The address cell | It adds the source to the exemption list and takes it out of quarantine. If the address has been entered into the exemption list one by one, the icon is inactive; in the addresses within the scope of an exempt network or country it stays active. | |
| The address cell | It takes only that source out of quarantine. In a cluster it works only on the device reporting the row. | |
| The attack type cell | It empties the quarantine list of that rule completely. |
All three operations are applied without opening a confirmation window
The texts on the icons are tooltips, not confirmation texts. The moment they are clicked the operation is sent and it cannot be undone.
The difference in scope requires attention as well. Removing a single source works only on the device reporting the row; if a source is in quarantine on both devices in a cluster, it has to be clicked in both rows. Emptying a rule, on the other hand, behaves according to the selected source and, since the default selection in a cluster setup is both devices, it empties both of them with a single click. The emptying covers both IP versions.
The removal from quarantine and the emptying of the list of a rule are written to User Logs; the adding to the exemption itself is not written, only the removal from quarantine half is recorded.
Adding to the exemption preserves the other L4 DDoS settings
While the shield icon writes the exemption list, it sends the whole L4 DDoS record of the route table together with its current values. The modes, the limits, the quarantine duration, the quarantine log forwarding, the learning settings and the learning locks per rule stay as they are; only a new entry is added to the exemption list.
Since the write enters the cluster synchronization, the exemption entry is carried to the peer device as well. The taking out of quarantine half of the operation, on the other hand, works only on the device reporting the row.
The note, the type and the full list of the exemption entries are edited from the Whitelist & Known Peers window.
When the address is clicked, the IP information window of the source opens. When half a second is waited over the address, the same view opens as a tooltip; in the tooltip the reports and the buttons are hidden.
Connection Detail
The panel at the very bottom of the screen shows the instantaneous distribution of the open TCP connections in the route table. In the title of the panel there are the panel name, the explanation tooltip and the HA sync chip; below it there are three parts: the status bar, the status list and the busiest sources.
The status bar draws with a proportional strip which TCP state the connections are in; a slice of at least one and a half percent is reserved for the states whose share is very small so that they stay visible. In the list below the bar the state name and its number are written; at most five states are named on the list, the rest keep their place on the bar and are displayed with their name when they are hovered over. If a state that is not in the table below comes out, it is drawn in a neutral color.
| State | Its color | What it tells |
|---|---|---|
| ESTABLISHED | Green | The established and working connections. |
| SYN_SENT · SYN_RECV | Red | The connections whose handshake has not been completed. The number rising points to a handshake flood. |
| FIN_WAIT1 · FIN_WAIT2 · CLOSE_WAIT · LAST_ACK · CLOSING | Amber | The connections in the closing stage. Their accumulation points to a dead connection problem. |
| TIME_WAIT | Dim | The connections that have closed but have not fallen out of the table yet. |
The Top source IPs list orders the sources that hold the most connections and shows at most eight rows. In every row there are the address of the source, the country code, the status chip and the number of connections; to the rows that are not in the exemption list a shield icon is added as well.
| Status chip | What it tells |
|---|---|
| quarantined | The source is in quarantine at that moment. |
| WL | The address of the source has been entered into the exemption list one by one. The addresses within the scope of an exempt network or country do not take this chip. |
| peer | The source is one of the derived peer servers. |
| clear | None of the above. |
If a source fits more than one definition, the order above is valid: quarantine, exemption, peer server, clear.
The shield icon of the panel does not take out of quarantine
In every row that is not in the exemption list there is a shield icon and it adds the source to the exemption list. Although the tooltip of the icon carries the same text as the one in the table, this operation does not touch the quarantine list: the source stays on the list until its duration expires. On the other hand, since the blocking rule leaves out the ones in the exemption list, the moment the source enters the exemption its blocking effectively stops.
This icon uses the same writing path as the shield in the table: only an entry is added to the exemption list, and the other L4 DDoS settings are preserved.
The panel lists only the IPv4 sources
The status bar counts the connections in both IP versions, but the Top source IPs list and the counter in the title add up only the IPv4 addresses. The connections coming over IPv6 are seen on the bar, not on the list. The connections established with the loopback and the in-device addresses are left out of all the lists.
The HA sync chip in the title gives the number of different IPv4 addresses that have an established connection at that moment. The chip is displayed only while the number is greater than zero and when it is hovered over the ten busiest addresses are listed with their numbers. The counter counts at most 25 addresses per device; since the lists of the two devices are merged in a cluster setup, this number can go up to fifty. The cluster synchronization traffic is not kept outside this counting; only the loopback and the in-device addresses are filtered out.
If there is no data yet on the panel, the text Updates on manual refresh is displayed in the body. This text states that the panel is not updated in the automatic rounds: the panel is refreshed when the screen is opened, with the Refresh button and when the route table or the cluster source changes.
Scope and Limits
INFO
- The screen is only a monitoring and intervention surface; the mode and the limits of the rules are not changed from here, they are adjusted from the L4 DDoS Management tab.
- Only the rules in the Quarantine mode fill the table; an empty table does not mean that there is no attack.
- The automatic refresh is every 10 seconds, cannot be changed from the interface and starts on at every visit.
- The connection detail panel is refreshed only with a manual refresh.
- None of the three row operations asks for confirmation. The removal from quarantine and the emptying of the list are written to User Logs.
- The adding to the exemption shortcut preserves the other L4 DDoS settings; it only adds an entry to the exemption list.
- Removing a single source works on a single device, and emptying a rule on all the devices in the selected source and the emptying covers both IP versions at once.
- The list is trimmed at 2500 rows per device; the counters write the real total.
- The quarantine numbers count the two IP versions together; the distinction is given only by the IP version chip and the filter.
- The Management card is displayed in every route table, but the three rules it counts do work only in the DEFAULT route table of the main device; they do not work in the DEFAULT table of the zone devices either.
- The use of the screen requires modify permission in the Network area. With a monitoring authorization the screen opens and the threat strip is displayed, but the table and the cards do not fill.
