
Smarter by Design.Simpler for Business
Collective Analysis & Learning
What Is Collective Analysis & Learning?
Collective Analysis & Learning makes it possible to start a learning analysis at once for more than one Virtual Host Group of a vService. The window that opens is the same as the analysis window of the Analysis & Learning screen: the same fields, the same defaults, the same filters. Its difference is its scope.
| Analysis & Learning | Collective Analysis & Learning | |
|---|---|---|
| Where it is started from | From the mode card of the host group | From the Virtual Host Groups band |
| The Virtual Host Groups field | Passive, locked to a single group | Active, multiple selection |
| The group covered | Only the group of the card | All the selected groups |
| The result produced | One row | As many rows as the number of the selected groups |
| Visibility | Always | Only while more than one host group is defined |
The only technical difference between them is whether the host group field is locked or not. For this reason the meaning of the analysis fields, their defaults, the filters and the whole of the result table are as explained on the Analysis & Learning page; this page explains only the behavior specific to the collective run.
A collective analysis does not mean a separate analysis per group
All the selected groups are processed in a single analysis operation: the learning log is read once and every line is directed to the group it belongs to. For this reason adding a group does not lead to the log being read again; the operation may only take a little longer because the number of the lines processed increases.
On the other hand, in the result list a separate row is formed for every group. The editing, application and deletion operations are always done over these rows, that is on a group basis.
The Collective Analysis & Learning Button on WAF Management
The Collective Analysis & Learning button takes place, on the WAF Management screen, in the upper right corner of the Virtual Host Groups band.
 WAF Management - The Collective Analysis & Learning Button
The button is displayed only while more than one host group is defined in the vService. If a single group is defined, the button is not created at all; in that case the analysis link on the group's own mode card is already enough.
The same window has a second door as well: while the Analyze tab is open in the view across the vService, the New Analyze button there also opens the collective window, that is with the host group field unlocked.
In the area in which the button is, there are two targets independent of each other:
| Target | What it does |
|---|---|
| The icon | It opens the Analyze tab that lists all the analysis records of the vService. It does not start a new analysis. |
| The Collective Analysis & Learning button | It opens the collective analysis window. |
How to Access?
- Left Monitor Panel is opened.
- WAF-Protected vServices is selected from the category tabs at the top left.
- The vServices defined on TR7 with WAF protection enabled are listed.
- The vService to be monitored is clicked; the screen opens with the Dashboard tab that carries the vService's name.
- The WAF Management tab is clicked on the screen that opens.
- In the Virtual Host Groups band at the very bottom of the screen, the Collective Analysis & Learning button in the upper right corner is clicked.
The Collective Analysis Window
The title of the window is displayed as New Analyze for <vService name>. The title is the same in the collective and the single flow; Collective Analysis & Learning is only the name of the button in the band.
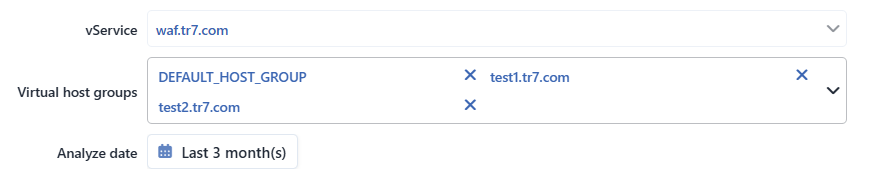 The Collective Analysis Window - The Scope Fields
Except for the two fields that determine the scope, the whole of the window is exactly the same as the analysis window on the Analysis & Learning page: Analyze Date, the Advanced switch, Ignore Old Rules, Rule Creating Mode and the six filter fields are offered with the same labels. The Source field is displayed only in the cluster setups.
The field values of the window are remembered per user and per vService; the collective and the single flow share the same record. For this reason the defaults here are valid only for the first opening, and at the following openings the last saved values come. The fields that are not remembered are the host group selection, Ignore Old Rules and the host filter.
INFO
vService
The vService on which the analysis will be run is displayed. Since the window is opened from the WAF management, this field is passive and is fixed to the vService one is on.
INFO
Virtual Host Groups Default: All selected
The host groups to be included in the analysis are selected. In the collective flow this field is active and more than one group can be selected together.
Every time the window is opened, all the groups of the vService come selected; this selection is not written into the user settings, that is the narrowing made in the previous analysis is not remembered. In the list the default group takes place first, and then the other groups in the order of definition.
In the field there is no collective checking switch; the groups are selected or removed one by one. There is no limit on the number of the groups that can be selected.
The default group is listed in this window with its raw name (DEFAULT_HOST_GROUP); in the other places of the screen the same group is seen with the Default host group label.
The traffic of a group left out of the selection does not enter the analysis at all
When a group is removed from the selection, the requests that fall to that group are not transferred to the default group; they are thrown away entirely during the analysis.
The practical result of this is the following: an analysis run by selecting only the default group produces rules over "the traffic that matches no named group". The requests that come to the domain names of the named groups do not take part in this analysis at all.
When the field is left entirely empty, the analysis still starts and the logs are read, but no result row is produced. The analysis record itself is still created; since it is not seen in any list, it cannot be deleted from the interface and takes up space in vain.
The Execution of the Analysis
When the Start Analyzing button is clicked, the window closes and the analysis starts to run in the background. The WAF Management screen stays open.
The progress is displayed as a separate bar on the mode card of every selected group. The bars do not belong to separate analyses: all of them show the progress of the same operation and carry the same percentage. The same bar takes place at the top part of the Analyze tab as well.
The Used Logs and filter breakdown values in the detail window that opens when the bar is clicked, on the other hand, are the own counters of the group belonging to the card; these values differ from group to group. When the same bar is opened from the Analyze tab, since it is not bound to a group, these counters are displayed empty.
The behavior in case of an error
The analysis has no error path on a group basis. The individual log lines that cannot be read are counted and skipped, and a log file that cannot be read is skipped entirely; neither is reported to the user separately.
If the operation itself falls, no rule is produced for any of the selected groups. On the other hand the analysis record is still written: in the list an empty row appears for every selected group and when the row is wanted to be opened, the confirmation No logs found in analysis. Would you like to delete the analysis? is displayed. The deletion operation in this confirmation removes only that row, that is that group.
The log compression stops while the analysis is going on
While an analysis is running, the compression operation of the learning logs of that vService is paused. Since the sweeping runs at the fifth minute of every hour, it does not continue as soon as the analysis ends, it waits for the next hourly round; in the long-running analyses the raw logs accumulate during this time. The pausing covers not only the analysis but all the running learning operations of that vService.
The Application of the Result
When the collective analysis is completed, a separate row appears in the Analysis & Learning list for every selected group. The editing, previewing and applying of the rows are the same as in a single analysis.
When more than one row of the same analysis is selected together, a single application operation runs. If the rows belonging to different analyses are selected together, a separate operation is started for every analysis and these operations run simultaneously.
The application works all-or-nothing
For every row in the application request a preliminary inspection is done separately first: it is required that the analysis tree be ready, that the number of page types not exceed the 500 limit and that another application not be going on for the same group.
If any one of these inspections fails, the request is rejected entirely; the rules of the other groups in the same operation are not written either. That is, a single group exceeding the 500 page type limit prevents all the groups that are wanted to be applied together.
The same rule is valid in a cluster setup as well: if an error occurs in one of the sources, no rule is written for any group.
The page type limit is measured per group; the page type numbers of the groups are not summed. A group that is caught by the limit can be taken out of the list and the others can be applied separately.
When a result row is deleted, only that group is taken out of the analysis; when the last row of the analysis is deleted as well, the analysis record is removed entirely.
Scope and Limits
INFO
- The analysis quota is counted on a row basis. The number of analyses that can be stored is limited to 50 per vService and 250 across the device. This counter counts not the number of analyses but the analysis × host group rows: a collective analysis with three groups uses three places from the quota. The quota fills faster than expected in the vServices with many groups; the old analysis records need to be deleted regularly.
- The source selection in a cluster. In a cluster setup the Source field selects only the device being worked on at the first opening; if it is wanted that the traffic of both devices be learned, the field should be changed deliberately. The value of this field is remembered per vService: once Both Devices is selected, the following analyses open with that value as well. The application step also runs on both devices and the results are combined in a single rule set.
- Simultaneous analyses. There is no limit on the number of analyses that can run at the same time. Both a single and a collective analysis can be started at the same time for the same host group; in this case two separate progress bars are displayed on the card of the group and two independent results are produced. The simultaneity restriction is only in the application step: a second application for the same vService and host group is rejected until the first one ends.
- Rule Creating Mode is always sent. The Rule Creating Mode value selected in the window is sent together with the analysis and takes the place of the Rule Creation Policy setting on the Learning Methods screen of the vService. In the analyses started manually the permanent policy is not taken into account. The Ignore Old Rules switch is not written into the user settings either and comes in the Create New Rules position at every opening. In a collective analysis this means that the rule set of all the selected groups will be set up from scratch.
- The argument learning comes from the vService setting. Whether the analysis will learn the arguments or not is not selected from the window; the own argument inspection setting of the vService is applied to the analysis directly.
