
Smarter by Design.Simpler for Business
Bot/DDoS Data Flow Panel
Bot/DDoS Data Flow Panel shows the threat protection of a vService as a live diagram consisting of three defense lines. The path on which the request passes through the L7 DDoS, IP Reputation and Bot protections and separates at the decision node into clean, monitored, challenged, blocked or quarantined traffic is seen at a single glance.
There is no need to search for which protection is in effect at the moment of an attack, which rule applies which action and why a source in quarantine is stopped at the gate: the whole defense is in a single picture and the related setting is reached directly from every box.
Where is it located?
The panel stays open on the right on all the tabs on the management screen of a Bot/DDoS-protected vService. For the detailed technical description, see Bot/DDoS Protected vServices › Dashboard.
3 Lines
Layered defense
L7 DDoS → IP Reputation → Bot; the order in the diagram is the evaluation priority
5 Results
The decision strips
Monitor, Blocked, Clean, Challenge and Quarantine on separate strips
Quarantine
Stopping at the gate
The path of a quarantined source is drawn in the diagram up to the gate of the module
Live
Instant configuration
The mode, the rule counts and the exemptions reflect the settings at that moment
With Sentences
The rule summary
The information icon in the row describes the configuration with full sentences
On Every Tab
Continuously visible
The panel stays open on all the tabs of the vService screen
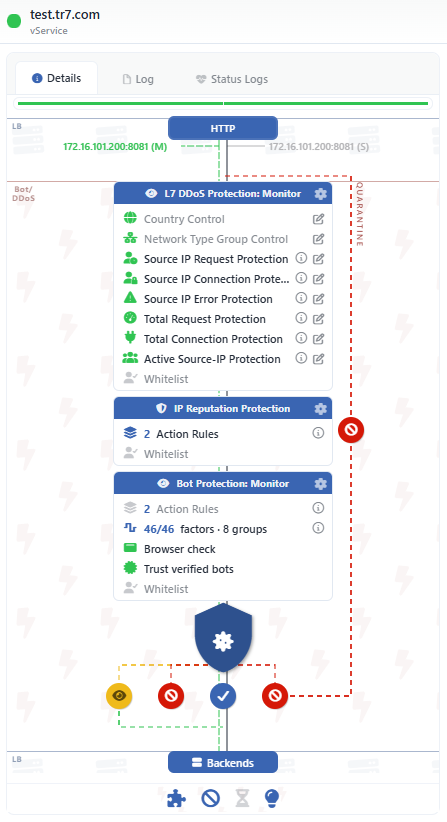 Bot/DDoS Data Flow Panel
Why Is It Important?
| The classic approach | With the Bot/DDoS Data Flow Panel |
|---|---|
| Which protection is on and which one is in monitoring mode are checked from the screens one by one. | The three protection columns stand side by side with the mode icon in their titles; a protection that is off appears faded. |
| For the limit and the window of a rule, the rule form is opened. | The information icon in the row summarizes the rule with full sentences; with the pencil, the form of the block is opened directly. |
| Where quarantine stops the request is understood by being told. | The QUARANTINE path shows with a drawing that the next request of a source in quarantine is terminated at the gate. |
| Which actions are really used is searched for in the rule lists. | Under the decision node, only the strips of the actions that are actually used appear. |
What Does the Diagram Describe?
01 · EntryThe listenersAn HTTP or L7 TCP vService, the listener addresses and the SSL badges
02 · The GateWaiting RoomIf it is defined, the waiting room appears at the gate of the module with a queue node
03 · The DefenseThe three protection columnsThe L7 DDoS blocks, the IP reputation rules, the bot factors and the exemptions
04 · The DecisionThe decision nodeThe Monitor, Blocked, Clean, Challenge and Quarantine results
05 · The TargetBackendsThe clean and the released traffic reaches the Backend Services
The setting strip under the diagram summarizes the Captcha, Quarantine, Waiting Room and Smart Advisor settings with a single row of icons; a setting that is not used appears faded and when the icon is clicked, the summary of the setting opens.
Highlights
Defense in the priority orderThe columns are lined up in the order L7 DDoS Protection, IP Reputation Protection and Bot Protection; this order is the evaluation priority of the protections.
The mode is visible in every columnThe icon in the title of every protection shows the Active, Monitor or Off status; if the three columns are in the same mode, the strip badge carries that mode as well.
The rules are described with sentencesThe information icon in the row summarizes the limits, the windows and the actions with numbered sentences.
Direct editing from the blockThe pencil in the DDoS block rows opens the form of that block, and the card gear opens the setting of the whole protection.
Quarantine is visualizedIf quarantine is used, the red QUARANTINE path shows that the request of a penalized source is cut at the gate without reaching the protections.
Only the results that are usedThe decision strips are produced only from the actions that the Active protections actually use; the strips that release return to the main line with a green line.
The bot factors in a single rowThe Bot column shows the ratio of the open factors and the number of factor groups; the browser verification and the trust in verified bots are on separate rows.
A history specific to Bot/DDoSThe Log tab in the panel lists only the changes labeled Bot/DDoS, and Status Logs lists the status transitions.
Who Is It For?
Intervention at the moment of an attack Incident management
During a traffic wave, which protection is in effect, which one has remained in monitoring mode and whether quarantine is working are seen at a single glance; the necessary setting is opened from the same diagram.
The transition from monitoring to protection Putting into service
The protections are first monitored in the Monitor mode; when the Active mode is switched to, it is verified that the enforcement has taken effect as the decision strips appear in the diagram.
Security architecture An understandable defense
How the layered defense works, through which lines a request passes and where it is stopped are explained with a single drawing.
The Detailed Technical Description
Dashboard › Bot/DDoS Data Flow Panel
The rows of the protection columns, the decision node, the result strips, the quarantine path and the lower setting strip.
→
Bot/DDoS Management
The screen on which the protection, mode and action settings seen in the diagram are managed.
→
Bot/DDoS Protection Mode
The Active, Monitor and Off modes together with the Captcha, Quarantine and Waiting Room cards.
→
Bot/DDoS
The general introduction of the module, the three protections and the working modes.
→
