
Smarter by Design.Simpler for Business
Disk Management
What Is Disk Management?
Disk Management is the screen that monitors the status of the disks on the TR7 device and manages the log files. The usage and the inode usage of the disks are followed; the sizes of the vService log files can be displayed by month and deleted; the automatic cleanup that comes into play when the disk fills up is configured. All the file operations can be done from this screen without the need to connect to the terminal (SSH).
The screen consists of two tabs: Disk State (the disk and inode usage status) and File Management (the log file management by month).
Disk Status
Disk status
The usage and the inode usage of the disks
Auto Cleanup
Automatic cleanup
Deleting the old logs when the threshold is exceeded
File Management
Log files
The log sizes by month and deleting
Notifications
Disk notifications
The summary of the defined disk notifications and the shortcut
All the Disk Operations on a Single Screen
For a load balancer and a WAF, the disk usage is a critical risk that is often not noticed but that can suddenly affect the service: the logs accumulate, the statistics and report files grow, when the disk fills up new logs cannot be written and the service health can deteriorate. TR7 carries the management of this risk completely to the web interface; there is no need to connect to the terminal (SSH), to calculate the file size with du / df or to delete logs manually on the command line.
From monitoring the disk status to deleting the log files by month, from defining an automatic cleanup policy to receiving a notification at the usage threshold, all the disk operations are managed from this single screen.
What this screen provides
- Management without a terminal: all the file and disk operations are done from the web interface; SSH or the command line is not needed.
- Visibility: the disk and inode usage; the log sizes by month and by vService at a single glance.
- Automatic protection: with the threshold- or age-based automatic cleanup, the disk filling up is prevented; the critical summary and metric files are protected.
- Early warning: with the Disk type notifications defined under Notification Management, a warning is produced at the determined usage thresholds; this screen offers the summary of the defined disk notifications and a shortcut to the definition screen.
The Disk Management Screen
By following the path Settings → Device Management → Disk Management, the disk information belonging to the TR7 device is displayed. The screen consists of two tabs: Disk State and File Management.
Disk State
It is the tab on which the usage and the inode usage of the disks are monitored. In a cluster setup, the disks of both devices are listed being distinguished with the Source column.
 The Disk State Tab
The table opens with the following columns by default:
| Column | Description |
|---|---|
| Source | Which device the disk belongs to. In a cluster setup the Server Name value of every device is listed as a separate row. |
| vDevice | The vDevice the disk belongs to; on the disk of the main device Host device is written. |
| Disk Type | The disk type. In the interface only Data disk is listed; the root and service disks are not shown. |
| Disk | The usage percentage of the disk, with a colored progress bar. |
| Disk Inode | The inode usage percentage of the disk, with a colored progress bar. |
There is no column hidden by default.
The usage indicators are colored according to the lowest threshold of the defined Disk notifications: the threshold and above red, 80% of the threshold and above yellow, and below it green. If no disk notification is defined, there is no threshold reference for the coloring.
The items in the toolbar are arranged from left to right in the following order; the last two items (The Disk Notification Summary and Page Size) are in the information strip under the table.
Columns
Which columns will be shown in the table is selected; all five columns are on by default. In the same panel the columns are reordered by dragging, the alignment is selected per column, a manually set column width is returned to automatic sizing by clicking, and with the Reset button the column layout is returned to the default. The layout is stored per user.
Export
By clicking the Export button, the disk status is exported as Excel, CSV or PDF.
Auto Disk Cleanup
By clicking the Auto Disk Cleanup button in the toolbar, a closable editing tab in which the automatic disk cleanup is configured is opened.
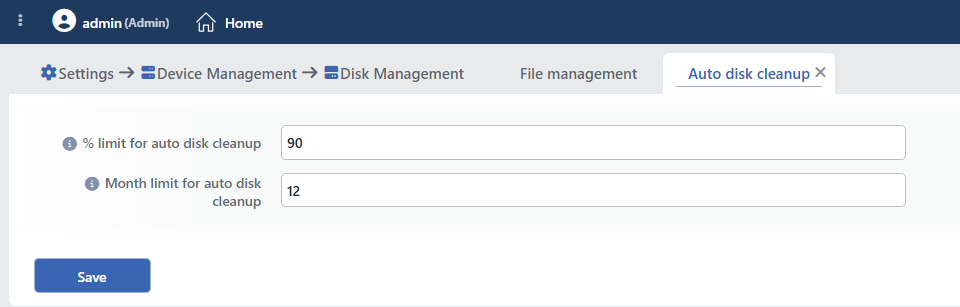 The Auto Disk Cleanup Screen
It contains two cleanup options independent of each other; under every field a live description text is displayed according to the entered value:
| Option | Default | Behavior |
|---|---|---|
| % Limit for Auto Disk Cleanup | 90% (70 – 95) | When the disk usage exceeds this threshold, the logs are deleted starting from the oldest month until the usage goes below the threshold again. |
| Month Limit for Auto Disk Cleanup | 12 months (at least 1) | The logs older than the specified month are deleted automatically. |
The cleanup runs every day at 02:00 and deletes only the unprotected file types (Learning, WAF Logs, Threat Event Logs, AGS Audit Logs, OLD Stats, OLD Compressed Stats, Report Logs, Diagnostic Logs, Obsolete Stats). The protected types (OLD Stat Summaries, Report Summaries and the active statistics metrics) are not deleted. In a cluster setup every device cleans only its own disk. The files deleted in the automatic cleanup are written to the user logs with the "[Auto disk cleanup]" label.
Search
Used to search all information in the table.
RegExp Search
Used to search all information in the table with a regular expression (RegExp).
Column Based Search
Used to perform a column-based search on the information in the table.
The Disk Notification Summary
On the information row under the table, the summary of the defined Disk type notifications is displayed: "N disk notifications set at %..."; if there is no definition, "No disk notification set yet — set one up" is written. By clicking the summary, the Notification Management screen on which the disk notifications are defined is gone to. The usage threshold (Disk Notification Limit (%)) is no longer a field on this screen; it is defined per notification record in Notification Management.
Page Size
The maximum number of rows to be displayed on the page is selected. The arrow icons are used to navigate between the pages.
File Management
By following the Settings → Device Management → Disk Management → File Management tab, the details and the sizes of the logs on the TR7 server are displayed by month.
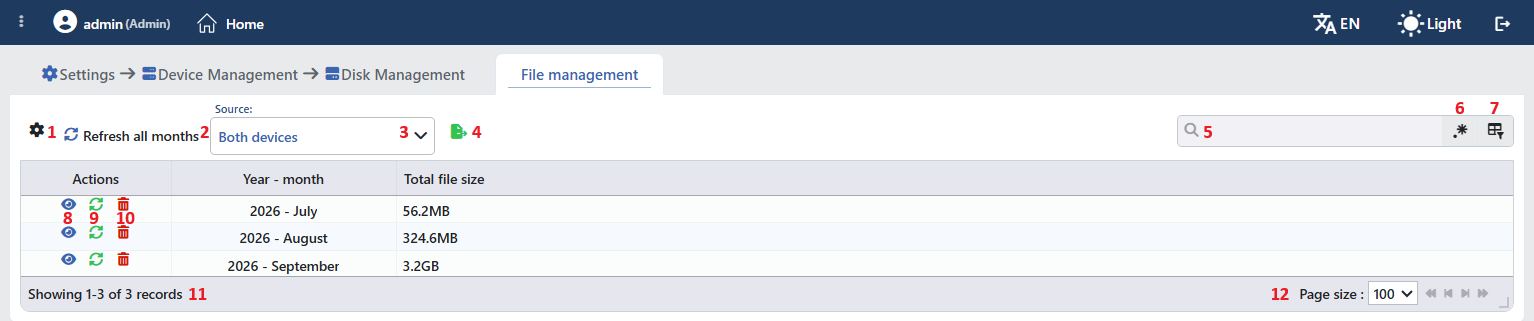 The File Management Tab
The table opens with the following columns by default:
| Column | Description |
|---|---|
| Actions | Three operation icons per row: the eye (opens the detail belonging to the month), the refresh (recalculates the sizes of that month) and the trash bin (deletes all the files of that month). |
| Year - Month | The year and the month the records belong to. |
| Total File Size | The total size of the files belonging to that month. |
The monthly usage details are also updated automatically in addition to the manual refresh: every night at 02:00, the usage detail of the current month and of the previous month is recalculated.
The items in the toolbar are arranged from left to right in the following order; the last two items (Page Information and Page Size) are located in the information strip below the table.
Columns
Which columns will be shown in the table is selected. In the same panel the columns are reordered by dragging, the alignment is selected per column, a manually set column width is returned to automatic sizing by clicking, and with the Reset button the column layout is returned to the default. The layout is stored per user.
Apart from the three columns that come open by default, the remaining ones show the total size per file type and are opened from the column selector:
| Column | Description |
|---|---|
| Total Files | The total number of files in that month. |
| Learning | The learning data. |
| WAF Logs | The WAF event records. |
| Threat Event Logs | The Bot/DDoS event records. |
| AGS Audit Logs | The AGS audit records. |
| OLD Stats | The statistics files in the old format. |
| OLD Compressed Stats | The compressed statistics in the old format. |
| OLD Stat Summaries | The statistics summaries in the old format. |
| Report Logs | The raw records kept for the report generation. |
| Report Summaries | The report summaries. |
| Diagnostic Logs (debug & HTTP) | The Debug Mode and HTTP traffic records. |
| Stats | The current statistics metrics. |
| Obsolete Stats | The statistics files that are no longer used. |
Refresh All Months
By clicking the Refresh All Months button, all the log files are checked, the sizes are recalculated and the table is updated. The operation starts after the "The usage calculations of all month will be renewed. This action may take several minutes." confirmation.
Source
In a cluster setup it provides the logs to be filtered according to which device they belong to; the options are Both devices and the server names (hostname) of the devices. It is displayed only while the cluster is active.
Export
By clicking the Export button, the log file details on a year/month basis are exported as Excel, CSV or PDF.
Search
Used to search all information in the table.
RegExp Search
Used to search all information in the table with a regular expression (RegExp).
Column Based Search
Used to perform a column-based search on the information in the table.
View Usage Details
By clicking the eye icon in the Actions column, a closable tab on which the files belonging to the selected month are listed on a vService basis is opened. The tab carries the name of the related month: <year> <month> usage details (e.g. 2026 September usage details). On this screen the sizes of the system logs and of the vService logs created on TR7 are displayed; the deleted vServices also take place in the list in a faded/italic form, with the "Deleted vService" description.
The files are deleted by being selected: the checkbox in the Total File Size heading selects all the rows, and the checkbox in the heading of every file type selects that type for all the vServices. On the information row the selection summary is displayed; while nothing is selected "No files selected", and when a selection is made the number of selected files and their total size are written. By clicking the Delete Selected button, the selected files are deleted after the confirmation question; the button stays disabled without a selection being made.
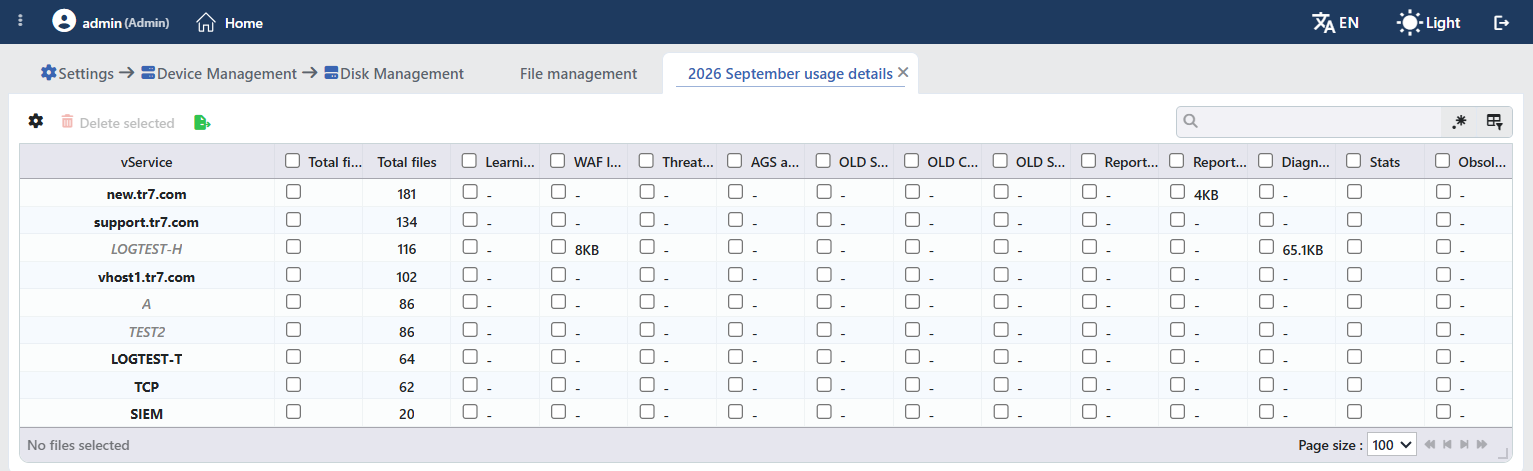 The Usage Details Tab
Refresh
The log files belonging to the selected month are checked, the sizes are recalculated and the table is updated; confirmation is requested before the operation.
Delete
It deletes all the log files belonging to the selected month. This operation cannot be undone; confirmation is requested twice in a row (the second confirmation emphasizes that the operation has no return).
Page Information
The information of how many rows belonging to the months there are in the list takes place.
Page Size
The maximum number of rows to be displayed on the page is selected. The arrow icons are used to navigate between the pages.
