
Smarter by Design.Simpler for Business
Event Logs
What Is Event Logs?
Event Logs is the log screen on which every request that exceeds the blocking threshold or that triggers a monitored rule in a WAF-protected vService is examined one by one. A row does not only say "this request was blocked"; it gathers in a single window which signatures the request triggered, which attack category, OWASP item, CWE and MITRE ATT&CK technique these signatures correspond to, the body and the headers of the request, and the network and the location of the attacker.
The actual value of the screen is that it connects the examination to the action. When a log is evaluated as a false positive, that request shape is taught from the same screen with Allow or Teach and similar traffic is not blocked again. If the attack is real, the source address is taken into the blacklist in the same window. Thus the "examine the log, then write a rule on another screen" cycle disappears.
The screen makes the decision WAF has given verifiable. Every row carries the justification of the decision: which signature was triggered, in which section of the request, with which risk score and in which mode the decision was taken. Thus, besides the question "what happened", the question "why was it decided this way" is answered as well; how a rule set behaves in the real traffic is read over the production data, without a test environment being set up.
3
Decision lane
The blocking, the monitoring and the teacher separate in a single column
One Click
Teach the false positive
With Allow or Teach the request shape is taught from the same screen
Two Layers
Filtering
The scope pulled from the server and the strip that narrows the pulled log
7
Taxonomy axis
Category, OWASP Web, OWASP API, CWE, CAPEC, MITRE ATT&CK and the target technology
Retrospective
Attacks counter
The old logs are evaluated again with today's rule set
Permanent
Storage on the disk
The past logs are preserved up to the Disk Management limits
Per vService
Produced separately
Every vService with WAF protection on produces its own log
Cluster
A single combined list
The logs of the two devices are combined in a single list and sorted by date
Event Logs is a part of the WAF module. The usability of WAF depends on the license version of the device; while the module is enabled, a separate license item or a vService number limit is not applied for the logging. Every vService with WAF protection on produces its own log without a separate setting being turned on. The logs are kept on the disk per vService, and the table is exported as Excel, CSV or PDF. The logs of all the WAF-protected vServices, on the other hand, are gathered in a single table on the Global WAF Event Log screen.
Its difference from the learning log
Event Logs is an attack log. Analysis & Learning, on the other hand, reads the learning log written to a separate file. The two logs are not kept in the same file and one does not take the place of the other.
Supported vService Types
Since WAF protection is enabled only in the HTTP vServices, Event Logs is produced only in this type as well:
HTTP
L7 TCP
Network
How Does It Work?
Event Logs is the bridge between the decision the WAF engine gives and the rule set itself. The chain works in four steps: the engine inspects the request, the decision falls to the disk as a row, the screen reads and narrows these rows and the decision given at the end of the examination is written directly into the rule set. Thus the protection matures with the feedback coming from the live traffic.
01 · InspectionThe request is inspected against the signaturesThe WAF engine scans the path, the parameters, the headers and the body of the request; every matching signature produces a risk score and the working mode of the host group determines the decision.
02 · WritingThe decision falls to the diskA row is written only when the request is blocked or when a monitored rule is triggered. The row carries, together with the decision, the triggered signatures, the whole of the request and the network information of the source.
03 · ExaminationThe logs are read and narrowedThe screen reads the files of the selected range, combines the rows of the two devices in a cluster by deduplicating them; the server filter narrows the scope and the filter strip the pulled set.
04 · ActionThe decision is written into the rule setThe request shape that is seen to be a false positive is taught from the same screen and is written into the rule set; the source of the real attack is taken into the blacklist. The taught signature also falls from the counters of the old logs.
Operational Best Practices
- A new rule set should first be watched in the Monitor mode. Before passing to the Blocking mode, the host group is run for a while in the Monitor mode and the rows accumulating on this screen are examined. Thus the false positives are seen and taught before the real user traffic is blocked.
- The match itself should be read before teaching. The Description field in the Attacks tab shows the section of the request that matches the signature by highlighting it. The teaching decision should be given by looking at this field; if the matching section really belongs to the own traffic of the application, it is a false positive.
- What the teaching will do should be seen beforehand. The Learning Suggestion row reports beforehand whether the operation will create a new rule or widen an existing one. A teaching that will produce a new rule means the growth of the rule set.
- The scope should be narrowed before teaching. The button in the title teaches the whole of the log; when only the relevant attack is selected from the Attacks tab and taught, the real attacks in the same log are not carried into the rule set.
- The filter strip narrows the teaching scope as well. When a selection is made in an attack-based tab, the collective teaching from the list covers only the attacks that match the selection. This is the safest way of teaching a certain signature in all the logs.
- If the screen is empty, the working mode should be checked first. While the host group is in the Learning mode, no row is written to this screen. An empty list does not mean that there is no attack.
- The narrowing should be set up in the server filter. The row limit cuts the result, not the scan: when the filter is defined on the server side, the reading backwards continues until the limit is filled and the record searched for is found. Narrowing the filter gives a faster result than enlarging the limit.
- The blacklist operation should first be tried in the service scope. The blacklist in the general scope affects all the vServices; in an attack that targets a single application the service scope is enough and its effect stays limited.
- The suppression rules should be remembered while comparing with the report totals. If a log suppression is defined, the rows continue to be written to the file but are not shown in this list; since the report of the same period counts these rows, the totals of the two surfaces may be different.
- This screen should not be used for live monitoring. The list does not refresh by itself. For instant traffic tracking Live Stats, and for a periodic summary WAF Report is used.
Under Which Condition Is the Log Produced?
A log being written for a request depends on one of two conditions: the total risk score of the request exceeding the blocking threshold or a monitored (Monitor) rule being triggered. If none of these conditions occurs, a row is not produced for the request; the clean traffic and the individual signature matches that stay below the blocking threshold are not seen on this screen.
The threshold being exceeded does not mean that the request has been blocked. If the host group is working in the Monitor mode, the request is let through but its log is still written; the decision sentence states this as Not blocked — Monitor mode as well.
The teacher traffic is not always logged
A request recognized by the teacher (Teacher) is not blocked: the recognition disables the blocking threshold for that request. For this reason the log of such a request is written only if a monitored rule has been triggered as well. A teacher request that only the ordinary signatures have matched is not seen on this screen at all.
This screen stays empty in the Learning mode
While the host group is in the Learning mode, the requests are written into the learning log and the WAF log is not produced at all. In this case the Event Logs screen looks empty; this does not mean that there is no attack.
For the log to be formed, the host group needs to be working in the Monitor or Blocking mode.
The same silencing is valid, independently of the mode of the host group, for the sources in the Analyze IP list as well: a request coming from an address in this list is written into the learning log even if the host group is in the Blocking mode and does not fall into Event Logs.
The log suppression affects the list
If a suppression condition is defined on the Log Settings screen, the rows that match the condition continue to be written to the file but are not shown in this list. Since the WAF Report output produced unfiltered for the same period counts these rows, the totals of the two surfaces may be different. When the report is produced with a filter, the suppressed rows are skipped there as well.
The file layout and the storage
The logs are written per vService, to one file per hour. The files older than two hours are compressed at the fifth minute of every hour and their raw states are deleted; the reading opens the compressed files transparently.
How long the logs will be kept depends on the Disk Management settings: by default the data older than 12 months and, when the disk occupancy exceeds 90%, the oldest logs are cleaned.
Behavior in the cluster
Every device keeps its own log. The screen combines the logs of the two devices in a single list and sorts them by date. Which device the log comes from is displayed in the Source column; this column does not take place at all outside a cluster setup.
Access to Event Logs
- Left Monitor Panel is opened.
- WAF-Protected vServices is selected from the category tabs at the top left.
- The vServices defined on TR7 with WAF protection enabled are listed.
- The vService to be monitored is clicked; the screen opens with the Dashboard tab that carries the vService's name.
- The Event Logs tab is clicked on the screen that opens.
The tab is not created for the users who do not have the WAF authorization. The Global WAF Event Log screen that gathers the logs of all the WAF-protected vServices in a single table, on the other hand, is opened from the Configuration Menu and is not shown to the users whose authorization is limited to certain vServices.
The Logs Listing Screen
By following the WAF-Protected vServices → Event Logs path, the logs of the selected vService are reached. Over this screen the logs are filtered, examined and the requests evaluated as a false positive are taught.
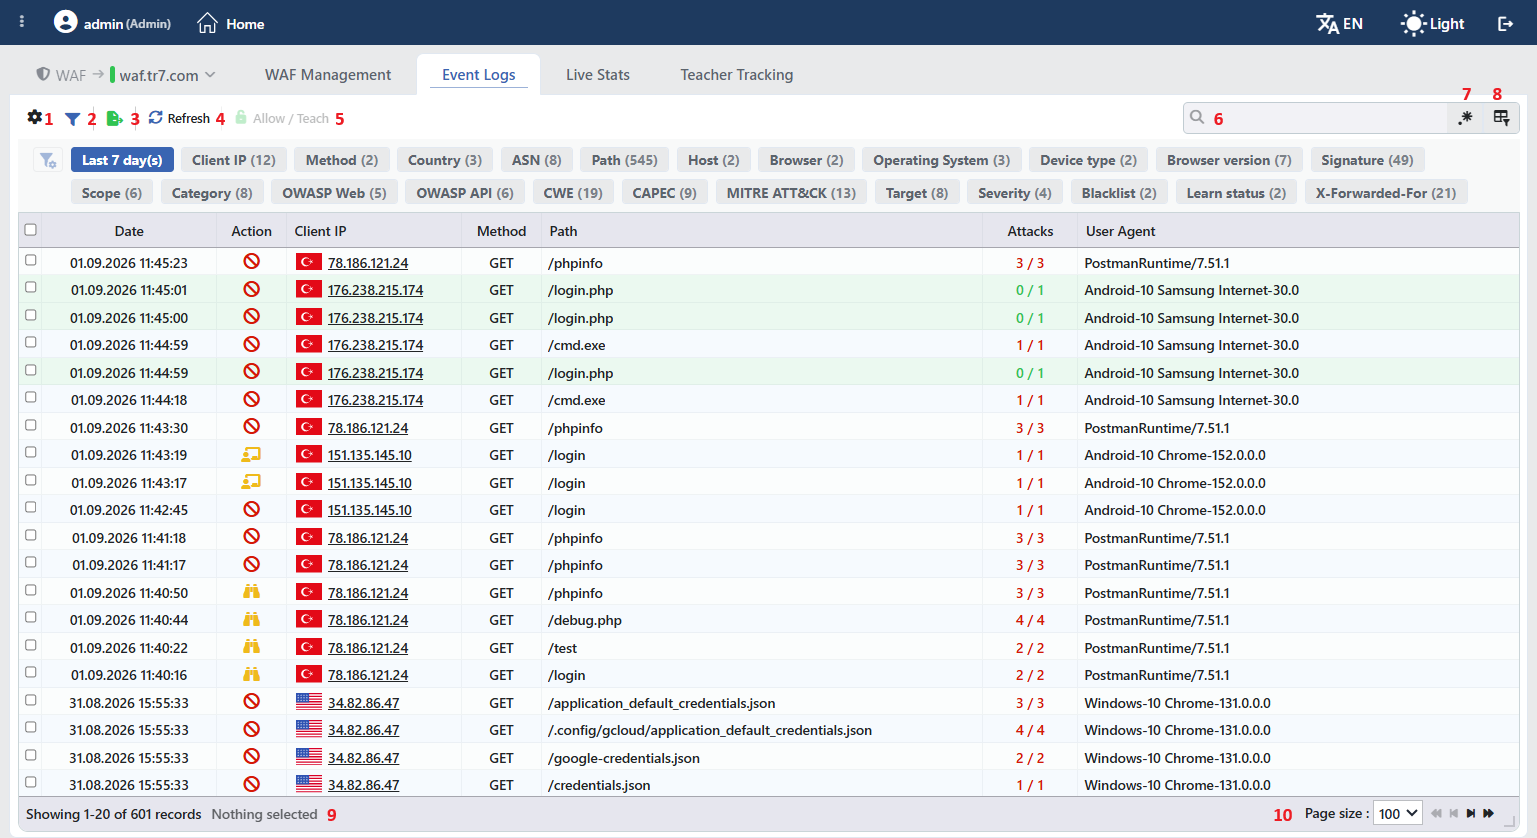 The Logs Listing Screen
The table opens with the following columns by default:
| Column | Description |
|---|---|
| Date | The date and time at which the log was written, in the DD.MM.YYYY HH:mm:ss form. |
| Action | The decision WAF has given, with an icon that changes according to its lane (The Action Values). |
| Client IP | The IP address of the client that sent the request, together with the country flag. |
| Method | The HTTP method of the request. |
| Path | The requested path; the long values are displayed in full when the cell is hovered over. |
| Attacks | The number of attacks that are still open with the number of signatures triggered when the log was formed (The Attacks Column). |
| User Agent | The browser, operating system or client information of the client converted into a readable form; the raw User-Agent value is displayed when the cell is hovered over. |
The following columns are hidden by default and are added from the column selector:
| Column | Description |
|---|---|
| Severity | The level of the highest risk score among the signatures in the log (The Severity Values). |
| Host | The domain name to which the request was sent. |
| Category | The attack categories of the triggered signatures. |
| Scopes | The request sections in which the attacks were caught (the path, the query, the header, the form, JSON, XML or the raw body). |
| ASN Org | The organization that operates the autonomous system the client IP address belongs to; the network block is displayed when the cell is hovered over. |
| X-Forwarded-For | The addresses carried in the X-Forwarded-For header of the request; if there is no header, -. |
In a cluster setup the Source column that shows the device the log comes from is added to the beginning of the table, and on the global screen the vService column that shows the vService the log belongs to. When a column header is clicked, first a descending and then an ascending sorting is applied; at the third click the sorting is removed. The Attacks column is sorted according to the number of attacks that are still open.
The Action Values
The Action column does not carry text. It shows the decision with an icon that changes according to the lane the decision falls into. There are three lanes and every one of them has its own icon and color:
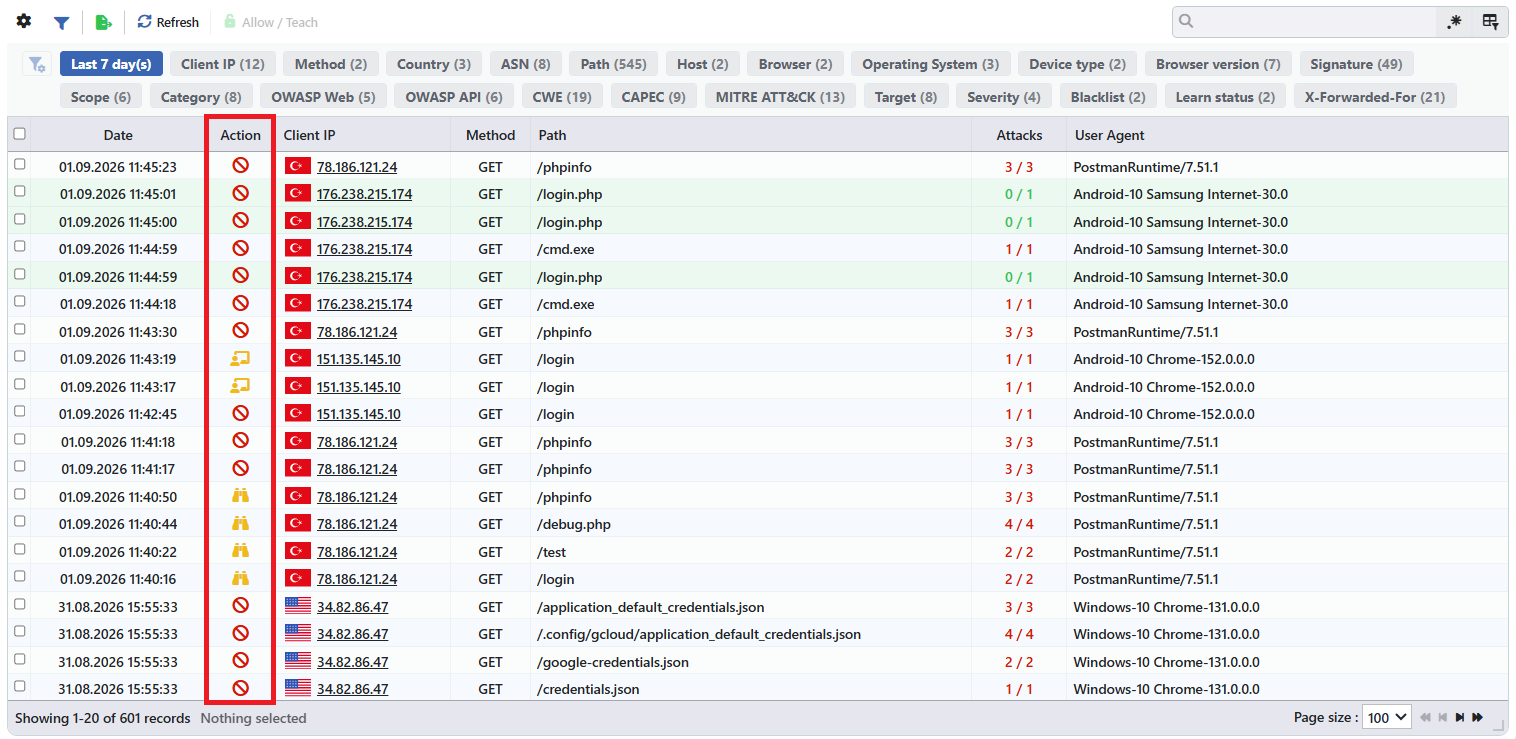 The Action Column and the Taught Rows
| Icon | Lane | Meaning |
|---|---|---|
| Blocking | The request was blocked by WAF. | |
| Monitoring | The request was let through, the attack was only recorded. | |
| Teacher | The request was let through because it was recognized by a teacher. |
The teacher lane uses the same color as the monitoring lane: in both of them the request has been let through. The distinction is made by the icon; a request that feeds the learning is read differently from a request that is only monitored.
When the icon is hovered over, the full counterpart of the decision is displayed as a sentence. The monitoring lane separates into two different sentences according to why the request has been let through:
| Decision | Meaning |
|---|---|
| Attack blocked | The request was blocked. |
| Not blocked — Monitor mode | Since the host group is in the Monitor mode, the request was let through and the attack was only recorded. |
| Not blocked — Below the blocking threshold | The total risk score stayed below the blocking threshold; the triggered signatures were recorded. |
| Not blocked — Teacher matched | The request was let through because it was recognized by the teacher. If the name of the teacher has fallen into the log, it is written in the sentence together with its name. |
When all of the signatures in a log are taught, the row turns pale green and the first number of the Attacks column falls to zero. This color tells not the decision but the work that remains: the Action icon continues to show the decision at the moment the log was formed, the teaching operation does not change the decision in the past. When a row is clicked and its preview is opened, the green tone and the color of the icon are removed, and the own highlight of the focused row becomes valid; checking with the box at the beginning of the row does not affect these colors.
In the exports the column is written with the short counterpart of the decision instead of the icon; in the teacher lane, if the name of the teacher is known, its name is used.
The Attacks Column
The Attacks column shows two numbers. The second number is the number of signatures triggered at the moment the log was formed and does not change. The first number gives how many signatures the same request would still trigger with today's rule set. In a log that carries no attack, - is displayed instead of two numbers.
The color of the column tells the remaining work: if no signature has been taught it is written in red, if some of them have been taught in yellow, and if all of them have been taught in green. When the numbers are hovered over, this situation is displayed as a sentence as well.
For this reason the column changes retrospectively: as a signature is taught, the first number falls in the old logs as well. When the value falls to zero, that is when all the signatures in the log have been taught, the row turns green. The sorting is also done according to the first number, that is according to the number of attacks that are still open.
The Severity Values
The Severity column shows the counterpart of the highest risk score among the signatures in the log; not the total score of the request. The level is derived from the score with thresholds:
| Level | The risk score |
|---|---|
| Blacklist | 50 and above |
| Structural | 10 and above |
| Very High | 8 and above |
| High | 6 and above |
| Medium | 4 and above |
| Low | 2 and above |
| Very Low | Below 2 |
The items in the toolbar are arranged from left to right in the following order; the last two items (Page Information and Page Size) are located in the information strip below the table.
Columns
It is selected which columns will be shown in the table; the seven columns above are open by default and six columns are hidden. On the same panel the columns are reordered by being dragged and an alignment is selected per column; with the Fit rows to the page button the row height is fitted to the page, and with the Reset button the column layout is taken to the default. The layout is stored per user.
Filter
The Filter button opens and closes the filter strip and shows the number of active filters on the button with a badge. On this screen there are two separate filter layers: the server filter that determines which logs will be pulled from the server and the filter strip that narrows the pulled logs.
Export Table
The table is exported as Excel, CSV or PDF by clicking the Export Table button. In the window that opens, the Filename, Format and Data Source, together with the Columns to be exported, are determined; the remaining fields are displayed according to the format: CSV Separator for CSV, Excel Sheet Name for Excel, and Page Orientation and Page Size for PDF.
By default the export contains not the visible page but the whole of the filtered and sorted logs. In the export the Action column is written with the short counterpart of the decision instead of the icon.
Refresh
The logs are pulled from the server again by clicking the Refresh button. The screen does not refresh by itself: new logs do not come to a list that stays open without this button being clicked or without the server filter being changed. While the loading is going on, the button is passive.
Allow / Teach
When one or more rows are selected and it is clicked, the signatures the selected requests have triggered are taught and similar traffic does not count as an attack again. The operation is verified with the Are you sure? confirmation. For how the teaching done is reverted, see Reverting the Teaching.
The name of the button changes according to the selection: if only blocked logs are selected it is displayed as Allow, if only the logs let through by the monitoring or by the teacher are selected as Teach, and if the two are selected together as Allow / Teach. When no row is selected and while the teaching is going on, the button is passive.
The teaching is done over the visible state of the list: if there is an attack-based selection in the filter strip, only the signatures that match the selection are taught, and the signatures of the same request that stay outside are not touched. This is the safest way of teaching a certain signature in a large number of logs.
Search
Used to search all information in the table.
RegExp Search
Used to search all information in the table with a regular expression (RegExp).
Column Based Search
Used to perform a column-based search on the information in the table.
Page Information
There is information belonging to the total number of the logs brought and to the number of logs displayed in the list: Showing N-M of T records and the number of the selected logs (N selected, Nothing selected while there is no selection). While a filter is active, the filter summary is displayed as well.
Page Size
The maximum number of the logs to be displayed on the page is selected. The default is 100; the options are 5, 10, 20, 50, 100, 200, 500 and All. The selection is not stored.
Right-Click Menu
When a row is right-clicked, a menu without a title and with a single operation opens. The operation is applied only to the right-clicked log; the selection made in the list does not affect the menu.
| Operation | What it does |
|---|---|
| Allow / Teach | It teaches the signatures the right-clicked log has triggered; the same confirmation question as the Allow / Teach button on the toolbar is displayed. While the teaching is going on, the operation is passive. |
The Server Filter
The fixed tab at the beginning of the filter strip determines which logs will be pulled from the server. This tab cannot be closed, hidden and its place cannot be changed; since it determines the pulling scope, it stands at the very beginning of the strip. In its title the selected time range is written, together with the number of the defined condition groups if an advanced filter is defined.
 The Server Filter Tab
INFO
Date Range Default: Last 7 day(s)
The time range in which the logs will be pulled is selected. A relative duration in minutes, hours, days, weeks, months and years or a start and end date can be given; the resolution is one minute.
INFO
Line Limit
It is determined at most how many logs will be pulled from the server. On the vService screen the default value is 1,000 and on the global screen 5,000; at most 20,000 can be entered in the field. When a value outside the limits is entered, the field gives an error and the pulling operation cannot be started.
This limit cuts the number of results, not the scan: while a filter is defined, the server continues to read backwards until the limit is filled.
INFO
Request Unique ID
To reach the log of a single request directly, the unique identity of the request is entered. When the field is left empty, all the requests are listed.
INFO
Log Filter
The advanced filter that runs on the server side is set up. The filter fields are gathered under four headings:
| Group | Fields |
|---|---|
| Network | Client IP, Country, City, ASN |
| Request | Method, Host, Path, Query, User Agent, Request header (by giving the header name) |
| WAF | WAF score, Monitor only, Blacklist, Learn status, Severity, Action |
| Taxonomy | Category, CWE, MITRE ATT&CK, CAPEC, OWASP Web, OWASP API, Target, Signature, Attack scope |
On the global screen the vService field that filters which vService the log belongs to is added to the Request group as well.
The comparison operators are offered as equality, list membership, containing, starting, ending, regular expression, numeric comparison, CIDR match and the existence of the field. There is no separate "not" switch: the negative counterpart of every operator takes place in the list as its own option. The text comparisons work without observing the case distinction. For the complex conditions a JSONata expression can also be written.
The conditions are set up in groups; the conditions within a group and the groups are connected to each other with separate and/or switches.
The taxonomy, severity, scope and signature filters are attack-based: the attacks that do not match are taken out of the log, and a log that has no attack left falls out of the list. The same pruning is applied when there is a JSONata expression in the filter as well.
INFO
vService Only on the global screen
It is selected in which vServices the scan will be done. In the default state all the WAF-protected vServices are scanned; when a selection is made, the log files of the others are not opened at all and the whole of the row limit is spent on the selected ones.
This field is different from the vService tab in the filter strip: the tab only filters the rows that have been pulled, this field narrows the scan itself.
INFO
Save & Get Logs
All the fields in the tab are kept on a single draft; the changes made are not applied until this button is clicked. When the button is clicked, the time range, the row limit, the request identity and the advanced filter are saved together and the logs are pulled from the server again with the new scope. On the global screen the selected vService list is sent in the same operation as well.
The button becomes enabled only while there is a change in the draft; when no field has been changed, it stays passive. If the time range is invalid or if the row limit is outside the allowed range, the button is passive again and the faulty field is shown in red. A faulty value is not corrected silently, the pulling operation is prevented.
When the tab is closed without being saved, the draft is not preserved: the tab is set up again with the scope in force at every opening. To refresh the list without changing the scope, the Refresh on the toolbar is used.
The Filter Strip
The logs pulled from the server are narrowed from the strip above the table. Every tab in the strip represents a field; the number in parentheses in the tab title gives how many different values have been seen in that field.
When a tab is opened, the number next to the values listed counts a different thing according to the scope of the tab: in the tabs whose scope is Log it shows in how many logs the value occurs, and in the tabs whose scope is Attack in how many attacks it occurs. A single log that triggers three signatures adds three to the related taxonomy value. The values are sorted from the greatest to the smallest according to this number and in the list the first 60 values are shown first, and as it is scrolled down, the list grows.
The value searched for is found by typing it in the search box at the top right of the table; this box filters the table rows at the same time as well. Even if the number of a value falls to zero because of the selections in other tabs, the value stays in the list.
The Filterable Information
The tabs offered in the strip and the information they contain are listed below. The Scope column shows whether the selection is applied to the whole of the log or to a single attack in the log.
| Tab | Description | Scope |
|---|---|---|
| Client IP | The IP address of the client that sent the request. The values are listed together with the country flag and the IP information card. | Log |
| Method | The HTTP method of the request. | Log |
| Country | The country the client IP address is resolved to; it is listed with the flag and the country name. | Log |
| IP Tags | The IP Tags that match the client IP address; untagged addresses are collected under the No Tags option. | Log |
| ASN | The autonomous system number the client IP address belongs to. Next to the number the name of the operator is shown as well. | Log |
| Path | The path information of the request. | Log |
| Host | The domain name to which the request was sent. | Log |
| User Agent | The User-Agent header the client has sent; it is listed by being converted into a readable form, and the raw value stays in the explanation line. It is hidden by default. | Log |
| Browser | The browser name derived from the User-Agent header. | Log |
| Operating System | The operating system derived from the User-Agent header. | Log |
| Device Type | The device type derived from the User-Agent header. | Log |
| Browser Version | The browser version derived from the User-Agent header. | Log |
| Protocol | The protocol the request is carried over. It is hidden by default. | Log |
| Signature | The signature that caught the attack. The values are listed with the signature name, and the explanation of the signature is seen below the entry as well. | Attack |
| Scope | The request section in which the attack was caught: the path, the query, the header, the form, JSON, XML or the raw body. | Attack |
| Category | The attack category of the signature. The structural inspection and the IP reputation rules also take place in this tab with their own categories. | Attack |
| OWASP Web | The counterpart of the signature in the OWASP Top 10 Web list. | Attack |
| OWASP API | The counterpart of the signature in the OWASP Top 10 API list. | Attack |
| CWE | The CWE weakness codes of the signature. | Attack |
| CAPEC | The CAPEC attack pattern codes of the signature. | Attack |
| MITRE ATT&CK | The MITRE ATT&CK techniques of the signature. The techniques belonging to the moment of the attack and to after the attack are gathered in a single tab. | Attack |
| Target | The technology or component the signature targets. | Attack |
| Severity | The severity level derived from the score of the attack. The values are listed with the color code in the table. | Attack |
| Blacklist | Whether the client IP address is in the blacklist or not. The value is not read from the log, it is calculated according to the IP reputation configuration at that moment. | Log |
| Learn Status | The teaching state of the signatures in the log: the logs all of whose signatures have been taught, some of whose signatures have been taught and none of whose signatures have been taught are listed separately. The logs that have no attack left count as taught. | Log |
| X-Forwarded-For | The client IP address carried in the X-Forwarded-For header of the request. If there is no header, the log does not produce a value in this tab. | Log |
The User Agent and Protocol tabs are hidden by default and are added from the tab manager. On the global screen the vService tab that shows which vService the log belongs to comes at the beginning of the list.
In the Method, Country, User Agent, Browser, Operating System, Device Type, Browser Version, Protocol and Blacklist tabs a single value is selected; in the remaining tabs more than one value can be checked together.
The Combining of the Selections
The selections within the same tab are connected to each other with or, and the selections in different tabs with and. The numbers are recalculated as the selection is made; the numbers of a tab reflect the log set narrowed in the other tabs.
In the tabs whose scope is Attack the selection prunes the attack list of the log as well: the attacks that do not match are taken out of the log and a log that has no attack left falls out of the list. For this reason in the preview only the attacks that match the selection are seen.
The visibility of the tabs, their order and the selections on them are stored per user; the time range, the row limit, the request identity and the advanced filter are preserved in the same way as well. These settings are kept separately for the vService screen and the global screen, one does not affect the other.
Preview of the Selected Log
When a log is clicked in the list, the preview window opens on the right side of the screen. In the title there are the icon of the decision and the decision itself (such as Attack blocked, Not blocked — Teacher matched), below it the unique identity of the request and the copy icon, and at the top right the teaching button.
| Operation | What it does |
|---|---|
| The copy icon | It copies the unique request identity below the title to the clipboard; the identity is used to find the same log in the Request Unique ID field in the server filter. |
| Allow / Teach | It teaches the attacks of the previewed log in a single operation; its detail is below. |
In the window there are three tabs; the last viewed tab is remembered per user:
Summary
It shows the taxonomy distribution of the log and the attacker, request, signature and taxonomy summary.
Attacks
It lists the attacks in the log; it shows the rule, signature, match and teaching suggestion details of the selected attack.
Request & Location
It shows the request itself (the host group, the path, the headers, the body) and the network and location information of the attacker.
The Allow / Teach Button in the Title
The button in the upper right corner of the window teaches the attacks of the previewed log in a single operation. If there is an attack-based selection in the filter strip, only the attacks that match the selection are taught; if there is no such selection, the whole of the log is taught. The name of the button changes according to the decision of the log: in a blocked log it is seen as Allow, and in a log let through by the monitoring or by the teacher as Teach.
When the button is clicked, a confirmation is asked first. When it is confirmed, the rule changes are calculated for all the attacks in the log and are applied directly; a preview of the changes is not shown, and there is no separate saving step. The operation may take time according to the size of the rule set and until it is completed the button stays passive.
When the teaching ends, the first number of the Attacks column of the row in the list falls; if all the signatures in the log have been taught, the row turns green. If it is wanted that only certain attacks be taught, the selection in the Attacks tab is used.
Summary Tab
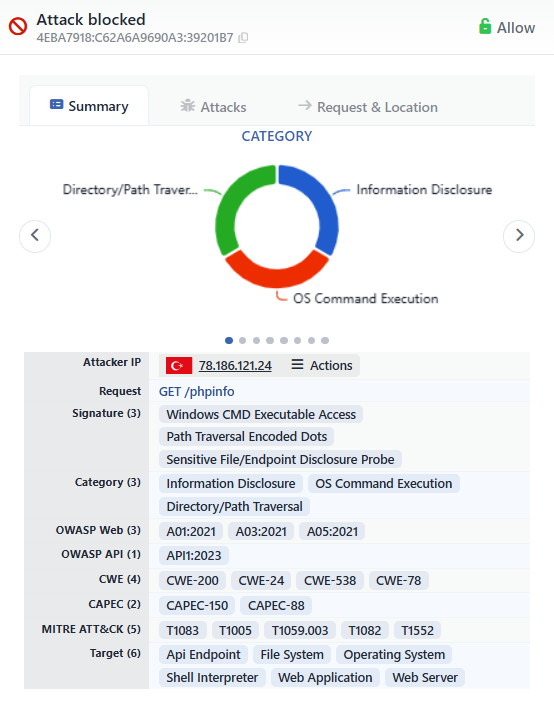 The Preview - The Summary Tab
It gives the taxonomy summary of the log. The ring graph at the top shows the distribution of a dimension; the dimensions are navigated with the arrows on the two sides of the graph or with the dots below it, and the name of the selected dimension is written above the graph. The dimensions are, in order, Category, OWASP Web, OWASP API, CWE, CAPEC, MITRE ATT&CK, Target and Signature; the selection is stored per user. Contrary to the table rows, a dimension that carries no value does not fall out of the list, it stays in the same dimension with a no-data indicator.
Below the graph the summary of the log is listed in order:
| Information | Description |
|---|---|
| Attacker IP | The source address that sent the request, together with the country flag. From the Actions menu next to it, the address is taken into the blacklist or the whitelist. |
| Request | The summary of the request: the HTTP method and the path (e.g. GET /application_default_credentials.json). The full path is displayed in the tooltip. |
| Signature | The names of the signatures the request has triggered. The number in the title gives how many different signatures have been triggered. |
| Category | The attack category counterparts of the triggered signatures (e.g. Arbitrary File Read). |
| OWASP Web | The counterparts of the signatures in the OWASP Top 10 Web list (e.g. A01:2021). |
| OWASP API | The counterparts of the signatures in the OWASP Top 10 API list. |
| CWE | The CWE weakness codes of the signatures (e.g. CWE-219). |
| CAPEC | The CAPEC attack pattern codes of the signatures. |
| MITRE ATT&CK | The MITRE ATT&CK technique codes of the signatures (e.g. T1005). |
| Target | The technology or component the signatures target (e.g. File System). |
The number next to every taxonomy title states how many different values there are in that field. The titles that carry no value are not listed; for this reason the taxonomies that have no counterpart in the log are not seen in the window at all.
The Actions menu on the Attacker IP
The Actions menu in the Attacker IP row makes it possible to do an operation directly on the source address. The menu works in two scopes and every option writes its scope next to it:
- The service scope: the options are displayed together with the name of the vService (Add to Blacklist and Add to Whitelist, with the vService name in parentheses). The address is taken into the blacklist only for this vService or is kept outside the blacklist. Leaving it outside the service makes the traffic pass in this vService even if the address is in the list across the device; it comes before all the blacklist sources the service reads.
- The general scope: the options are displayed with the IP Intelligence note. The address is added to the IP Intelligence & Reputation blacklist or whitelist across the device and affects all the vServices.
The options in the menu change according to the current state of the address: for an address that is not in the list the adding option, and for an address added manually the option of removing it from the list is displayed. The blacklist records that come from the external sources cannot be removed from this menu; instead, adding to the whitelist is offered, because the user list is read before the external source list.
Since every option changes the live configuration, it asks for a confirmation; in the confirmation window the address and, if it is known, its country is written.
When the address itself is clicked, the information window that shows the reputation information of the address opens. The addresses in the blacklist are written in a separate color and the Blacklist IP label is added next to them; the color changes according to whether the record comes from the list across the device or only from the list of this vService.
Attacks Tab
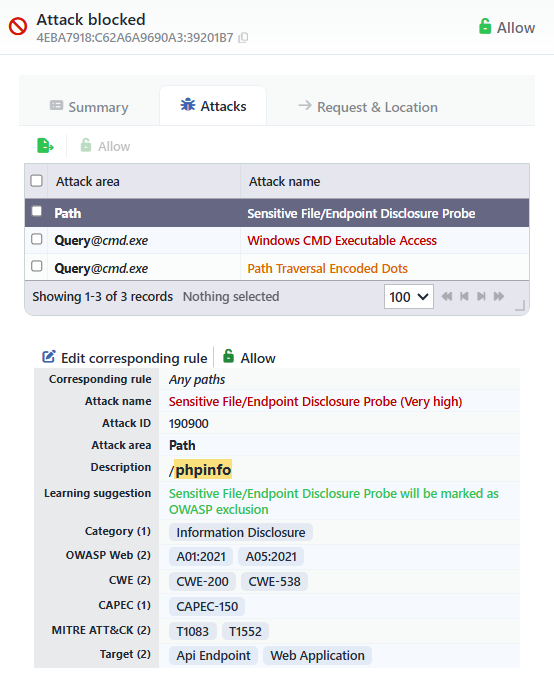 The Preview - The Attacks Tab
The attacks in the log are listed in the table at the top with two columns: Attack Area shows in which section of the request the attack was caught (the path, the query, the header, the form, JSON, XML or the raw body), and Attack Name the name of the triggered signature. If the attack was caught on a parameter, the @parameter suffix comes next to the field name.
The attacks for which no change remains to be made in the rule set are written in green, and the open ones in the color of their own severity. The green color does not only tell that it has been taught: the cases in which a suggestion cannot be produced for the signature fall into the same color as well. In the focused row the color is not applied.
When the tab is opened, the first attack is selected automatically. The Allow or Teach button above the table teaches the attacks checked with the boxes at the beginning of the rows; when no row is checked, it is passive. If the checking covers all the attacks, the operation gives the same result as teaching the whole of the log.
Below the table the details of the selected attack are listed in order:
| Information | Description |
|---|---|
| Corresponding Rule | The page type rule the attack has matched. In the requests that match no pattern the default Any Paths rule is displayed. If the matching inspection field is bound to a parameter, the name of the parameter is written below the rule as well. |
| Attack Name | The name of the triggered signature and, in parentheses, the severity (e.g. GCP Credentials File Access (Very high)). If no change remains to be made in the rule set, it is written in green. |
| Attack ID | The identity number of the signature. It is searched with this number on the Signature & Rule Library screen. |
| Attack Area | The inspection field in which the attack was caught; in the attacks caught on a parameter the @parameter suffix comes next to the field name. |
| Argument | The name of the parameter on which the attack was caught. It is displayed only in the field-based catches. |
| Description | The section within the request that matches the signature. The matching part is shown by being highlighted; if the detailed log is off, Detailed log disabled is written instead. |
| Learning Suggestion | It reports beforehand what the teaching operation will do: the signature being taken into the OWASP exclusion, an adding to or removing from a list, the rule being updated, the inspection being turned off or the address being added to the blacklist exclusion. If no change remains to be made, Already learned is written. Below the row, information badges that report that a new rule or a new inspection field will be formed may also be seen. |
| Category | The attack category counterparts of the selected attack. |
| OWASP Web | The counterparts of the selected attack in the OWASP Top 10 Web list. |
| OWASP API | The counterparts of the selected attack in the OWASP Top 10 API list. |
| CWE | The CWE weakness codes of the selected attack. |
| CAPEC | The CAPEC attack pattern codes of the selected attack. |
| MITRE ATT&CK | The MITRE ATT&CK technique codes of the selected attack. |
| Target | The technologies or components the selected attack targets. |
The number next to every title gives how many values there are in that field. These seven taxonomy rows explain only the selected attack; the rows with the same names in the Summary tab, on the other hand, summarize the whole of the log. The titles that carry no value are not listed here either.
Above the detail block there are two buttons:
INFO
Edit Corresponding Rule
It opens the editing form of the rule the attack has matched; the correction is made directly over the rule instead of the teaching. The form opens to the same host group and rule as the rule written in the Corresponding Rule row.
Which form will open depends on the field in which the attack was caught. If the attack was caught on the path, the own editing form of the rule opens, and if it was caught in the other fields, the inspection field form belonging to that field. If there is no definition yet for that field in the rule, the add form opens with the field of the attack selected beforehand; the parameter of the attack is not carried into the form, the form comes so as to cover all the parameters.
In the attacks for which a teaching suggestion cannot be produced, the button is passive.
INFO
Allow / Teach
It teaches only the selected attack; it does not touch the other attacks in the same log. The name of the button becomes Allow or Teach according to the decision of the log, just as in the button in the window title.
If the teaching will produce no change, the button is passive. In this case the Learning Suggestion row writes Already learned: the attack has already been taught or there is no corresponding change in the rule set.
Request & Location Tab
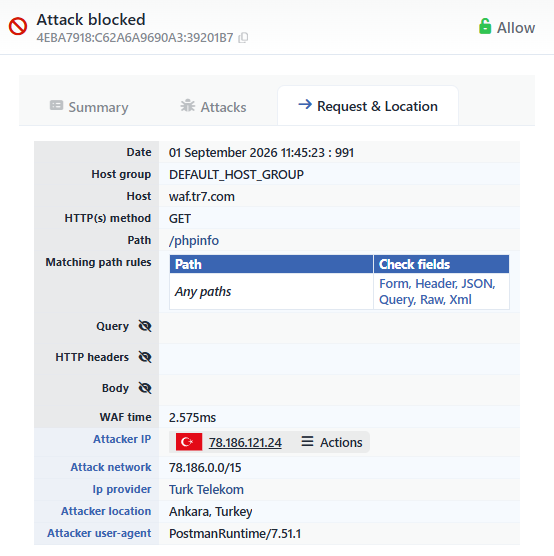 The Preview - The Request & Location Tab
It shows the request itself and the identity of the attacker. The fields, in order:
| Information | Description |
|---|---|
| Date | The date and time at which the request was processed (with the millisecond information). |
| Host Group | The Virtual Host Groups group the request falls to according to its Host header. The rule set and the working mode come from this group. |
| Host | The Host header in the request. |
| HTTP(s) Method | The HTTP method of the request. |
| Path | The requested address. The full value is displayed in the tooltip. |
| Matching Path Rules | The page type rules the request has matched; in every row there are the path pattern of the rule and the inspection fields (Check Fields) defined in that rule. If there is no match, the row is not listed. |
| Query | The query parameters of the request, in a form parsed as name and value. It is hidden by default. |
| HTTP Headers | The headers of the request, as a name and value list. It is hidden by default. |
| Body | The request body. It is listed only if the body has been recorded and is hidden by default. The body is written into the log only up to 2 KB; the bigger bodies are not recorded at all. |
| WAF Time | The time the WAF inspection has spent for this request. |
| Monitor Mode | It is displayed if the request has been evaluated in the Monitor mode; in the other cases it is not listed. |
| Teacher | It is displayed if the request has been recognized by the teacher; in the other cases it is not listed. |
| Attacker IP | The source address. From the Actions menu next to it the blacklist or whitelist operations are done. |
| Attack Network | The network block the source address belongs to (e.g. 34.80.0.0/12). |
| Ip Provider | The organization that operates the network block (e.g. Google LLC). The network information is displayed in the tooltip. |
| Attacker Location | The geographic location of the source address (the city and the country). In the addresses that come from the local network, the local network information is written instead of the location. |
| Attacker User-Agent | The browser, device type and operating system information of the client that sent the request. In the clients that cannot be parsed, the raw User-Agent value is written. |
The last five fields are displayed in a separate color because they speak not of the request itself but of the identity of the attacker.
The Query, HTTP Headers and Body fields are hidden by default; every one of them is opened with the eye icon in its title. Some of the fields that carry no value are not listed at all (Matching Path Rules, Query, HTTP Headers, Body, Monitor Mode, Teacher); the remaining fields are displayed with - when they are empty.
The operations over the source address
The Attacker IP field in this tab carries the same Actions menu as the one in the Summary tab: the address is taken into the blacklist or the whitelist only for this vService or for the IP Intelligence & Reputation lists across the device. Its detail is in the The Actions menu on the Attacker IP section.
Reverting the Teaching
There is no operation that reverts the teaching on the Event Logs screen. Every teaching done with Allow / Teach is written into the operation record of the vService as a learning record whose source is WAF logs, and the reverting is done over this record. For this, the Dashboard or WAF Management tab is switched to on the vService screen; on the Log tab of the WAF - WAAP Data Flow Panel on the right, the Revert Learning button below the related record is clicked. The panel is not displayed on the Event Logs tab.
For the steps, the notes in the confirmation window and the authorization conditions, see Reverting the Learning.
Scope and Limits
INFO
- The screen does not refresh by itself. The list is pulled at the opening, with Refresh and when the server filter is changed; there is no automatic time-based refresh. When the tab is changed, the pulled logs and the filter state are preserved, and when the vService is changed, they are reset.
- The row limit and the cluster. Line Limit limits the number of logs that will return from the server. In a cluster setup, since the logs of the two devices are combined, the number of rows displayed in the list may go above this value. Since the logs are kept separately on the two devices, when one device cannot be reached, only the logs of the other are listed.
- The authorization. Opening the screen requires the WAF authorization. The global screen is closed to the users whose authorization is limited to certain vServices. The teaching operation additionally requires the change authorization and a confirmation is asked at every call.
