
Smarter by Design.Simpler for Business
Bot/DDoS Protected vService List
What Is Bot/DDoS Protected vService List?
Bot/DDoS Protected vService List is the management page on which all the vServices whose Bot/DDoS protection is enabled on the device are listed on a single screen. In every row the working state of the vService, its type, whether the WAF protection is on or not, its name and the addresses it listens on are displayed.
The screen is at the same time the place where the Bot/DDoS protection is turned on and off in bulk: by selecting one or more vServices, the protection is started or removed. In this way the protection state of dozens of vServices is managed from a single list.
Only the vServices whose Bot/DDoS protection is on are located in the list. Unlike the WAF list, there is no type restriction here: since the protection works on both HTTP and L7 TCP vServices, both of them appear in the same list.
The Network (Layer 4) vServices do not enter the scope of the protection
The protection starting list does not filter the vService type; a vService of the Network (Layer 4) type can also be selected and, when it is selected, it starts to appear in the list. On the other hand, since this type works on a separate data plane, the Bot/DDoS protection is not applied at all on that vService: the protection appears on, its diagram is even displayed in the preview, but no check works on the traffic. The Bot/DDoS protection is meaningful only on the HTTP and L7 TCP types.
How to Access?
The Bot/DDoS protected vService list is reached over the TR7 web management interface with the steps below:
- The Configuration Menu is opened by clicking the TR7 logo at the bottom left.
- The Bot/DDoS → Bot/DDoS Protected vService List steps are followed.
- All the vServices whose Bot/DDoS protection is enabled on the device are listed.
TIP
Reaching the page via quick search
Instead of navigating the menu step by step, the related page is reached directly by using the search bar in the bottom left corner of the screen. The search bar opens with the Alt + T shortcut on Windows and Opt + T on macOS; typing the name of the feature being searched for is then sufficient.
vService Listing Screen
By following the Bot/DDoS → Bot/DDoS Protected vService List path, the list of all the vServices whose Bot/DDoS protection is enabled on the TR7 device is reached. The operations of starting and removing the Bot/DDoS protection on the vServices are made over this screen.
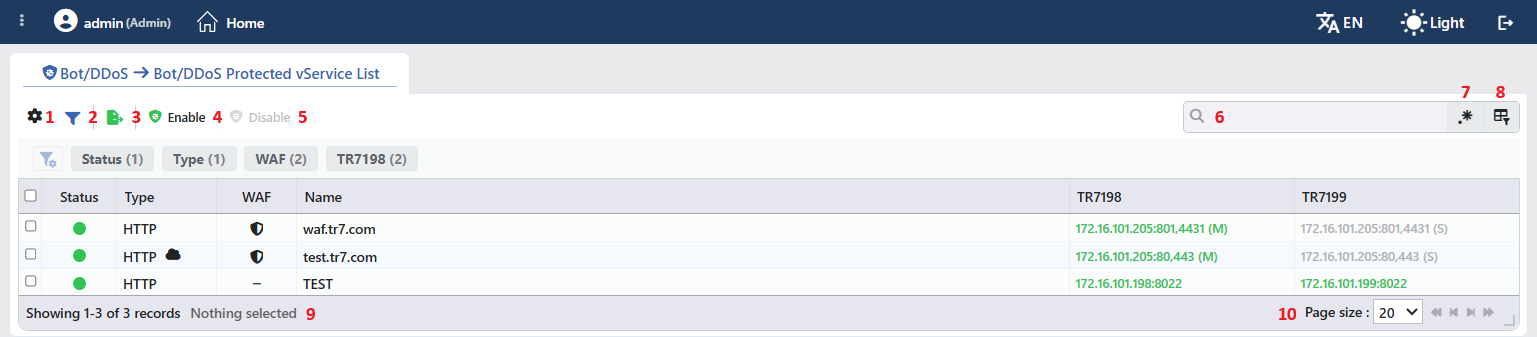 The vService Listing Screen
The table opens with the following columns by default:
| Column | Description |
|---|---|
| Status | The working state of the vService, with a colored circle; the meaning of the colors is on the vService page. In a cluster installation the circle is divided into two colors: the left half shows the state of the own device and the right half that of the peer device. It is not included in the search; filtering according to the state information is made with Filter. |
| Type | The vService type. The vServices of the L7 TCP type appear as TCP in this column; on the Left Monitor Panel the same vService writes L7 TCP. If there is a cloud symbol next to the value, Virtual Hosting is defined on that vService; when the symbol is hovered over, the host names defined are displayed. |
| WAF | Whether the WAF protection is also on on the vService or not. If it is on, the shield symbol and if it is off — is displayed; in the export, instead of the symbol, Enabled / Disabled is written. It is not included in the search. |
| Name | The name of the vService. |
| IP | The addresses and the ports that the vService listens on. In a cluster installation it is divided into two separate columns. |
If a cloud client is defined on the device and the user has the permission to see it, the Client column that shows the client to which the vService belongs is added to the beginning of the list; this column is hidden by default and is turned on from the column selector. The rows that belong to a cloud client are written in italics and their background is toned.
The ports under the same IP are gathered in a single cell; if there are more than two ports, the rest are shortened with .... With the copy symbol in the cell, the address is taken to the clipboard; on HTTP vServices the address is copied together with its scheme (http://, and https:// on the addresses that terminate TLS).
In a cluster installation the addresses are shown in two separate columns; every column heading reflects the name of the related device (Server Name / Hostname). On the Cluster IP (VIP) addresses the (M) Master and (S) Slave labels are displayed; the same VIP is read as (M) in one column and (S) in the other. The color of the label is not the ownership but the working state of that address on the related device; the details are located in the Interfaces List › Interface and IP Statuses section.
The items in the toolbar are arranged from left to right in the following order; the last two items (Page Information and Page Size) are located in the information strip below the table.
Columns
Which columns are shown in the table is selected. In the same panel, columns are reordered by dragging and alignment is selected per column; the row height is fitted to the page with the Fit rows to the page button, and the column layout is reset to default with the Reset button. The layout is stored per user and is common to all the vService lists: a column hidden here also comes hidden in the Load Balancer vService list of the same user.
Filter
The Filter button is used to filter the vServices shown in the list according to certain criteria. In this list four filter groups are offered: Status, Type, WAF and the filter of the address column (in a cluster it carries the name of the device). In every group the options are listed together with the number of rows that have that value. The selections in the same group are combined with an or relationship and the selections in different groups with an and relationship; the counters of every group are also recalculated according to the active selections of the other groups.
The number in parentheses in the group title is the number of options in that group: Type (1) says that all the vServices in the list are of the same type, and WAF (2) that there are both rows whose WAF protection is on and rows whose WAF protection is off.
The filtering view can be customized: which filters will be shown is selected, the order of the filters is changed and the view is arranged according to the need.
The active filters are displayed as labels below the toolbar; with the closing symbol next to every label, that filter is removed one by one. The total effect of the filtering, on the other hand, is written in the information row below the table as the number of filters applied and the number of rows shown/total.
Export
The table is exported as Excel, CSV or PDF by clicking the Export Table button. In the window that opens, the Filename, Format and Data Source, together with the Columns to be exported, are determined; the remaining fields are displayed according to the format: CSV Separator for CSV, Excel Sheet Name for Excel, and Page Orientation and Page Size for PDF. Data Source has three options: all the filtered and sorted data, all the filtered data or only the page displayed.
Enable
When the Enable button is clicked, a new tab titled Add opens next to the list. The vServices on which the protection will be started are selected from the vServices to protect with Bot/DDoS field and confirmed with the Add button. The vServices selected are taken under protection and start to appear in the list.
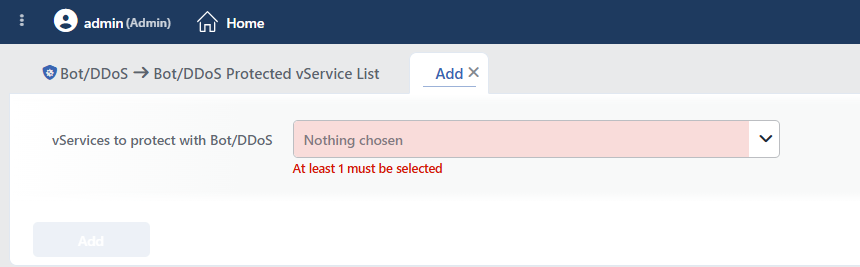 Enable
When no selection is made, the field writes Nothing chosen; the moment the tab opens, the warning At least 1 must be selected is displayed below the field and the Add button stays passive until at least one vService is selected. The tab is closed with the closing symbol in its title.
The button is independent of the selection in the list: it works without a row being selected and does not use the selected rows. The field that opens lists only the vServices that do not have protection.
The operation only turns the protection mark on the vService; the default configuration is created in the configuration production pass that this triggers. The result opens with the following settings:
| Setting | HTTP vService | L7 TCP vService |
|---|---|---|
| L7 DDoS Protection | Monitor | Monitor |
| IP Reputation Protection | Active | Active |
| Bot Protection | Monitor | Off |
| Smart Advisor | In the recommendation mode; the recommendations are evaluated again every hour | the same |
| The action rules | Two default rules each for IP Reputation and Bot Protection | The same rules; in Bot Protection the blocking is turned into the quarantine and the challenge into silent dropping, and in IP Reputation only the blocking is turned into silent dropping. Since Bot Protection comes off, its own rules do not work. |
| The limit blocks | All of the eight blocks are on; the six measurement blocks come with their default limits and the two geo control blocks with an empty rule list | The three blocks specific to HTTP are not present |
| The exemption | Undefined in all three protections | the same |
WARNING
On a vService that is newly taken under protection, IP Reputation Protection applies enforcement directly: unlike the other two protections its default is Active and its default rules take the attacker categories into quarantine, block the remaining categories with 403 on HTTP vServices and drop them silently on L7 TCP vServices. Before the protection is turned on, whether this behavior is expected or not must be evaluated.
Disable
When one or more vServices are selected and the Disable button is clicked, the Bot/DDoS protection of the related vServices is removed. The button is passive when no selection is made in the list.
The "selection" here is the selection made with the checkboxes at the beginning of the rows; clicking a row and opening its preview does not make the button active. The bulk selection box in the column heading, on the other hand, selects all the rows filtered at that moment, including the ones on the other pages.
The same operation is also made for a single vService with Remove Bot/DDoS Protection in the right-click menu.
WARNING
The Disable operation does not show a confirmation window; the moment it is clicked, the protection of all the selected vServices is removed and the traffic starts not to pass through the Bot/DDoS check. The same applies to Remove Bot/DDoS Protection in the right-click menu. For this reason the selection must be verified before the button is clicked.
When the protection is removed, the Bot/DDoS configuration of the vService (the protection modes, the rule lists, the factor selection, the exemptions) is not deleted; when the protection is turned on again, the same configuration becomes valid. The configuration is lost only when the vService itself is deleted.
The Enable and Disable operations are not only a mark change: the configuration of the related vService is regenerated and applied. In a cluster installation the change is also propagated to the peer device. There is no upper limit for the number of vServices selected; the operation is applied at once.
Search
Used to search the information in the table. The search works over the values seen on the screen and without regard to upper/lower case; the hidden columns do not enter the scope of the search. The Status and WAF columns are also not included in the search; filtering according to these two pieces of information is made from the Filter window.
RegExp Search
Used to search all information in the table with a regular expression (RegExp).
Column Based Search
Used to perform a column-based search on the information in the table. The search box of the columns that are closed to the search comes passive.
Page Information
Contains information about the number of vServices displayed in the list: Showing N-M of T records and the number of selected vServices (N selected, or Nothing selected when there is no selection). While a search or a filter is active, the total number shows not all the vServices whose Bot/DDoS protection is enabled but the rows that remain after the filtering.
Page Size
The maximum number of vServices to be displayed on the page is selected. The default is 20; the options are 5, 10, 20, 50, 100, 200, 500 and All.
Right-Click Menu
When a row is right-clicked, a menu with two operations whose title carries the name of the vService opens. The operations apply only to the right-clicked vService; a selection made in the list does not affect the menu.
| Operation | What it does |
|---|---|
| Edit | Opens the Bot/DDoS Management tab of the vService; it is the same as the Edit icon in the preview title. |
| Remove Bot/DDoS Protection | Removes the Bot/DDoS protection of the vService; like Disable in the toolbar, it does not ask for confirmation. It does not touch the vService itself and its configuration. |
The Delete, Enable, Disable and Reload operations in the Load Balancer vService list are not present in this menu.
Preview of the Selected vService
When a row in the list is clicked, the preview of the vService opens on the right of the screen; when the row is clicked again, the selection is removed. In the title the state color of the vService, its name and the vService subtitle, and at the top right two operations are located. Clicking a row on its own does not pass to another screen.
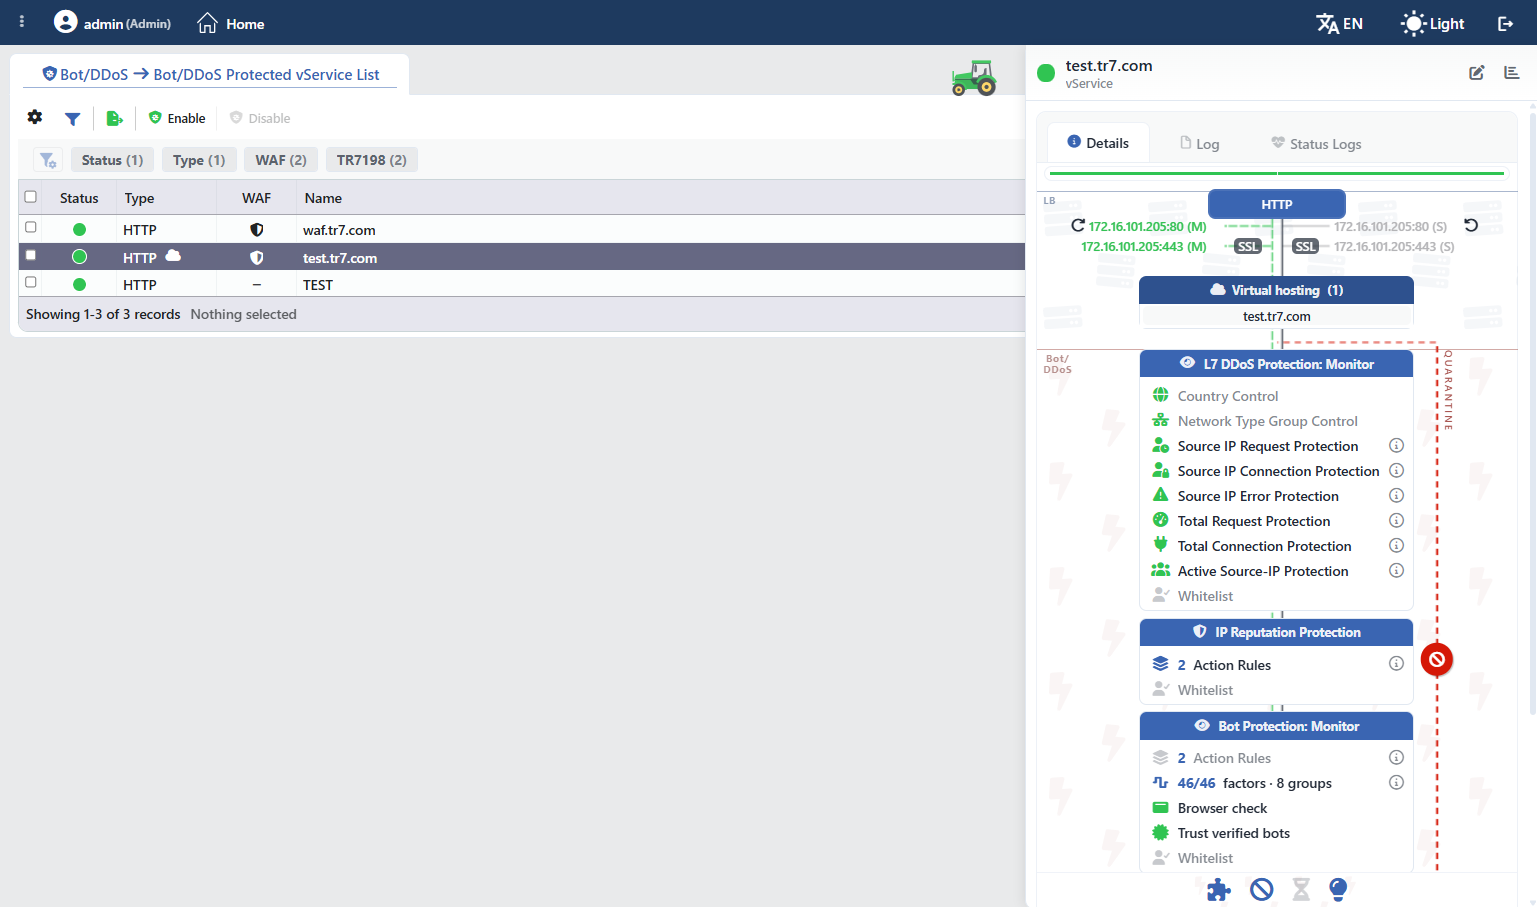 The Preview of the Selected vService
| Operation | What it does |
|---|---|
| Edit | Opens the Bot/DDoS Management tab of the vService. It is displayed only on the users that have change permission in the Load Balancer area. |
| Dashboard | Opens the Bot/DDoS Dashboard screen of the vService. |
There are three tabs in the panel:
Details
Shows the Bot/DDoS configuration of the vService as a diagram on the path that the request follows.
Log
Lists all the operations made on the vService in the past; the Bot/DDoS setting changes also fall into this list.
Status Logs
Lists the state transition history of the vService (on which date it passed to which state).
The Details Diagram
The diagram consists of two bands and summarizes the path from the entry point of the request to the Bot/DDoS decision point. The Backend Services are not located in this view.
| Band | Its content |
|---|---|
| LB | The vService type, the addresses and ports listened on, the SSL badge on the addresses that terminate TLS, and, if it is defined, the Virtual Hosting node and the host names. |
| Bot/DDoS | The boxes of the three protections, in the evaluation order: L7 DDoS Protection → IP Reputation Protection → Bot Protection. If it is defined, the waiting room node is also displayed at the entrance. |
In the title of every protection box the name of the protection and the icon of the mode are located; when the icon is hovered over, the name of the mode is displayed. The name of the mode is added to the title only in the modes other than Active: : Monitor is written in the monitoring mode and : Off while it is off. A protection in the Off mode also fades and its rows are not displayed at all.
The rows inside the boxes change according to the protection:
| Box | Its rows |
|---|---|
| L7 DDoS Protection | The six limit blocks and the two geo control blocks, in the order on the card (on an L7 TCP vService the three blocks specific to HTTP are not located there); then (if they are on) the trust in the verified bots and the exemption row. |
| IP Reputation Protection | The action rules and the exemption row. |
| Bot Protection | The action rules, the factor counter in the form 46/46 factors · 8 groups, (if they are on) the browser check and the trust in the verified bots, and the exemption row. Since in the default configuration the last two also come on, these rows are displayed from the beginning on an HTTP vService. |
The value field on the right of the rows shows only a count: the number of rules, the number of exemption rows or the ratio of the open factors to the total. In the rows that do not have a counter, this field stays empty. The limits, the time windows and the actions are written not in the row but with full sentences in the window that opens when the information symbol next to the row is clicked.
The color of the row does not say the mode of the protection
The icon of a block row being in a live color says only that the own switch of that block is on; for the row to appear live as a whole, the block must also have been configured. In the case that the protection is in the Monitor mode, no enforcement is applied. The enforcement information is only in the mode icon in the box title and in the : Monitor addition. The action rules row, on the contrary, behaves the other way round and is deliberately shown faded in the monitoring mode.
Below the protection boxes there is a node at which the decision combines in a single outcome; the lines that come out of the node show the outcomes that the configuration really uses: blocking, monitoring, the challenge, the quarantine and the traffic that comes out of the check clean. If all three of the protections are in the same mode, the icon and the name of that mode are also written below the label of the band; since in the default configuration the modes are different, this badge is not seen.
The vertical QUARANTINE strip on the right of the diagram shows that there is a line in the configuration that uses the quarantine action. The strip tells the "memory" of the quarantine: the next request of a source that has been stamped is stopped right at the entrance without entering the protections at all. In the default configuration this strip is seen, because IP Reputation Protection is active from birth and its first rule is the quarantine.
The four symbols below the diagram show the state of the surfaces that the protections use in common; they are not a part of the traffic path and, when they are clicked, they open the summary of the related surface:
| Symbol | Surface | When it appears active |
|---|---|---|
| Captcha | If the challenge action is used in the rules of a protection that is not off. | |
| Quarantine | If the quarantine action is used in the rules of a protection that is not off; the hard ceiling of the source IP blocks and the challenge failure trigger are also in this scope. | |
| Waiting Room | If the waiting room is defined. | |
| Smart Advisor | If the learning is not off; in the default configuration it is always active. |
Since the challenge and the waiting room are not present on L7 TCP vServices, the first and the third symbol are not displayed.
The activity criterion of these symbols is different from that of the QUARANTINE strip on the right: the symbols also count the rules of a protection in the monitoring mode, and the strip counts only the protections that apply enforcement. For this reason there can be situations in which the quarantine symbol appears active while the strip is not displayed.
The diagram is read-only on this screen
The same diagram is also present on the Bot/DDoS Dashboard screen, but there it can be edited: with the gear symbols in the box titles and the pencil symbols in the rows, the settings are opened directly. In the list preview these symbols are not displayed at all; it is only read from here.
Scope and Limits
INFO
- The screen is opened to the users that have Load Balancer permission; there is no separate Bot/DDoS permission area. On a user that does not have the permission, the menu tab is not seen.
- Turning the protection on and off requires change permission in the Load Balancer area. A user that has only read permission sees the list and also sees the Enable and Disable buttons as active; however the operation is rejected on the server.
- An account whose vService scope is limited sees only the vServices defined for itself in the list and in the protection starting field.
- The operations of turning the protection on and removing it do not write a separate record to the user log; the trace of the change stays in the configuration itself and in the log timeline of the vService.
- The list is updated by itself as the configuration changes; a separate refresh step is not needed. When the protection mode or the rule list of a vService is changed on another screen, the preview diagram shows the new value instantly.
