
Smarter by Design.Simpler for Business
Memory
What Is Memory?
Memory is the view tab that gathers the memory state of the device on a single screen on the TR7 home page. The tab consists of three panels: the gauge that shows the memory usage rate, the distribution chart that gives the application, cache, buffer and free memory breakdown of the memory and the occupancy rate of the swap area.
The panels read the own memory of the device; they do not make a vService, WAF profile or DNS service distinction. For this reason the All vServices or vService Distribution upper row does not take place in the title of any panel in the tab. The memory consumption of a single service is monitored not in this tab but on the own dashboard of that service.
The display of the tab depends on the Settings permission and all of the three panels are in the same permission area. There is no conditional panel in the tab: the three panels are laid out on every device, both on a virtual machine and on a physical device.
3
Panel
The tab does not have a subtab; there is no conditional panel in the tab
Settings
Required Permission
The tab and all of the three panels are bound to the same permission
Device-Wide
Scope
The panels read the memory of the device; they do not offer a breakdown per service
15 s
Recording Step
The memory counters are stored in fifteen-second steps
Access to the Memory Tab
- The Home shortcut on the left of the Header Bar is clicked.
- Memory is selected from the view tabs.
The tab does not have a subtab, so the second row of the tab bar is not displayed. For the Header Bar shortcuts, see Header Bar.
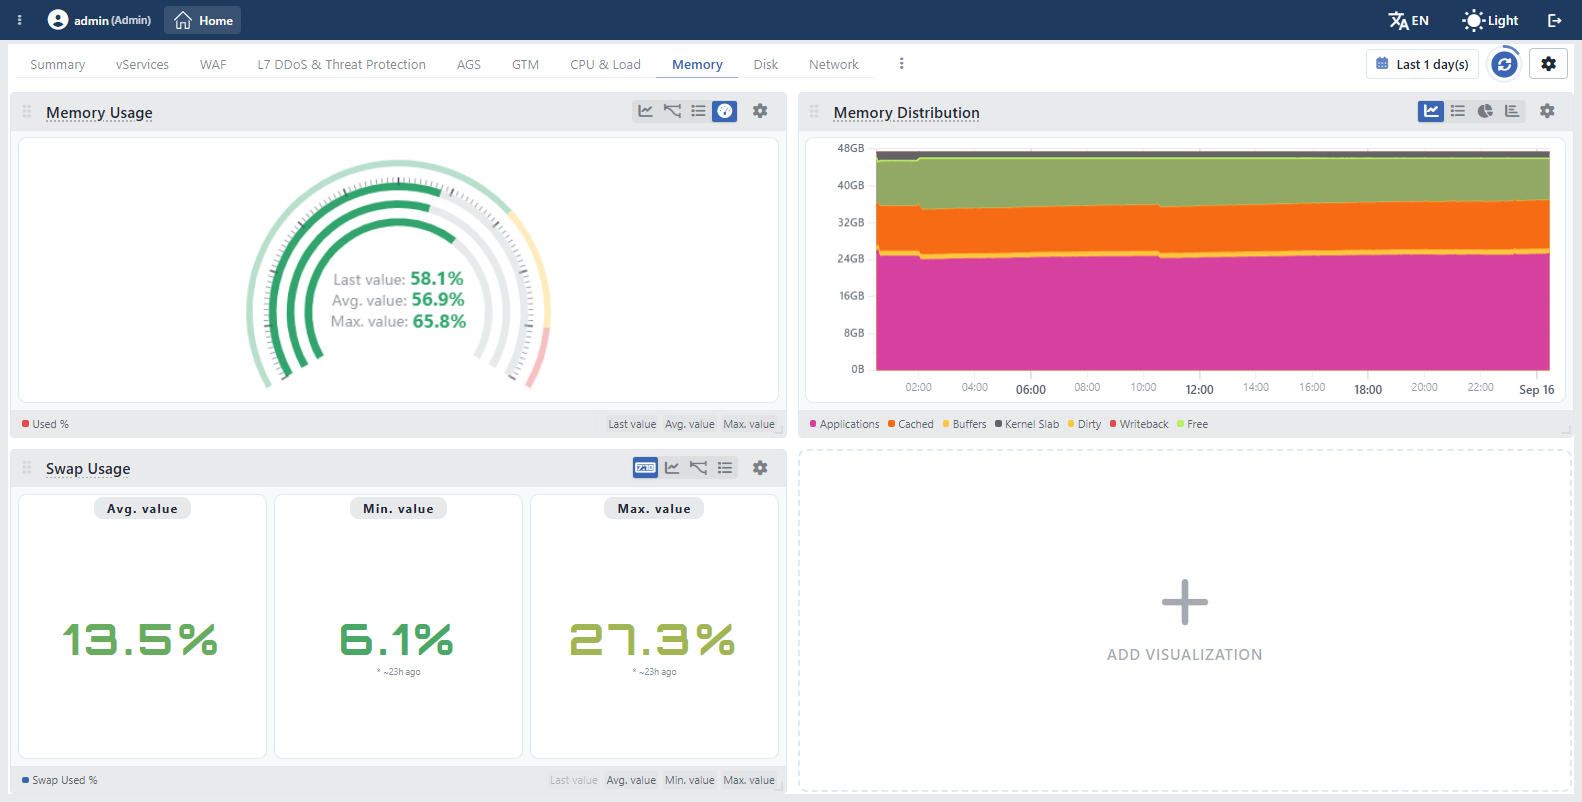 The Memory Tab
The screen controls are common to all the tabs
The time range selector, the refresh, the settings, the template menu and the arrangement of the panels are the same in all the view tabs of the home page; for the detail, see Screen Controls.
Panels
There are 3 panels in the Memory tab and their order is in the Memory Usage, Memory Distribution, Swap Usage form. The tab and all of the panels are bound to the Settings permission; in a user who does not have this permission the tab does not take place among the view tabs at all. There is no conditional panel in the tab; all three panels are always laid out.
All three of the panels are one card in size. The card width changes according to the screen width: as many columns as the number of cards that fit side by side are opened and the cards fill the column. On a screen on which two cards fit side by side, Memory Usage and Memory Distribution are laid out in the upper row and Swap Usage in the lower row.
The Add Visualization menu offers the same three panels on this tab; there is no other memory panel that can be added to the tab. A panel selected from the menu can be added a second time even if it is already present in the layout.
The other panels related to the memory are present on the other tabs of the home page or on the service dashboards and cannot be added to this tab. The vService Distribution table for vService Memory Usage is added from the Add Visualization menu of the vServices tab, and the same table for AGS Storage Memory from the menu of the Summary tab. For the memory usage of a single vService the vService Memory Usage panel, for the AGS session store the AGS Storage Memory panel and for the memory of a DNS service the DNS Memory panel is used. The amount of memory installed on the device, on the other hand, takes place as the Memory info row in the Device info panel in the Summary tab.
Memory Usage
Shows the usage rate of the device memory (the Used % series). The rate is calculated by the memory that can still be given to the applications being subtracted from the total memory; the reclaimable cache and buffers are not included in the used memory. For this reason the value is lower than the amount of memory the operating system keeps full at that moment and shows the real memory pressure.
In the gauge, Last value, Avg. value and Max. value take place as three nested rings and their values are written in the middle of the gauge; all three of them are open by default. Min. value is not offered in this view at all; the lowest value is read from the Line Chart or the Stat Table view. The scale is fixed between 0 and 100. The thin ring on the outside shows the threshold bands: green up to 70%, yellow between 70% and 90%, red at 90% and above. The color of the value does not pass gradually, whichever threshold has been exceeded, the color of that threshold is used.
In the panel, the Line Chart, Mini Chart, Stat Table and Arc Gauge views are offered. In the line view only the Avg. value box comes open; Last value, Min. value and Max. value are opened from the strip under the panel. In the same view, with the MIN/MAX badge at the beginning of the legend, the lowest and highest value band is added behind the average. In the table view all four of the summary columns come open. In the cluster setups the value of the two devices is not summed and not averaged; a separate gauge is laid out for every device.
The same panel takes place in the Summary tab as well and its thresholds are exactly the same; see Memory Usage. The Memory widget in the Header Bar also reads the last value of this panel.
Memory Distribution
Shows where the device memory goes as seven series. The series are shown stacked and the ceiling of the Y axis is determined according to the amount of memory installed on the device; the values are written with byte units such as 48GB, 24GB.
| Series | Meaning |
|---|---|
| Applications | The memory the applications use. It is calculated by the free memory, the cache, the buffers and the internal tables of the system being subtracted from the total memory. |
| Cached | The memory that is kept to speed up the re-reading of the file contents and that can be reclaimed when needed. |
| Buffers | The memory allocated temporarily for the storage operations, which can be reclaimed. |
| Kernel Slab | The memory the system allocates for its own internal tables. |
| Dirty | The data that has been changed and has not been written to the storage yet. |
| Writeback | The data that is being written to the storage at that moment. |
| Free | The memory that is not used for any purpose. |
The Dirty and Writeback series are not a section separate from the other series: the data counted in these two series also takes place inside the Cached and Applications series. Since both of them stay very small under ordinary conditions, the top of the stacked view stays close to the total memory of the device, but during an intense writing it can exceed the ceiling somewhat.
In the panel, the Line Chart, Stat Table, Pie Chart and Bar Chart views are offered. Since the panel carries seven series, the summary box does not open in the line view; the summary values are read from the table view. Since the series are shown stacked, the MIN/MAX badge is not offered either: in a stacked chart the band would be misleading, because the sum of the highest values of the series is not equal to the highest value of the total. In the table view all four of the summary columns (Last value, Avg. value, Min. value, Max. value) come open; in the pie and bar views only Avg. value comes open.
In the cluster setups the combining changes according to the view: in the line and pie views the series of the two devices are summed and the ceiling of the Y axis becomes the total memory of the two devices, and in the table and bar views the values of every device are shown separately.
Swap Usage
Shows the occupancy rate of the swap area (the Swap Used % series): the ratio of the swap area used to the total swap area. The swap area starting to be used is the first indicator of the memory pressure; for this reason the thresholds of the panel are lower than the Memory Usage panel: green up to 50%, yellow between 50% and 80%, red at 80% and above. The values printed are colored according to these thresholds and the color passes gradually between the thresholds.
As a summary, Avg. value, Min. value and Max. value are printed in three separate sections; Last value comes closed and is opened from the strip under the panel. Below the Min. value and Max. value sections, when the value was seen is written relatively such as ~23h ago, and when it is hovered over the full time stamp is displayed.
In the panel, the Digital, Line Chart, Mini Chart and Stat Table views are offered. In the line view the MIN/MAX badge is offered. In the cluster setups the value of every device is shown separately.
If a swap area is not defined, the rate is recorded as zero
If a swap area has not been allocated on the device, the rate cannot be calculated and is recorded as zero. The panel does not stay empty in this case, it constantly shows 0%; this value may mean that the swap area is not used as well as that it is not defined.
Scope and Limits
INFO
- The tab is displayed only with the Settings permission. All of the three panels are bound to the same permission; in a user who does not have the permission the tab does not take place among the view tabs at all.
- The panels read the device memory, they do not make a service distinction. The memory consumption of a vService, of the AGS session store or of a DNS service is not separated in this tab; for this the own dashboard of the related service is used.
- There is no conditional panel in the tab. The three panels are laid out on every device and the Add Visualization menu offers the same three panels as well; there is no other memory panel that can be added to this tab.
- The percentage and the distribution do not use the same division. The Memory Usage rate subtracts the reclaimable cache and buffers from the used memory; Memory Distribution, on the other hand, shows the same caches as separate series. For this reason the ratio of the Applications series in the distribution to the total memory and the percentage in the gauge are not equal to each other.
- The combining in a cluster changes according to the panel. In the Memory Usage and Swap Usage panels the Arc Gauge, Digital, Line Chart and Stat Table views show the value of every device separately; in the Memory Distribution panel the line and pie views sum the series of the two devices and the table and bar views show them separately. For the values of a single device the source selection in the settings is used; the options are the names of the two devices and
Both devices. - The counters are read in two-second rounds and written into the fifteen-second archive. The memory counters are taken from the device once every two seconds, but are stored in fifteen-second steps; the memory jumps that last shorter than this interval are not seen as a separate point, they mix into the average of the step.
- The appearance of an empty panel changes according to the card type. If there is no value in the selected time range,
No-datais displayed in the Arc Gauge, Pie Chart and Bar Chart views andNo datain the Digital view; if a measurement has never been recorded, the textNo data recorded for the selected time range.is printed inside the card. - The fine-resolution history is three days. The fifteen-second resolution goes three days back, the per-minute resolution 14 days, the five-minute resolution 60 days and the quarter-hour resolution 180 days; the older ranges are stored with the hourly, six-hour and daily resolution for up to 10 years. Since the highest and lowest value archives are kept as well, in the wide ranges the MIN/MAX band shows the jumps the average hides.
- There is no passing to another screen from the cards. Clicking a series in the panels only hides or shows that series; another screen is not opened.
