
Smarter by Design.Simpler for Business
Health Checks
What Are Health Checks?
Health Checks are the result records of the health check assigned to a Backend Service or Backend Group. Each record represents the result of the check at a specific moment and contains the status of the result (OK, Error), the check type, the measured response time and, if any, the error text.
Health Checks records are the history that answers the questions "when did the service go down, why did it go down and when did it come back?" for a Backend Service or for the servers of a group. While the instantaneous status in the preview panel shows only the last result, these records keep the status transitions and error texts in chronological order; they are the first source consulted to examine intermittent disconnections, timeouts and response time changes retroactively.
The records are stored permanently on TR7 and all of them are viewed from the web interface: without the need for an SSH connection, file access or command knowledge, they are opened with a single click from the Backend Service or group preview, filtered by date range, searched and exported as Excel, CSV or PDF.
Status Record
Transitions are stored
A record is written when the status, error or result information changes
5 min
Periodic row
Even without a change, one result is recorded per 5-minute slot
Summary
Result on a single line
Check type, response time and error text together
Web UI
Single-click access
No SSH or file access required; records are monitored from the interface
Group
Members in a single list
In a Backend Group, the record of each server is kept separately and listed together
Permanent
History is not deleted
Records are stored permanently on the TR7 disk and can be exported
Health Checks records complement the Health Check tab on the Backend Services Dashboard and Backend Groups Dashboard screens: Dashboard shows the status and response time as charts on the time axis, while these records show each result row by row together with its error text. The check itself (type, interval, thresholds) is defined in the Health Checks profile.
Supported Check Types
Records are written regardless of the type of the health check profile assigned to the Backend Service or group:
TCP / TCPS
UDP
Ping
HTTP / HTTPS
DNS
FTP / FTPS
LDAP / LDAPS
SMTP / SMTPS
Oracle
Scenario
How Are Health Check Logs Enabled?
Records are produced when a Health Check profile is assigned to the Backend Service or Backend Group and while the Enable HC Logs setting is on. Enable HC Logs is on by default and is displayed in the Backend Service and group forms only when a health check profile is selected. In a group, the setting is at the group level and applies to all servers in the group.
1
Step 1 The Backend Service or group edit form is opened
The edit form of the related Backend Service is opened by following the Load Balancer → Backend Services path, and that of the related group by following the Load Balancer → Backend Groups path.
2
Step 2 The health check profile is selected
The Health Checks profile to be applied is selected in the Health Check field, and it is verified that the Enable HC Logs setting is on.
3
Step 3 The change is saved
When the form is saved, records start to be written for the health check results.
When records are written
A record is not written every time the health check runs. In a Backend Group, the group's health check profile is applied to each server separately; the rules below work separately for each server's own results. A result is recorded if it carries at least one of the following events compared to the previous result:
| Event | Description |
|---|---|
| Status change | The status of the result changed (e.g. OK → Error). |
| Error change | The type of the error returned by the check changed, or the error disappeared. A change in the detail of an error of the same type does not create a new record. |
| Information change | The additional information that comes with the result (e.g. HTTP status code, DNS answers) changed. |
| Periodic record | A new 5-minute slot (minutes :00, :05, :10… of the hour) started; even without a change, the first result of the slot is recorded. |
The Only Change Logs filter leaves out the periodic records and lists the records that carry at least one of the first three events; for this reason, it shows not only status transitions but also changes in the error text and result information. When the device is restarted, the first result is written as a change record because the previous result is not known.
Where records are kept
Records are kept on the TR7 disk in hourly files per Backend Service (in a group, separately for each server in the group); completed hour files are stored compressed. The records are permanent; they are not deleted automatically after a certain period, they are not within the scope of disk cleanup operations, and there is no retention period that needs to be set in the interface. In a cluster setup, each device writes its own check results to its own disk; during listing, the records of the two devices are fetched together.
While Enable HC Logs is off
When Enable HC Logs is turned off, the health check continues to run and the status and Dashboard charts continue to be updated; however, new results are not recorded, and the forwarding of health check records to external systems with Log Forwarding also stops. While the setting is on, only status changes are forwarded to Log Forwarding unless the Log All Health Checks option is on. The Health Checks tab in the preview remains visible and stays empty if there are no records in the selected range. The records written before the setting was turned off are preserved.
Viewing Health Check Logs
- Left Monitor Panel is opened.
- Backend Services for a Backend Service, or Backend Service Groups for a group, is selected from the category tabs at the top left.
- The Backend Services or groups defined on TR7 are listed.
- The Backend Service or group to be monitored is clicked; the screen opens with the Dashboard tab that carries its name (Backend Services Dashboard, Backend Groups Dashboard).
- The Health Checks tab is clicked in the preview panel on the right.
The same tab is also found in the preview panel that opens when a row is selected in the Backend Services and Backend Groups lists. The tab is displayed only if a health check profile is assigned to the Backend Service or group.
Health Checks Tab
The Health Checks tab lists the health check records of the Backend Service or group as a timeline from newest to oldest. When the tab is opened, the records are fetched automatically, and the Loading indicator is displayed while fetching is in progress; if the records cannot be retrieved, the Error message is shown. In a cluster setup, the records of the two devices are always listed together.
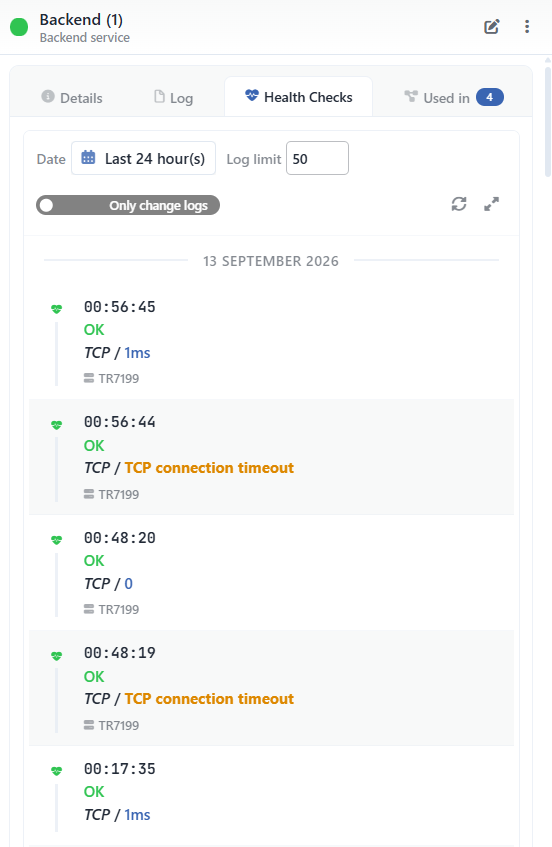 Health Checks Tab
The controls at the top of the tab:
| Control | Function |
|---|---|
| Date | The time range of the records to be listed; the default is Last 24 hour(s). |
| Log Limit | The maximum number of records to be fetched; the value must be greater than 0, and the default is 50. |
| Only Change Logs / All Logs | The switch shows the current selection: Only Change Logs lists only change records, and All Logs lists all records including periodic records. The default is Only Change Logs. When the switch is changed, the records are fetched again immediately. |
| Refresh | Fetches the records again; the button is inactive while fetching is in progress. This button is used to apply Date and Log Limit changes. |
| Enlarge | Opens the records as a table in the Health check logs for <Backend Service or group name> window (Health Check Logs Listing Screen). |
There is no automatic refresh in the tab. The Date, Only Change Logs selection and Log Limit are stored per user; the Date and Only Change Logs selection are shared with the enlarge window.
Records are separated by day headings (e.g. 13 SEPTEMBER 2026). Each record contains the following information from top to bottom:
| Information | Description |
|---|---|
| Time | The time the record was written, in the HH:mm:ss format. |
| Status | The status of the check result, in the status color (Status Values). The heart icon on the left is also shown in the same color. |
| Summary | The check type, the measured time and the error text, if any (Summary Text). |
| Device | The peer device name, showing that the record came from the cluster peer. The device name is not written in this device's own records. |
| Server | In a Backend Group, the ip:port label of the server the record belongs to, with a network icon. It is shown only if the group has two or more servers. |
If there are no records in the selected range, the No Logs Found message and the Try expanding log date range suggestion are displayed. While the list is filled, the total number of records and the Last Updated time are located at the bottom of the tab.
Records in a Backend Group
No separate record is kept for the group itself; records are written separately for each server in the group and combined in a single timeline in the tab. The Log Limit is applied to the combined list: the list contains the newest records across all servers. The status in the records is the server's own result; the aggregate Partially Healthy status shown in the preview is not written to the records. When a server is added to or removed from the group, the list is rebuilt according to the new server set. How the aggregate status is calculated is described on the Backend Groups Dashboard page.
Summary Text
The summary is created from the parts of the record in the following order, with / placed between them; the parts that are not present in the record are skipped:
| Order | Part | Description |
|---|---|---|
| 1 | Expect negative result | It is written if inverting the result is selected in the health check profile. |
| 2 | Check type | The profile type, such as TCP, HTTP, DNS, Ping or Scenario. |
| 3 | Error text | The error returned by the check; it is shown in orange and bold (e.g. TCP connection timeout). |
| 4 | Duration | The measured response time of the check (e.g. 1ms, 1s 250ms). If the time is measured as exactly zero, 0 is written without a unit; if the time could not be measured because of an error, this part is not present. |
| 5 | HTTP status code | The code returned in HTTP and HTTPS checks and its description (e.g. 200: OK). |
| 6 | DNS answers | The answers returned in DNS checks, joined with commas. |
Examples: TCP / 1ms shows a successful TCP check completed in 1 millisecond, and TCP / TCP connection timeout shows a connection attempt that timed out.
Status Values
| State | Meaning |
|---|---|
| OK (green) | The Backend Service (in a group, the related server) is up. The status is the result after the Required Successes and Required Failures thresholds in the profile are applied: even if a single attempt fails (e.g. TCP connection timeout), the record is written as OK as long as the threshold is not exceeded, and the error text is included in the summary. |
| Error (red) | The Backend Service (in a group, the related server) is down; the number of consecutive failed attempts has reached the Required Failures threshold. The status stays Error until the number of consecutive successful attempts reaches the Required Successes threshold. |
| Preparing (orange) | The check result is not yet final. |
Health Check Logs Listing Screen
When the enlarge button in the Health Checks tab is clicked, the records are listed as a table in the Health check logs for <Backend Service or group name> window, which covers most of the screen. When the window opens, the records are fetched automatically; subsequent fetches are done with the Get Logs button. The window is closed with the close icon in its header. There is no preview panel or right-click menu for the table rows.
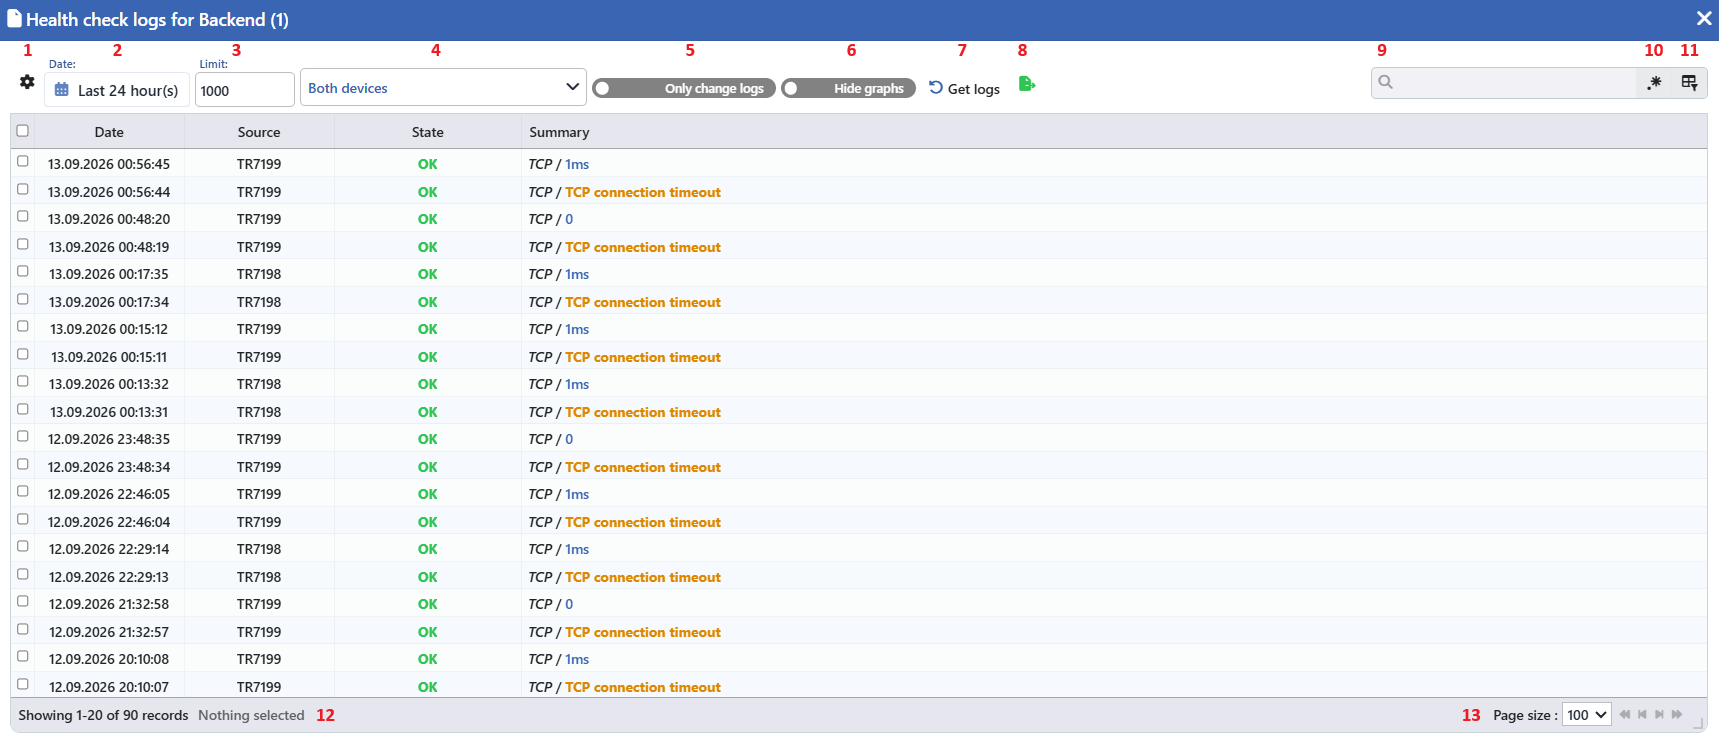 Health Check Logs Listing Screen
The table opens with the following columns by default:
| Column | Description |
|---|---|
| Date | The date and time the record was written, in the DD.MM.YYYY HH:mm:ss format. |
| Address | The ip:port information of the server the record belongs to. It exists only in Backend Groups with two or more servers. |
| Source | The name of the device that produced the record. It exists only in cluster setups. |
| State | The status of the check result, in the status color (Status Values). |
| Summary | The check type, the measured time and the error text, if any (Summary Text). Long summaries are displayed in full when the pointer is over the cell. |
There is no column hidden by default. On opening, the table comes with the newest record at the top; when a column header is clicked, descending sorting is applied first, then ascending, and on the third click, the sorting is removed.
The items in the toolbar are arranged from left to right in the following order; the last two items (Page Information and Page Size) are located in the information strip below the table.
Columns
Which columns are shown in the table is selected. In the same panel, columns are reordered by dragging and alignment is selected per column; the row height is fitted to the page with the Fit rows to the page button, and the column layout is reset to default with the Reset button. The layout is stored per user.
Date
The time range of the records to be listed is selected; the default is Last 24 hour(s). The selection is shared with the Health Checks tab and stored per user. While the chart section is open, when the time range is changed on the charts, the Date selection is also updated and the records are fetched again.
Limit
The maximum number of records to be fetched is entered; the value must be greater than 0, and the default value is 1000. In a Backend Group, the limit is applied to the combined list of all servers. When the value is changed, the records are not fetched again automatically; Get Logs is required for the new value to be applied.
Source
In cluster setups, the device from which the records will be fetched is selected: Both Devices (default), the name of this device or the name of the peer device. The selector is displayed only while clustering is enabled; the selection is stored per user.
Only Change Logs
The switch shows the current selection: Only Change Logs lists only change records, and All Logs lists all records including periodic records. The default is Only Change Logs, and the selection is shared with the Health Checks tab. When the selection is changed in the window, the records are not fetched again automatically; Get Logs is required for the new selection to be applied.
Hide Graphs
The switch shows the current state of the chart section: Hide Graphs indicates that the charts are off, and Show Graphs that they are on. The default is Hide Graphs. When the charts are turned on, the traffic panels of the Backend Service or group are displayed above the table; the time range of the panels follows the Date selection, and their layout is stored per user. The health check status and duration charts are not in this section but in the Health Check tab of the Backend Services Dashboard and Backend Groups Dashboard screens.
Get Logs
The records are fetched again according to the selected range, limit, source and record type by clicking the Get Logs button. There is no automatic refresh in the window. While fetching is in progress, the button stays inactive and shows a spinning icon.
Export
The table is exported as Excel, CSV or PDF by clicking the Export button. In the window that opens, the Filename, Format and Data Source, together with the Columns to be exported, are determined; the remaining fields are displayed according to the format: CSV Separator for CSV, Excel Sheet Name for Excel, and Page Orientation and Page Size for PDF.
Search
Used to search all information in the table.
RegExp Search
Used to search all information in the table with a regular expression (RegExp).
Column Based Search
Used to perform a column-based search on the information in the table.
Page Information
Contains information about the total number of fetched records and the range of records displayed in the list: Showing N-M of T records and the number of selected rows (N selected, or Nothing selected when there is no selection). Rows can be selected, but there is no operation performed with the selection.
Page Size
The maximum number of records to be displayed on the page is selected. The default is 100; the options are 5, 10, 20, 50, 100, 200, 500 and All. The selection is not stored.
