
Smarter by Design.Simpler for Business
Reports
What Is the Reports Profile?
Reports is a configuration profile that turns the traffic statistics of the vServices running on TR7 into detailed reports.
In the TR7 architecture, reporting is designed on a profile basis. Thanks to this structure, which metrics will be included in the report, the chart types, the export formats and the automatic e-mail sending settings are defined centrally and applied by being assigned to the related vServices. Reports Profiles work at the vService level and analyze the HTTP vService traffic data.
When a Reports Profile is defined, TR7 records all the traffic passing over the vService and creates reports by analyzing these data according to the determined divisions. The reports can be displayed and exported in the HTML, Excel (XLSX) and PDF formats.
The benefits it provides
- The traffic volume, the request rate and the session statistics on a vService basis can be analyzed in detail.
- Capacity planning can be done by examining the performance trends according to the time interval.
- The performance bottlenecks can be detected over the metrics such as the intensity, the error rate and the connection distribution.
- The reports can be exported in different formats and used in the operation, management and audit processes.
- With the automatic e-mail sending, regular report sharing with the related teams can be done in the determined periods.
TIP
More than one profile on the same vService
More than one Reports Profile can be defined on a single vService. In this way the same traffic data can be analyzed simultaneously in different formats and contents for the operational monitoring, the management reporting and the audit needs.
The Importance of the Reports Profile
Data-driven decision making is the cornerstone of modern IT operations. The TR7 reporting system presents the data necessary for understanding the traffic patterns, doing capacity planning and performing security analyses.
Without reporting, the system administrators have difficulty in understanding the traffic trends, the user behaviors and the performance problems. Manual log analysis is both time-consuming and open to making mistakes.
That reporting can be defined on a profile basis and at the vService level on TR7 makes it possible for different services to be configured according to their different reporting needs. While the page-based analyses are important for an e-commerce site, the HTTP method and status code analyses can be more critical for an API service.
Multiple Profiles
On the same vService
Separate simultaneous reports for different audiences
3 Formats
HTML · Excel · PDF
Display and export
Trend
Capacity planning
Time-based performance trends
Automatic
E-mail sending
Periodic report sharing
For this reason, Reports Profiles are an indispensable tool for operational visibility and data-driven management on TR7.
The Hit and Visitor Concepts
The TR7 reporting system offers two basic measurements for every metric: Hit and Visitor.
INFO
Hit
It expresses the total number of HTTP requests. When a user loads a page, separate HTTP requests occur for the page content, the CSS files, the JavaScript files, the images and the other resources, and each of them is counted as one "hit".
INFO
Visitor
It expresses the number of unique users. TR7 uses the combination of the IP Address and the User-Agent for the visitor detection. All the requests of the same user within one hour are counted as a single visitor.
An example scenario: When a user visits the website:
- The home page is loaded (1 hit)
- 5 CSS files are loaded (5 hits)
- 10 images are loaded (10 hits)
- 3 JavaScript files are loaded (3 hits)
The result: 19 Hits, 1 Visitor. This distinction has critical importance for understanding the real number of users and for evaluating the server load.
INFO
Unique
In the reports there is also a Unique measurement that is independent of the hourly window. The identification is done with the cookie if the client presents the tr7_v cookie and with the IP + User-Agent if it does not; the value is calculated by being deduplicated across the days and the cluster devices.
The Report Divisions
TR7 analyzes the traffic data in 31 divisions. The Excel report contains all of the 31 divisions; the Day by Day and Hour by Hour divisions are not in the PDF report (29 divisions) and the report starts with the Report Summary, Frontend Graphs and Backend Graphs parts. The divisions are listed in the report according to the selection order.
The PDF Report: the summary, the charts and 29 divisions (click to expand)
| Report Division | Description |
|---|---|
| Report Summary | The general traffic summary of the selected time interval and the collective view of the basic metrics |
| Frontend Graphs | The visual analysis of the traffic, connection and request charts on a vService (Frontend) basis |
| Backend Graphs | The chart analysis of the traffic, the response times and the load distribution on a Backend Service basis |
| Country Report | The traffic distribution on a country basis |
| Host Report | The distribution according to the Host header value |
| Pages | The traffic distribution on a page/URL basis |
| 404 Pages Report | The pages that return a 404 error |
| Referer Report | The referring site/source |
| Backend Service Report | To which Backend Service it was routed |
| Response From Report | The source of the response (Backend Service/Cache/TR7) |
| IP Report | The distribution on a client IP address basis |
| IP Provider Report | The distribution on an Internet Service Provider (ISP) basis |
| Operating System Report | The operating system distribution |
| Browser Report | The browser distribution |
| Status Code Report | The distribution of the HTTP response codes |
| Method Report | The distribution of GET, POST, PUT, DELETE, etc. |
| HTTP Version Report | The HTTP/1.0, HTTP/1.1, HTTP/2 distribution |
| Request Content Type Report | The request MIME types |
| Response Content Type Report | The response MIME types |
| Request SSL Report | The SSL cipher and version on the request side |
| Response SSL Report | The SSL cipher and version on the response side |
| User Agent Report | The raw User-Agent string distribution |
| City Report | The traffic distribution on a city basis |
| Continent Report | The traffic distribution on a continent basis |
| Hour Report | The distribution according to the hours of the day (00–23) |
| Static Pages Report | The static file requests |
| 1xx Pages Report | The pages that return information responses |
| 2xx Pages Report | The pages that return successful responses |
| 3xx Pages Report | The pages that return redirection responses |
| 4xx Pages(Except 404) Report | The client errors (except 404) |
| 5xx Pages Report | The pages that return server errors |
| Frontend IP & Port Report | The vService IP:Port information from which the requests came |
The Excel Report: 31 divisions (click to expand)
| Report Division | Description |
|---|---|
| Day by Day | The daily traffic distribution |
| Hour by Hour | The hourly traffic distribution |
| Country | The traffic distribution on a country basis |
| Host | The distribution according to the Host header value |
| Pages | The traffic distribution on a page/URL basis |
| 404 Pages | The pages that return a 404 error |
| Referer | The referring site/source |
| Backend Service | To which Backend Service it was routed |
| Response from | The source of the response (Backend Service/Cache/TR7) |
| IP | The distribution on a client IP address basis |
| IP Provider | The distribution on an Internet Service Provider (ISP) basis |
| Operating System | The operating system distribution |
| Browser | The browser distribution |
| Status Code | The distribution of the HTTP response codes |
| Method | The distribution of GET, POST, PUT, DELETE, etc. |
| HTTP Version | The HTTP/1.0, HTTP/1.1, HTTP/2 distribution |
| Request Content Type | The request MIME types |
| Response Content Type | The response MIME types |
| Request SSL | The SSL cipher and version on the request side |
| Response SSL | The SSL cipher and version on the response side |
| User Agent | The raw User-Agent string distribution |
| City | The traffic distribution on a city basis |
| Continent | The traffic distribution on a continent basis |
| Hour | The distribution according to the hours of the day (00–23) |
| Static Pages | The static file requests |
| 1xx Pages | The pages that return information responses |
| 2xx Pages | The pages that return successful responses |
| 3xx Pages | The pages that return redirection responses |
| 4xx Pages(Except 404) | The client errors (except 404) |
| 5xx Pages | The pages that return server errors |
| Frontend IP & Port | The vService IP:Port information from which the requests came |
The Chart Types
The report profiles contain separate chart sets for the Frontend (vService) and the Backend (Backend Service) in the PDF format. The Backend charts are shown separately for every Backend Service.
The Frontend (vService) Charts
| Chart | Description |
|---|---|
| Requests per second | The number of incoming HTTP requests per second |
| Connection | The number of new connections established per second |
| TCP sessions | The instant number of active TCP sessions |
| RX bandwidth | The amount of incoming traffic (bits/second) |
| TX bandwidth | The amount of outgoing traffic (bits/second) |
| Backend service response time | The Backend Service response time |
The Backend (Backend Service) Charts
| Chart | Description |
|---|---|
| Connection | The new connections established to the Backend Service per second |
| TCP sessions | The instant TCP sessions open to the Backend Service |
| Backend requests | The number of HTTP requests per second of the Backend Service |
| Backend service response time | The Backend Service response time |
| Health check result | The health check results (up/down) |
| Health check time | The health check response time |
Custom Report Fields
Besides the standard report divisions, TR7 offers the possibility of creating custom report tables with Smart Variable support. This feature makes it possible for custom data extraction to be done from the HTTP headers, the cookie values or the other request/response information.
The use scenarios:
- Reporting the custom header values (e.g.
X-Forwarded-For,X-Request-ID). - Cookie-based user segmentation.
- Detailed analyses on an API endpoint basis.
- Traffic categorization according to the custom business rules.
- Reporting a desired piece of information outside the default report divisions.
Every custom report table consists of the following components:
- Table Title: the title of the table that will appear in the report.
- Table Condition: under which conditions the table will be created (optional).
- Table Columns: the column titles, the static content or the Smart Variable expressions.
An example custom report table:
| Component | Value |
|---|---|
| Table Title | IPs&Host&Country |
| Table Condition | Always |
| Column 1 | IP Address: [↓IP] |
| Column 2 | Host Info: [↓H] |
| Column 3 | Country: [↓Country] |
The E-mail Report Settings
TR7 supports the reports being sent automatically by e-mail in certain periods.
The sending periods:
| Period | Description |
|---|---|
| Daily | Every day the report of the previous day is sent |
| Weekly | Every week the report of the previous week is sent |
| Monthly | Every month the report of the previous month is sent |
| Annual | Every year the report of the previous year is sent |
The report formats:
- PDF: a visually rich, printable format.
- XLSX: editable in Excel, suitable for detailed data analysis.
Warning
For the e-mail sending, the SMTP server configuration must be made on the TR7 device. The related configuration is in the Notification Management section.
Operational Best Practices
- The report divisions are selected according to the need. Instead of keeping all the divisions on, the divisions suitable for the related service are selected; on an API service the User-Agent or Browser analyses remain unnecessary.
- The PDF Max. Table Rows value is improved. Too many rows increase the file size and reduce the readability; the default 50 rows is generally enough, and in the detailed analyses the XLSX format is preferred.
- More than one profile is used. Separate profiles are created for different target audiences: profiles that contain a summary for the managers and a detailed analysis for the technical team are defined.
- The e-mail reports are used in moderation. PDF is sent in the daily reports and both PDF and XLSX in the weekly/monthly analyses; sending reports too often causes "report blindness".
- No change is made without the "Used in" information being checked. A report profile must not be updated without knowing on which vServices it is used in the live environment.
- The custom report fields are used carefully. Custom report fields is a powerful tool, but every column brings an additional processing load; only the custom fields that are really needed are defined.
Supported vService Types
HTTP
L7 TCP
Network
WARNING
The report data is produced only on the HTTP vServices. The interface offers the Report option on the L7 TCP and Network vServices as well; however, even if a profile is assigned on these types, no report data is produced and no warning is given.
How to Add?
A new Reports Profile is added through the TR7 web management interface with the steps below:
- The Configuration Menu is opened by clicking the TR7 logo at the bottom left.
- The Load Balancer → Profiles → Reports → Add steps are followed.
- A unique and descriptive name is entered for the profile.
- The values suitable for the application and service requirements are configured.
- The profile is added by clicking the
Addbutton.
TIP
Reaching the page via quick search
Instead of navigating the menu step by step, the related page is reached directly by using the search bar in the bottom left corner of the screen. The search bar opens with the Alt + T shortcut on Windows and Opt + T on macOS; typing the name of the feature being searched for is then sufficient.
The created profile can be used on one or more vServices.
Profiles Listing Screen
By following the Load Balancer → Profiles → Reports path, the list of all the Reports Profiles added on the TR7 device is reached. Profile adding, editing and deleting operations are performed through this screen.
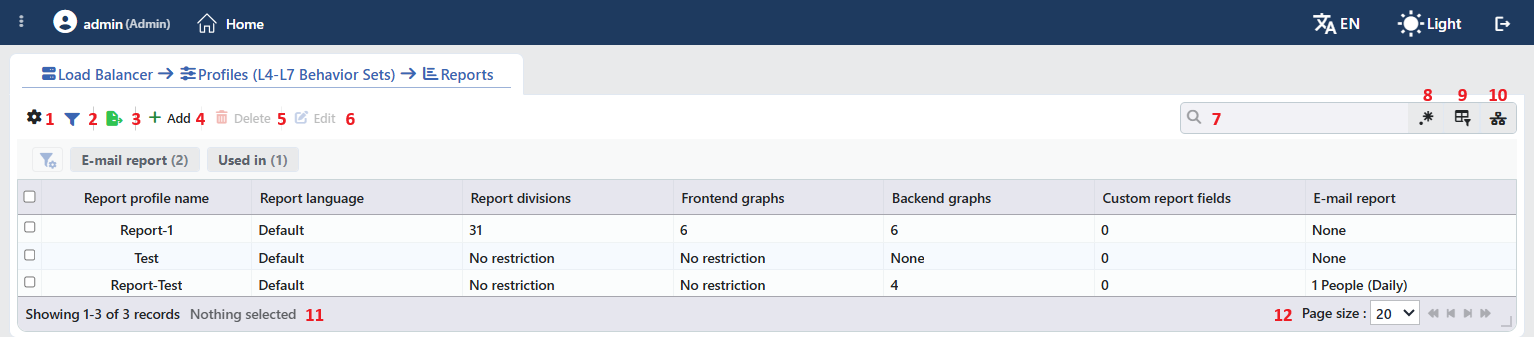 Reports Profiles Listing Form
The table opens with the following columns by default:
| Column | Description |
|---|---|
| Report Profile Name | The name of the profile. |
| Report Language | The language of the report; if no language is selected, Default. |
| Report Divisions | The number of divisions included in the report; if there is no division restriction, No Restriction. |
| Frontend Graphs | The number of frontend charts included in the report; if there is no restriction, No Restriction. |
| Backend Graphs | The number of Backend Service charts included in the report; if no chart is selected, None. |
| Custom Report Fields | The number of defined custom tables. |
| E-mail Report | If the e-mail report is off, None; if it is on, the number of recipients and the sending frequency (e.g. 1 People (Daily)). |
There is no column hidden by default; these seven columns are in the column selector. The table is not sorted when it opens; when a column header is clicked, descending sorting is applied first, then ascending, and on the third click the sorting is removed.
The items in the toolbar are arranged from left to right in the following order; the last two items (Page Information and Page Size) are located in the information strip below the table.
Columns
Which columns are shown in the table is selected; all seven columns are on by default. In the same panel, columns are reordered by dragging and alignment is selected per column; the row height is fitted to the page with the Fit rows to the page button, and the column layout is reset to default with the Reset button. The layout is stored per user.
Filter
The Filter button is used to filter the profiles shown in the list according to certain criteria; the button shows the number of active filters with a badge. There are two cards in the strip: E-mail Report and Used in. In the card title there are the filter name and the number of values; when the card is clicked, the values are listed under it with their row counts. The Used in card lists the names of the vServices on which the profile is used; for the profiles that are not used on any vService, the Unused Entries option is available. The selections are displayed as closable labels under the card strip, right above the table.
Export
The table is exported as Excel, CSV or PDF by clicking the Export button. In the window that opens, the Filename, Format and Data Source, together with the Columns to be exported, are determined; the remaining fields are displayed according to the format: CSV Separator for CSV, Excel Sheet Name for Excel, and Page Orientation and Page Size for PDF.
Add
By clicking the Add button, the form for creating a new profile opens in the Add tab.
Delete
When one or more profiles are selected and the Delete button is clicked, the related profiles are deleted.
WARNING
A profile that is in use can also be deleted and the confirmation window does not show the usage places. On the vServices that use the deleted profile as the main profile, report production stops silently; there is no return to the built-in default profile. Before deleting, the Used in tab on the preview panel must be checked.
Edit
By clicking the Edit button, the edit form of the selected profile opens in the Edit tab. The button becomes enabled only when a single profile is selected.
Search
Used to search all information in the table.
RegExp Search
Used to search all information in the table with a regular expression (RegExp). This button is hidden while column-based search or the usage filter is active.
Column Based Search
Used to perform a column-based search on the information in the table.
Usage Filter
Used to filter which vServices the profiles are bound to; the profiles used on the selected vService are listed, and there is an Unused Entries option for those not used on any vService. While the filter is active, the selector takes the place of the search box; when the icon is clicked again, the search box returns.
Page Information
Contains information about the total number of defined profiles and the number of profiles displayed in the list: Showing N-M of T records and the number of selected profiles (N selected, or Nothing selected when there is no selection). If a selection has been made in the filter strip, the number of applied filters and the shown/total row information are added to the same line.
Page Size
The maximum number of profiles to be displayed on the page is selected. The default is 20; the options are 5, 10, 20, 50, 100, 200, 500 and All.
Right-Click Menu
When a row is right-clicked, a menu with the profile's name in its title opens. Both operations in the menu apply only to the right-clicked profile; a selection made in the list does not affect the menu.
| Operation | What it does |
|---|---|
| Edit | Opens the editing form of the profile in the Edit tab; it is the same as the form opened by the Edit button in the toolbar. |
| Delete | Deletes the right-clicked profile; the same confirmation question as the deletion in the toolbar is displayed. |
Preview of the Selected Profile
When a row in the list is clicked, the preview of the profile opens on the right of the screen; when the selected row is clicked again, the panel closes. In the title there are the profile icon, the name of the profile and the Report profile subtitle, and at the top right there is a single operation.
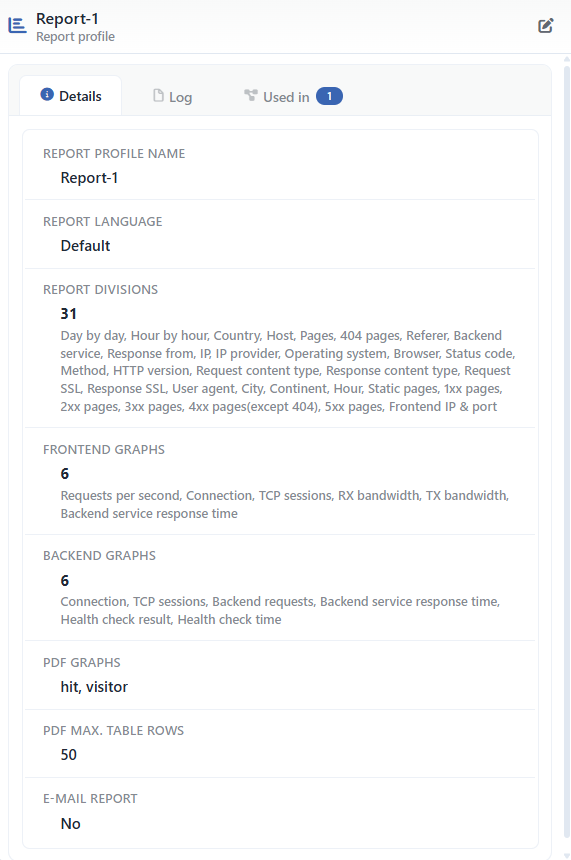 Preview of the Selected Profile
| Operation | What it does |
|---|---|
| Edit | Opens the editing form of the profile in the Edit tab. |
The panel has three tabs; the last one is displayed only if there is a vService that uses the profile:
Details
Lists the settings of the profile line by line (the table below).
Log
Lists the user operations on the profile (adding, editing, deleting) as a timeline.
Used in
Lists the vServices on which the profile is used. The badge next to the tab name shows the number of usages; if there is no vService that uses the profile, the tab is not displayed at all.
The rows in the Details tab are as follows, in order:
| Row | Description | Visibility condition |
|---|---|---|
| Report Profile Name | The name of the profile. | Always |
| Report Language | The language of the report; if no language is selected, Default. | Always |
| Report Divisions | The number of divisions and under it the division names comma separated; if there is no restriction, No Restriction. | Always |
| Frontend Graphs | The number of charts and under it the chart names; if there is no restriction, No Restriction. | Always |
| Backend Graphs | The number of charts and under it the chart names; if no chart is selected, None. | Always |
| Custom Report Fields | The number of custom tables and under it the title and the columns of every table (Column Title: content). | If at least one custom table is defined |
| XLSX Max. Table Rows | The maximum number of rows per table in the XLSX report. | If the value is defined |
| PDF Graphs | The charts added to the PDF report, comma separated. | If at least one chart is selected |
| PDF Max. Table Rows | The maximum number of rows per table in the PDF report. | If the value is defined |
| E-mail Report | Yes or No. | Always |
| E-mail Addresses | The addresses to which the report will be sent, comma separated. | If the e-mail report is on and there is an address |
| E-mail Report Content | The report formats to be sent in capital letters (PDF, XLSX). | If the e-mail report is on and a format is selected |
| E-mail Frequency | The sending frequencies (e.g. Daily, Weekly). | If the e-mail report is on and a frequency is selected |
The "Used in" tab must be checked
The Used in tab shows on which vServices the profile is active. Since updates to the profile settings in a live environment will immediately affect all bound services, evaluating the possible service impacts before a change is critically important.
Profile Add Form
A new Reports Profile is added on the TR7 device by following the Load Balancer → Profiles → Reports → Add steps.
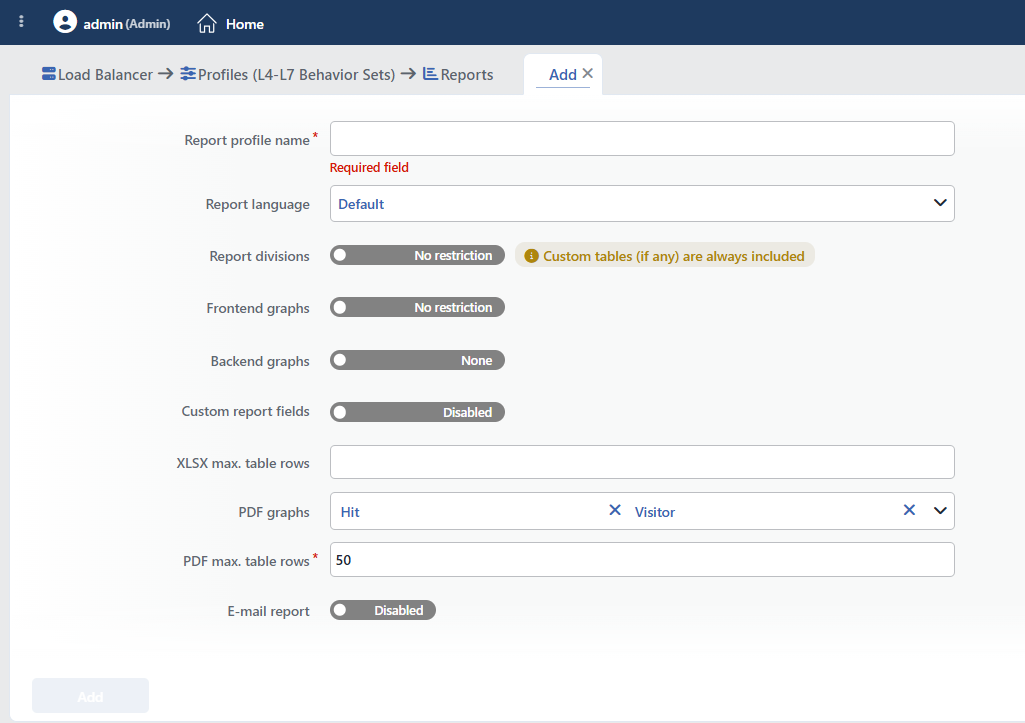 Reports Profile Add Form
INFO
Report Language
In which language the PDF and Excel reports will be created is selected; the in-interface HTML view uses the interface language.
| Option | Description |
|---|---|
| Default | According to the interface language of the user, and if there is none, according to the system localization setting |
| English | Reports in English |
| Türkçe | Reports in Turkish |
INFO
Report Divisions
Which analysis divisions will take place in the reports is determined.
- No Restriction: all the divisions are included in the report.
- Select: the desired divisions are selected from the list that opens.
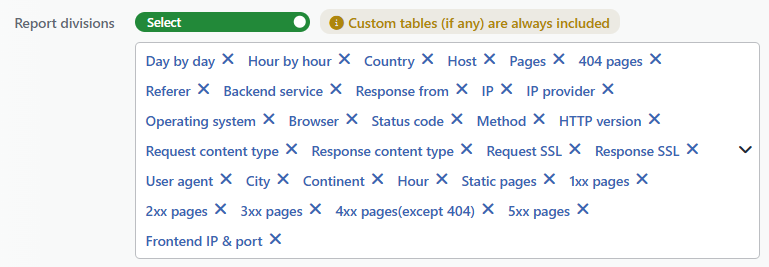 The Report divisions Selection
Warning
In the Excel and PDF reports the divisions are listed according to the selection order. The note under the field states that the custom tables (Custom Report Fields) are always added to the report independently of the selection.
INFO
Frontend Graphs
Whether the performance charts at the vService level will be included in the report or not is selected.
- No Restriction: all the frontend charts are included.
- Select: the desired charts are selected from the list that opens.
 The Frontend graphs Selection
INFO
Backend Graphs
Whether the performance charts at the Backend Service level will be included in the report or not is selected.
- None: the Backend Service charts are not included.
- Select: the desired charts are selected from the list that opens.
 The Backend graphs Selection
INFO
Custom Report Fields
It makes it possible for custom report tables to be created with Smart Variable support. When it is activated, the table title, the condition and the columns can be defined.
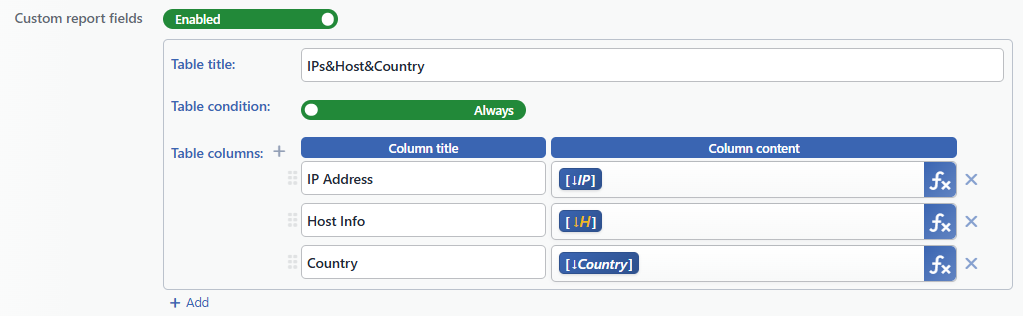 The Custom report fields Configuration
- Table Title: the title information of the table that will appear in the report is entered.
- Table Condition: under which conditions the table will be created is selected. It can be Always (the default; it takes effect regardless of the condition) or Choose (a selection from the conditions defined in Traffic Manipulation).
- Table Columns: the Column Title and Column Content information of the table to be created is selected.
For the "IPs&Host&Country" custom report field, the Excel and PDF outputs are as follows:
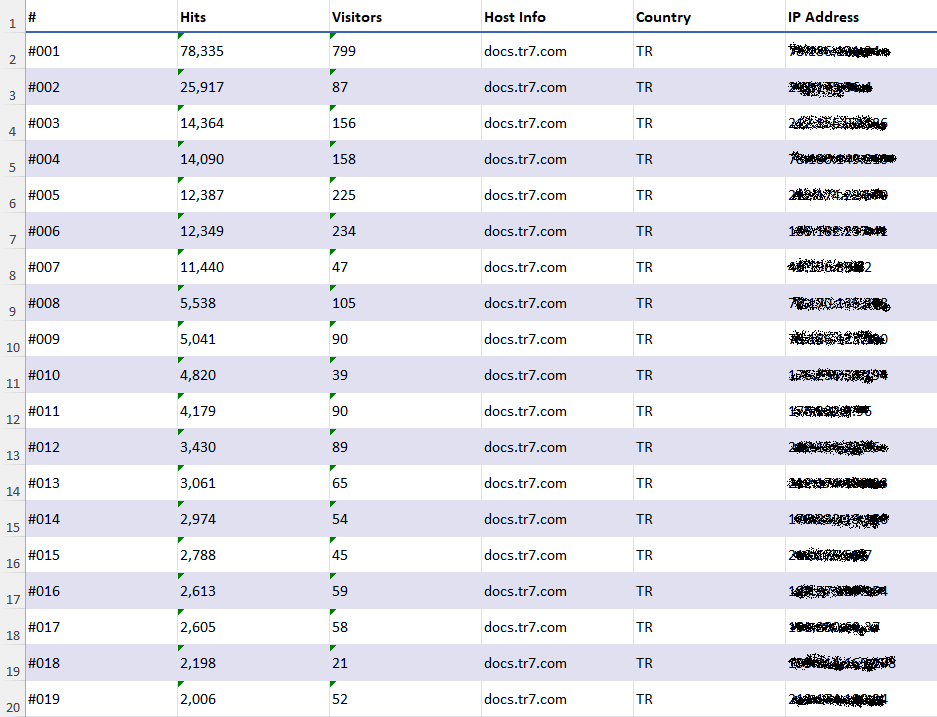 The Excel Report
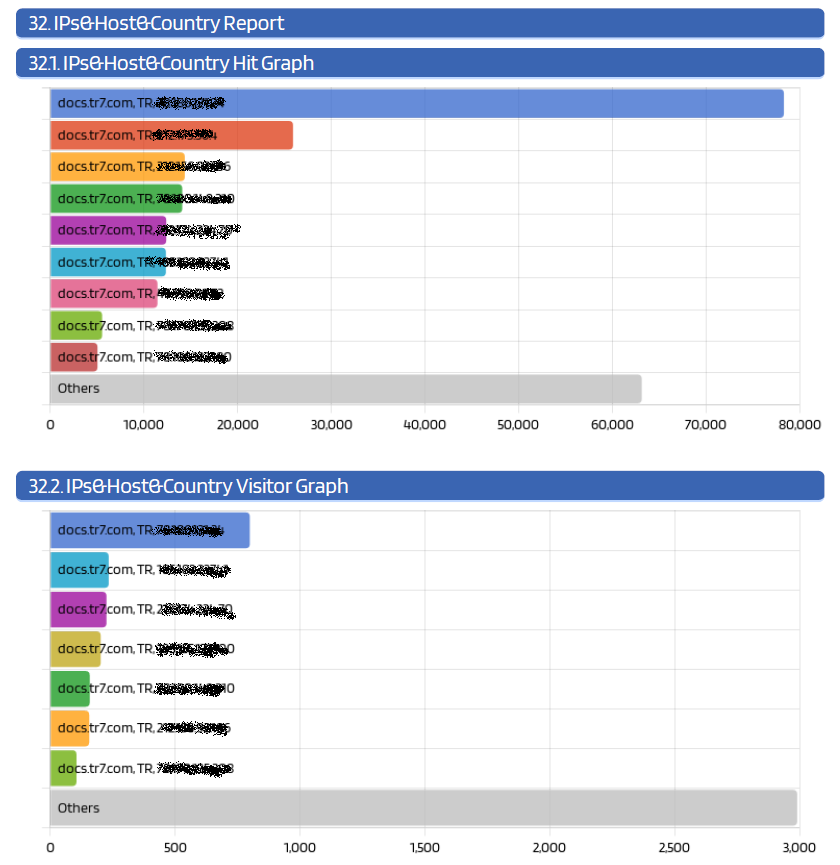 The PDF Report Dashboard
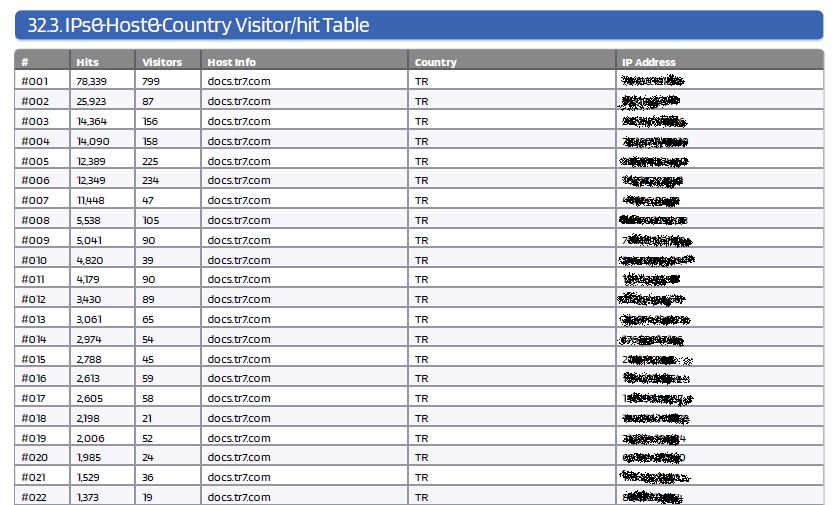 The PDF Report Table
INFO
XLSX Max. Table Rows Minimum: 5
The maximum number of rows of every table in the Excel reports is determined. At least 5 can be entered; there is no upper limit. The field can be left empty; while it is empty, no row limit is applied.
INFO
PDF Graphs
With which metrics the charts in the PDF reports will be created is selected.
| Option | Description |
|---|---|
| Hit | Charts on a request number basis |
| Visitor | Charts on a unique visitor basis |
Both options can be active at the same time. Detailed information is in the The Hit and Visitor Concepts section.
INFO
PDF Max. Table Rows Default: 50
The maximum number of rows of every table in the PDF reports is determined. A minimum of 5 and a maximum of 200 value can be entered.
INFO
E-mail Report Default: Disabled
It activates the automatic e-mail report sending. When it is activated, the additional settings become visible.
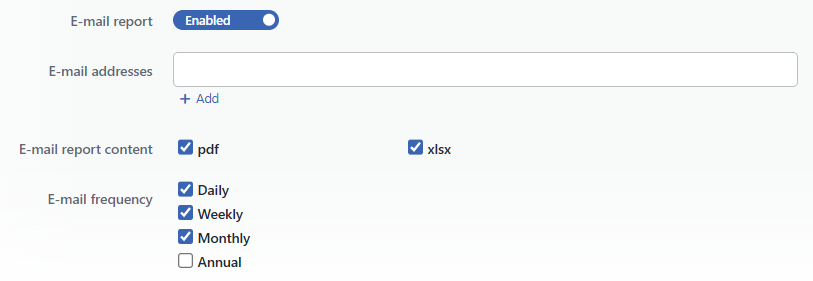 The E-mail report Settings
- E-mail Addresses: the e-mail addresses to which the reports will be sent are entered. By clicking the
(+)button, more than one address can be added. - E-mail Report Content: the report formats to be sent by e-mail are determined (PDF and/or XLSX). At least one format must be selected.
- E-mail Frequency: the report sending frequency is selected (Daily, Weekly, Monthly, Annual). More than one period can be selected; at least one period is required.
Warning
For the e-mail sending, the SMTP configuration must be made on the TR7 device. The related configuration is in the Notification Management section.
How to Add to a vService?
A Reports Profile is assigned to a vService by following the steps below.
1
Step 1 Go to the vServices screen
The Load Balancer → Load Balancer vService List path is followed in the TR7 web interface.
2
Step 2 Open the editing screen of the vService
The vService to which the profile will be added is right-clicked and Edit is selected; or the vService is clicked and the Edit icon is clicked in the window that opens on the right.
3
Step 3 Enable the Report feature
On the Details panel on the right of the editing screen of the vService, the feature is put into effect by marking the Report option. When it is marked, the built-in Default Profile comes selected; on a new vService this option starts off.
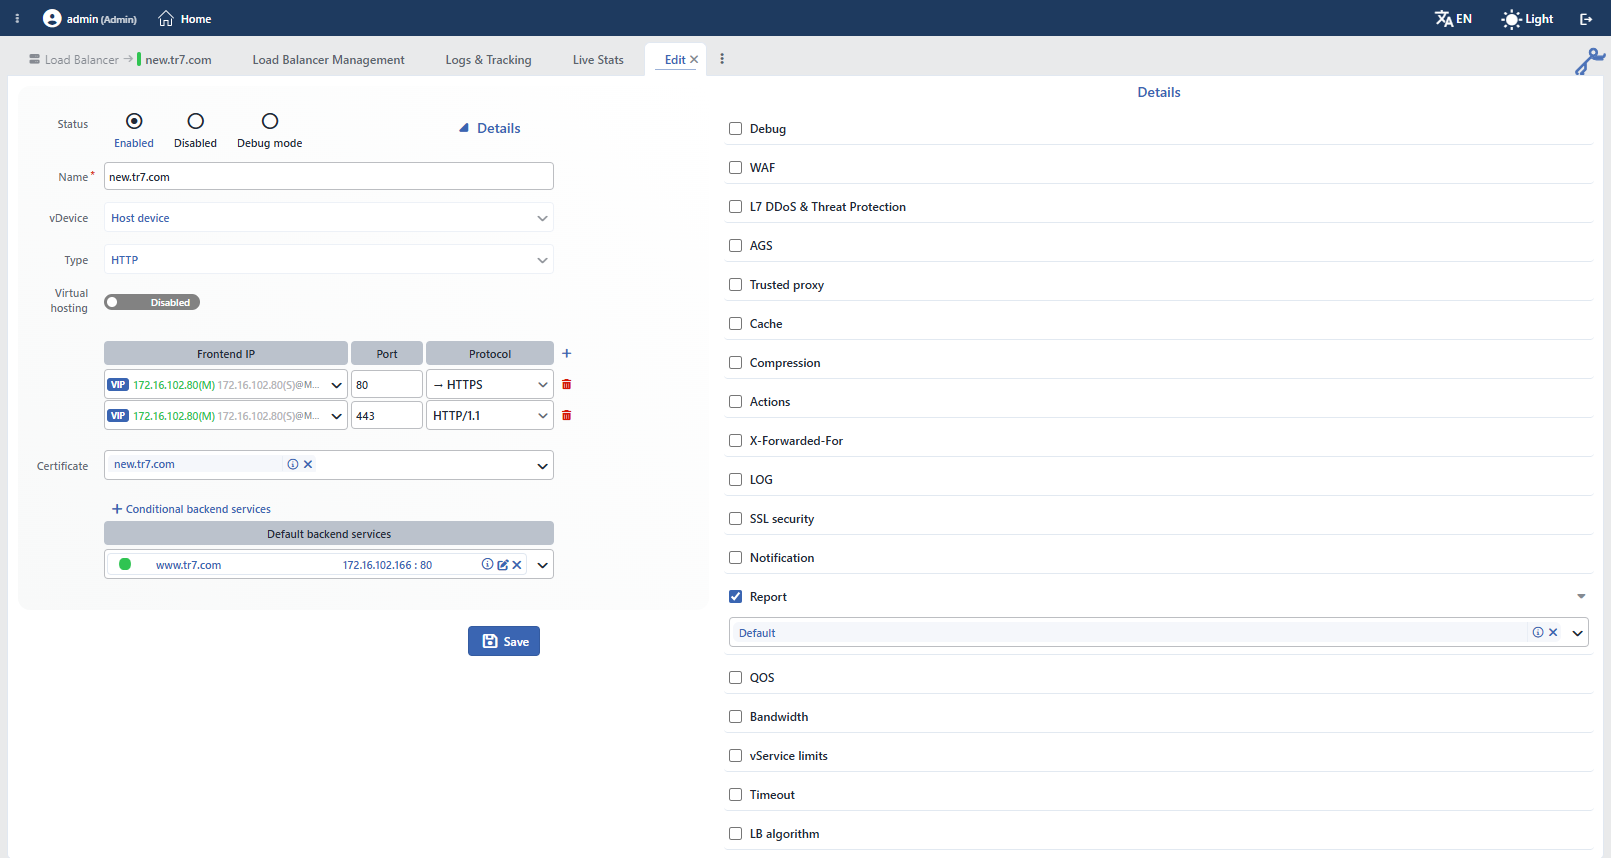 The Report Selection on the vService Editing Screen
4
Step 4 Select a profile or add a new one
In order to use a different profile, the arrow sign next to the row is clicked and a selection is made from the list in the expanding section. More than one Reports Profile can be selected; in this way different reports for different target audiences can be created over the same vService.
INFO
When more than one profile is assigned, only the Custom Report Fields tables are combined from all the profiles; the language, the division selection, the row limits and the e-mail settings are taken from the first profile in the list.
If desired, a new profile can also be added through the vService editing screen by clicking the Add button.
5
Step 5 Save
The changes are saved by clicking the Save button; while the configuration is being applied to the vService, the "vService is being edited" notification is displayed.
How Is a Report Created Manually?
An instant (manual) report can also be produced for a vService that has a Reports Profile assigned.
1
Step 1 Go to the vServices screen
The Load Balancer → Load Balancer vService List path is followed in the TR7 web interface.
2
Step 2 Go to the Dashboard screen
The vService on which the Reports Profile is active is selected from the list and the Dashboard icon is clicked, or the related service under vServices is selected directly from the left menu. With both methods the Dashboard screen of the related vService is reached.
3
Step 3 Generate Report
The Generate Report button is clicked on the Dashboard screen.
4
Step 4 Select the format and create
The desired information is selected from the window that opens and the Accept button is clicked; the report is created manually in the desired format.
