
Smarter by Design.Simpler for Business
GTM
What Is GTM?
GTM is the view tab that gathers the traffic of all the DNS services on the device on a single screen on the TR7 home page. The tab consists of four subtabs: Traffic shows the query, protocol, bandwidth and connection totals; Responses the error, recursion, response code and query type breakdowns; Performance the cache and latency values; and Forwarder the totals of the forwarded queries.
The panels are the device-wide equivalent of the panels on the Dashboard screen of a single DNS service; only the DNS Cache Entries panel does not have a ready equivalent on the service dashboard. Above the title of these panels All DNS Services is written and the value is the total of all the DNS services on the device. In most of the metrics the totaling is done by the values of the services being summed; in the DNS Latency and Forwarder Latency panels, on the other hand, the average of the services is taken.
The display of the tab depends only on the GTM permission of the user. Whether there is a DNS service defined on the device, whether a forwarder is assigned in the services and whether the services are in a running state are not required: in these cases the tab still opens but no data is displayed in the panels. The GTM metrics are recorded at five-second intervals.
4
Subtabs
Traffic, Responses, Performance and Forwarder; when the upper tab is clicked, Traffic opens
18
Panel
Traffic 7, Responses 4, Performance 3, Forwarder 4; there is no conditional panel
Device-Wide
Totals
The All DNS Services panels show the total of all the DNS services
5 s
Data Collection
The DNS metrics are recorded once every five seconds; the finest resolution goes 24 hours back
Access to the GTM Tab
- The Home shortcut on the left of the Header Bar is clicked.
- GTM is selected from the view tabs; the tab opens with the Traffic subtab.
- For the other subtabs, Responses, Performance or Forwarder is selected from the second row.
For the Header Bar shortcuts, see Header Bar.
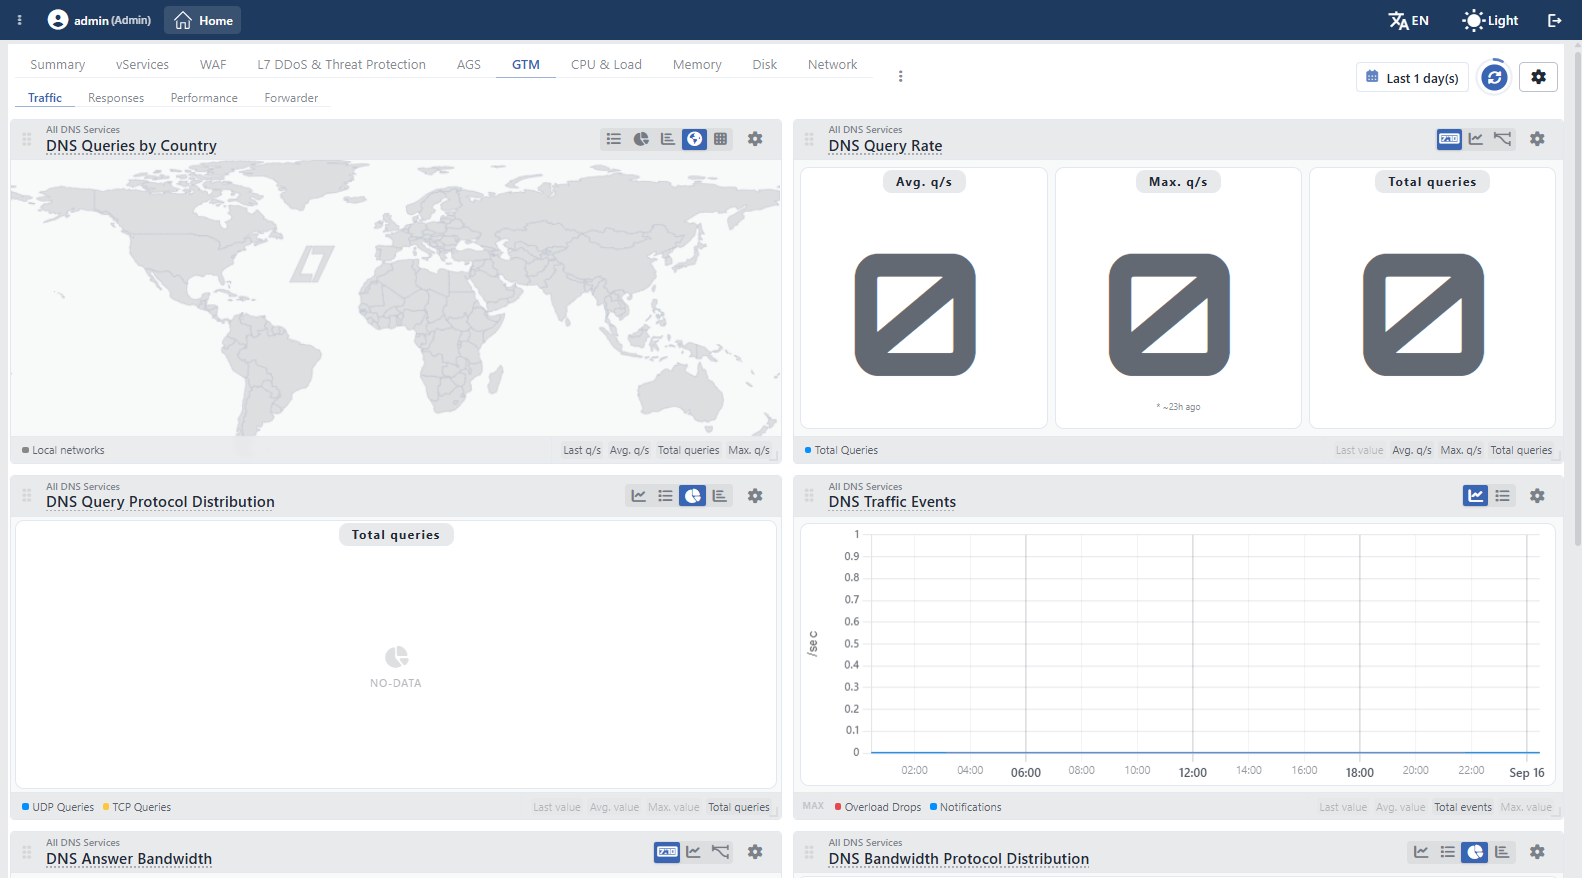 The GTM Tab
The screen controls are common to all the tabs
The time range selector, the refresh, the settings, the template menu and the arrangement of the panels are the same in all the view tabs of the home page; for the detail, see Screen Controls.
Subtabs
| Subtab | Content |
|---|---|
| Traffic | The query rate, the protocol distribution, the traffic events, the answer bandwidth and the TCP connection totals; the country map. |
| Responses | The error, recursion, response code and query type breakdowns. |
| Performance | The hit/miss rates of the packet cache, the number of cache entries and the query processing latency. |
| Forwarder | The rate, the bandwidth, the cache and the latency of the forwarded queries. |
The tab is displayed if the user has the GTM permission; all of the panels in the four subtabs are bound to the same permission. When the GTM tab in the upper row is clicked, Traffic always opens, no matter which subtab was opened before. The second row is displayed only while the GTM tab is selected.
There is no conditional panel in any of the four subtabs and no panel other than the panels in that subtab is offered in the Add Visualization menu. The separate query panels per record type (A Queries, AAAA Queries and the like) do not take place in any of the GTM subtabs; these panels are added only from the Add Visualization menu of the Summary tab.
Traffic Tab
There are 7 panels in the Traffic subtab. The DNS Queries by Country map has been placed at the beginning of the tab, one card wide and one card high; the other panels are one card in size as well. The card width changes according to the screen width: as many columns as the number of cards that fit side by side are opened and the cards fill the column.
DNS Queries by Country
Written All DNS Services above its title, this panel shows the country distribution of the queries coming to all the DNS services according to the location of the client IP on the world map. Every series corresponds to a country code; the queries coming from the local networks are gathered in the Local networks series and this series takes place in the legend even if its value is zero. The countries that have no value are not displayed in the legend.
As a summary, Last q/s, Avg. q/s, Total queries and Max. q/s come open; the map is colored according to the Total queries value. The legend is shown floating over the map instead of the footer row; in the legend only the country with the highest value is displayed directly, the remaining countries are kept folded and are listed by the legend being opened. In the panel, the Stat Table, Pie Chart, Bar Chart, Map and Heatmap views are offered; in the Heatmap view the 15 countries with the highest value are listed. For a single DNS service, see DNS Queries by Country.
DNS Query Rate
Shows the total of the UDP and TCP queries coming to all the DNS services (the Total Queries series). As a summary, Avg. q/s, Max. q/s and Total queries are printed in three separate sections; Last value is closed. Below the Max. q/s section the time at which the value was measured (such as * ~23h ago) is shown in small writing; in the Avg. q/s and Total queries sections the time is not written.
The panel is the same as the panel in the Summary tab; see DNS Query Rate. In the total version the Stat Table view is not offered; it is switched between the Digital, Line Chart and Mini Chart views. For a single DNS service, see DNS Query Rate.
DNS Query Protocol Distribution
Shows the distribution of the queries according to the transport protocol as two series: UDP Queries and TCP Queries. As a summary, only Total queries comes open; Last value, Avg. value and Max. value are opened from the strip.
In the panel, the Line Chart, Stat Table, Pie Chart and Bar Chart views are offered; in the line view the series are shown stacked. For a single DNS service, see DNS Query Protocol Distribution.
DNS Traffic Events
Shows the total of the two operation events produced on all the DNS services. As a summary, only Total events comes open. With the MAX badge to the left of the legend row, the peak value envelope of the series is opened; the envelope places the highest values behind the line that softens by being averaged when the selected time range is wide.
| Series | Meaning |
|---|---|
| Overload Drops | The queries dropped without being met because of an overload. |
| Notifications | The NOTIFY notifications that come for a zone transfer. |
In the panel, the Line Chart and Stat Table views are offered. For a single DNS service, see DNS Traffic Events.
DNS Answer Bandwidth
Shows the answer traffic produced by all the DNS services as a single series (the Total Answer Bytes series); the value is the total of the UDP and TCP answer bytes. As a summary, Last data/s, Avg. data/s and Total data come open; the rates are printed as data per second and the total as bytes.
In the panel, the Digital, Line Chart and Mini Chart views are offered. For a single DNS service, see DNS Answer Bandwidth.
DNS Bandwidth Protocol Distribution
Shows the distribution of the answer bandwidth according to the transport protocol as two series: UDP Answer Bytes and TCP Answer Bytes. As a summary, only Total data comes open. In the panel, the Line Chart, Stat Table, Pie Chart and Bar Chart views are offered. For a single DNS service, see DNS Bandwidth Protocol Distribution.
DNS TCP Connections
Shows the total of the TCP connections that are open at that moment to all the DNS services (the TCP Connections series). The value is not a counter but the number of connections at that moment. As a summary, only Avg. value comes open; Last value and Max. value are opened from the strip. To the left of the legend row there is the MAX badge.
In the panel, the Digital, Line Chart, Mini Chart and Stat Table views are offered. For a single DNS service, see DNS TCP Connections.
Responses Tab
There are 4 panels in the Responses subtab and all of them are one card in size. The panels show the error, recursion, response code and query type breakdowns of the DNS answers.
DNS Errors
Shows the total of the faulty and failed events produced on all the DNS services as four series. As a summary, only Total events comes open.
| Series | Meaning |
|---|---|
| Corrupt Packets | The corrupt DNS packets that cannot be parsed. |
| Timed Out | The packets that time out. |
| Server Failures | The packets that conclude with a server error. |
| Unauthorized | The packets that are not met because they are unauthorized. |
In the panel, the Line Chart, Stat Table, Pie Chart and Bar Chart views are offered. For a single DNS service, see DNS Errors.
DNS Recursion
Shows the total of the recursion activity as two series: Questions (the recursed queries) and Answers (the recursed answers). As a summary, only Total queries comes open. To the left of the legend row there is the MAX badge.
In the panel, the Line Chart and Stat Table views are offered. For a single DNS service, see DNS Recursion.
DNS Response Codes
Distributes the answers produced by all the DNS services according to the response code. The codes monitored are NOERROR, NXDOMAIN, SERVFAIL, REFUSED and NOTIMP; the codes outside these are gathered in the Other series and this series is hidden by default, it is opened by the legend item being clicked. As a summary, only Total queries comes open.
In the panel, the Line Chart, Stat Table, Pie Chart and Bar Chart views are offered. For a single DNS service, see DNS Response Codes.
DNS Query Type Distribution
Distributes the queries according to the DNS record type. The types monitored are A, AAAA, CNAME, MX, TXT, SOA, NS, SRV, PTR, ANY, CAA, DNSKEY, DS, HTTPS, SVCB, NAPTR and LOC; the types outside these are gathered in the Other series. By default only the A, AAAA, CNAME, MX and TXT series are displayed; the remaining types and Other are hidden and are opened by the legend items being clicked.
As a summary, only Total queries comes open. In the panel, the Line Chart, Stat Table, Pie Chart, Bar Chart and Heatmap views are offered; in the Stat Table view the table opens sorted from the largest to the smallest according to the Total queries column and grows up to two cards high as the content lengthens. For a single DNS service, see DNS Query Type Distribution.
Performance Tab
There are 3 panels in the Performance subtab and all of them have been placed as line charts. The panels show the efficiency of the packet cache and the query processing latency.
DNS Cache
Shows the total of the hit and miss rates of the packet cache as two series: Cache Hits and Cache Misses. The series are shown stacked; for this reason the MAX badge is not offered in the panel. As a summary, only Total events comes open.
In the panel, the Line Chart, Stat Table and Pie Chart views are offered. For a single DNS service, see DNS Cache.
DNS Cache Entries
Shows the total of the number of entries kept in the packet cache at that moment (the Cache Entries series). The value is not a counter but the number of entries at that moment. As a summary, only Avg. value comes open; Last value and Max. value are opened from the strip. To the left of the legend row there is the MAX badge.
In the panel, the Digital, Line Chart, Mini Chart and Stat Table views are offered. The equivalent of this panel belonging to a single DNS service does not take place in the ready tabs on the own dashboard of the service.
DNS Latency
Shows the average query processing latency (the Latency series). The value is measured in microseconds and is scaled automatically as µs, ms and s according to the magnitude. As a summary, only Avg. value comes open. To the left of the legend row there is the MAX badge.
Since the latency is an intensity value, it is not summed between the services, its average is taken; in the cluster setups the value of the two devices is not summed either, it is averaged. In the panel, the Digital, Line Chart, Mini Chart and Stat Table views are offered. For a single DNS service, see DNS Latency.
Forwarder Tab
There are 4 panels in the Forwarder subtab and all of them have been placed as line charts. The panels show the totals of the queries forwarded on the DNS services to which a DNS Forwarder Profiles profile is assigned.
The subtab is displayed on a device with no forwarder assigned as well
A forwarder profile being assigned to any of the DNS services on the device is not required for the subtab to be displayed; the subtab looks only at the GTM permission. If there is no forwarder on any service, all four panels are displayed but stay empty because no data is produced. The Forwarder tab on the dashboard of a single DNS service, on the other hand, is displayed only if a forwarder is assigned to that service.
Forwarder Query Rate
Shows the total of the queries forwarded on all the DNS services to which a forwarder profile is assigned (the Queries series). As a summary, only Total queries comes open. To the left of the legend row there is the MAX badge. In the panel, the Digital, Line Chart, Mini Chart and Stat Table views are offered.
Forwarder Bandwidth
Shows the bandwidth of the answers returning to the forwarded queries (the Answer Bytes series). As a summary, only Total data comes open. To the left of the legend row there is the MAX badge. In the panel, the Line Chart, Mini Chart and Stat Table views are offered.
Forwarder Cache
Shows the total of the hit and miss rates of the forwarding cache as two series: Cache Hits and Cache Misses. The series are shown stacked; for this reason the MAX badge is not offered in the panel. As a summary, only Total events comes open. In the panel, the Line Chart, Stat Table and Pie Chart views are offered.
Forwarder Latency
Shows the average processing latency of the forwarded queries (the Latency series). The value is measured in microseconds and is scaled automatically as µs, ms and s according to the magnitude. As a summary, only Avg. value comes open. To the left of the legend row there is the MAX badge.
The latency is not summed between the services, its average is taken; in the cluster setups the value of the two devices is averaged as well. In the panel, the Digital, Line Chart, Mini Chart and Stat Table views are offered.
Scope and Limits
INFO
- The tab is displayed with the GTM permission. All of the panels in the four subtabs are bound to the same permission; in a user who does not have the GTM permission the tab does not take place in the tab bar at all.
- The scope of the totals is all the DNS services. A service distinction is not made in the panels and there is no distribution table per service; for a breakdown on a service basis the Dashboard screen of the related service is used.
- The totaling method changes according to the panel. In the query, byte, event and response code panels the values of the services are summed; in the DNS TCP Connections and DNS Cache Entries panels the instantaneous numbers are summed; in the DNS Latency and Forwarder Latency panels the average is taken.
- The combining in a cluster changes according to the panel. In all the panels except the latency panels the values of the two devices are summed; in the latency panels they are averaged.
- The data is recorded once every five seconds. In the DNS metrics the five-second resolution goes 24 hours back, the per-minute resolution 14 days and the daily resolution 10 years. In the country breakdown, on the other hand, the five-second resolution is kept only for the last 60 seconds and the per-minute resolution for 1 day.
- The domain name and record breakdowns are not present in this tab. The Queries per Domain and Queries per Record panels are produced only on the dashboard of a single service; the metrics at the domain name and record level are not summed between the services. The DNS Uptime and DNS Memory panels do not carry a device-wide equivalent either, because they are process-based.
- The subtab selection is not remembered. At every click on the GTM tab in the upper row, Traffic opens; when another screen is gone to and it is returned to the home page, Summary opens.
- There is no passing to another screen from the cards. It is not passed from a panel to the dashboard of the related DNS service; for a single service the service is entered from the Service Management list.
- The panels being empty does not mean that the DNS service is not working. The panels take place in the tab even if there is no DNS service, forwarder or related traffic on the device. In the pie and bar charts that produce no data the
No-datatext is displayed together with a pale placeholder icon, and in every section of the numerical panels only the placeholder icon; in the line charts the axis stays empty.
