
Smarter by Design.Simpler for Business
Quarantine History
What Is Quarantine History?
Quarantine History records every source that L4 DDoS protection puts into quarantine on a route table as a persistent log and lists it for the selected date range. Each row is one quarantine entry: the IP address and country of the source, the rule that sent it to quarantine, the limit of the rule at that moment, the quarantine duration and the time at which the source will leave quarantine are written together.
This screen is the retrospective counterpart of the quarantine table in L4 DDoS Live View. Live View shows only the sources that are in quarantine right now; a source whose duration expires drops from there. Quarantine History, in contrast, keeps every source that entered quarantine, also after its duration expires; the question "which addresses were quarantined last night and because of which rule" is answered here.
Entry
Recording Moment
A row is written when the source enters quarantine
7 Days
Default Range
Changed with the date range selector
5 s
Detection Step
Quarantine lists are read every five seconds
Log Forwarding
To External Systems
Records can also be sent to the selected log destinations
Only quarantine entries are recorded
The log records the entry of a source into quarantine; the release is not written as a separate row. The Released At column of each row already carries the time at which the source will leave when its quarantine duration expires.
When Is a Record Created?
The device reads the quarantine lists of the route table every five seconds and compares each reading with the previous one. A row is written for every source that was not present in the previous reading. For this reason the time in the Date column is at most five seconds after the moment the source was added to the list.
The following cases are not reflected in the history as rows:
| Case | Result |
|---|---|
| The source is removed from quarantine manually in L4 DDoS Live View, or the quarantine list of a rule is emptied | The row in the history does not change; Released At continues to show the planned release time. The operation is recorded on the User Logs screen. |
| The quarantine duration expires | No separate row is written; the release time is in the Released At column of the entry row. |
| The source enters and leaves quarantine between two five-second readings | No record is created. |
| Quarantine monitoring restarts (e.g. device startup) | The sources in the list at that moment are counted as the initial state in the first reading and are not written as rows; only the entries that arrive afterwards are recorded. |
| A single quarantine list (per rule and IP version) contains more than 5000 sources | The sources above 5000 in the list are not read and therefore not recorded. |
Log forwarding uses the same entries
If Quarantine Log Forwarding is defined on the route table, every entry written to this screen is also sent to the selected log destinations. Forwarding is also done only on entry into quarantine. At most 200 records per second are sent to each destination; the records that exceed this limit are not forwarded but continue to be present on this screen.
Accessing Quarantine History
- Left Monitor Panel is opened.
- Route Tables & L4 DDoS is selected from the category tabs at the top left.
- The route tables defined on TR7 are listed.
- The route table to be monitored is clicked; the screen opens with the Dashboard tab that carries the name of the route table.
- On the screen that opens, the Quarantine History tab is clicked.
The tab is visible to every user who has permission to view the route table. When the screen opens, the records of the last seven days are loaded automatically.
Quarantine History Listing Screen
The quarantine history of the selected route table is listed according to the date range.
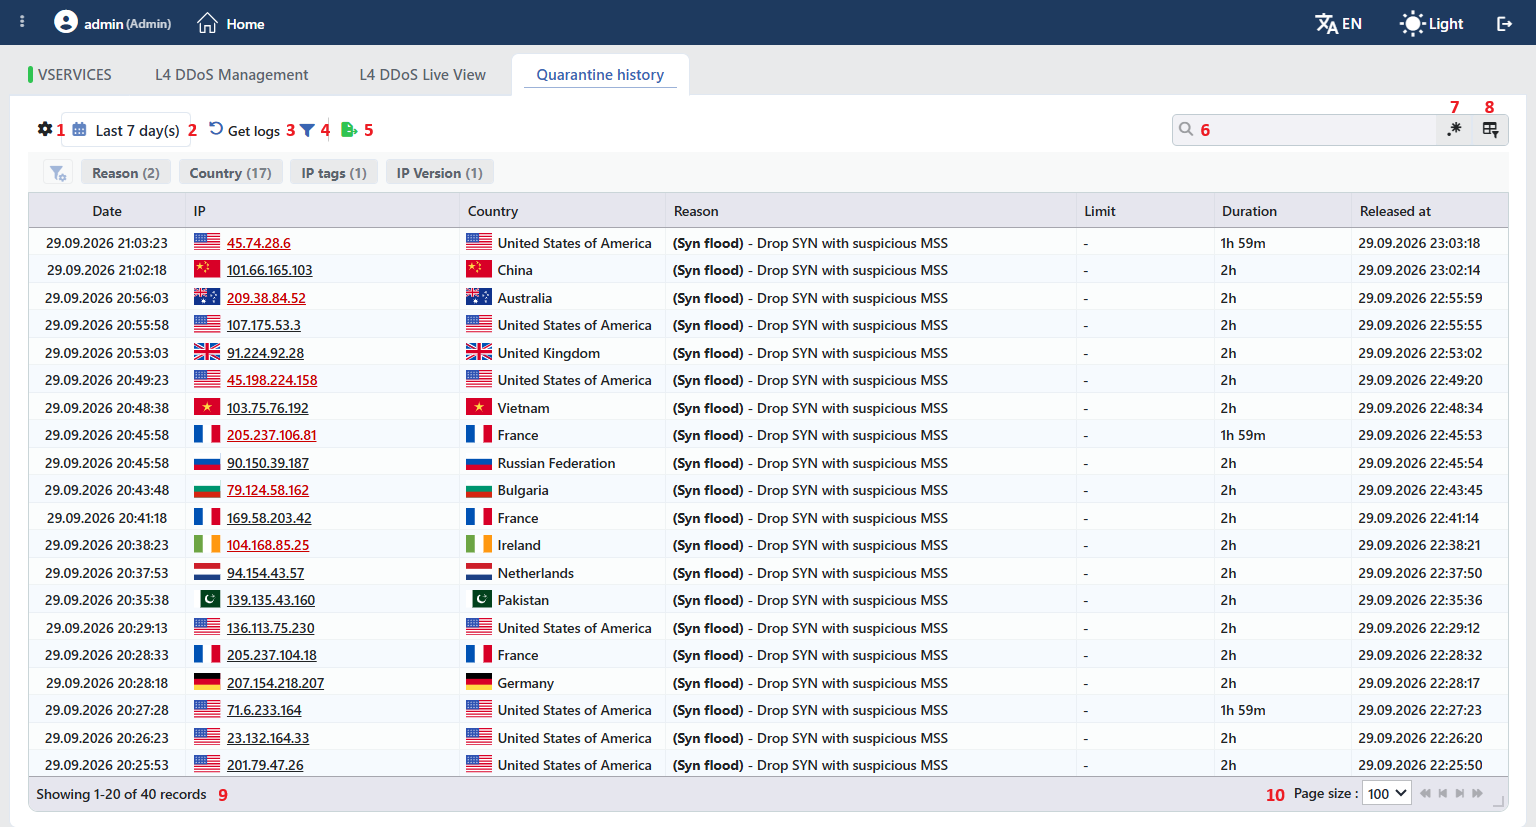 Quarantine History Listing Screen
By default the table opens with the following columns:
| Column | Description |
|---|---|
| Date | The date and time at which the entry of the source into quarantine was detected. |
| Source | The name of the TR7 device that wrote the record. Displayed only in a cluster installation. |
| IP | The quarantined source address, with its country flag. If the address is on the IP Intelligence & Reputation blacklist it is written in red, if it is on another blacklist in orange, and if it is on a whitelist in green; if it matches an IP Tag, the icon is displayed next to it; a tagged address without a list state is written in the tag color, and an untagged address in the default color. The color shows the state at the moment the screen is opened, not the state at the moment the source entered quarantine. |
| Country | The country of the source. For addresses whose country cannot be resolved, - is written. |
| Reason | The full name in the interface of the rule that sent the source to quarantine; the bold part of the name gives the family of the rule or the attack type (e.g. (Syn flood) - Drop SYN with suspicious MSS, Christmas Tree attack protection). |
| Limit | The limit of the rule at the moment the source entered quarantine: <value>/s for rate rules, <value> concurrent for connection rules. For signature-based rules (e.g. suspicious MSS, invalid flags, port scan) there is no limit, so - is written. |
| Duration | The time the source will stay in quarantine (e.g. 2h). Since detection is made in five-second steps, the duration may appear a few seconds below the quarantine duration (e.g. 1h 59m). |
| Released At | The time at which the source will leave when its quarantine duration expires. For sources that are still in quarantine it shows a future date; for sources removed manually it also continues to show the planned time. |
The following column is hidden by default and is added from the column selector:
| Column | Description |
|---|---|
| IP Version | The IP version of the source: IPv4 or IPv6. |
Clicking a row does not open a preview panel, and there is no row right-click menu. The records are only displayed; the operations of removing from quarantine and adding to the exemption list are on the L4 DDoS Live View screen.
The items in the toolbar are located from left to right in the following order; the last two items (Page Information and Page Size) are in the information strip below the table.
Columns
Which columns are shown in the table is selected; the columns other than IP Version are on by default. In the same panel, columns are reordered by dragging and alignment is selected per column; the row height is fitted to the page with the Fit rows to the page button, and the column layout is reset to default with the Reset button. Clicking the width badge next to a manually widened column returns the column to automatic width. The column selection is stored per user.
Time Range
The time range in which the logs will be displayed is selected. The preset ranges are: 5 min · 15 min · 30 min · 1 hour · 3 hours · 12 hours · 1 day · 3 days · 7 days · 1 month · 3 months; in addition, Custom Duration (free duration) and Custom Date Range (start-end from the calendar) are used. The default value is Last 7 day(s). When the range is changed, the records are reloaded.
Get Logs
Reloads the records in the selected time range from the server. The list is not updated automatically; to see the new sources entering quarantine while the screen is open, the button is clicked again. While loading is in progress, the button stays passive.
Filter
The Filter button opens and closes the filter strip; on this screen the strip comes open by default. The order of the cards is changed by dragging and stored per user. The cards are explained in the Filter Strip section.
Export
The table is exported as Excel, CSV or PDF by clicking the Export button. In the window that opens, the Filename, Format and Data Source, together with the Columns to be exported, are determined; the remaining fields are displayed according to the format: CSV Separator for CSV, Excel Sheet Name for Excel, and Page Orientation and Page Size for PDF.
Search
Used to search all information in the table.
RegExp Search
Used to search all information in the table with a regular expression (RegExp).
Column Based Search
Used to perform a column-based search on the information in the table.
Page Information
Contains information about the total number of loaded records and the range of records displayed in the list: Showing N-M of T records. If there are no records, No records to show is written; if no record matches the search, No results for the search query is written.
Page Size
The maximum number of records to be displayed on the page is selected. The default is 100; the options are 5, 10, 20, 50, 100, 200, 500 and All.
Filter Strip
Every card in the strip is generated from the loaded records; the number next to a card is the number of distinct values that can be selected in that card. When selections are made in more than one card, the selections are applied together.
| Card | Contents |
|---|---|
| Reason | The rules that sent the sources to quarantine; more than one rule can be selected. |
| Country | The countries of the sources; a search is made inside the card and more than one country can be selected. |
| IP Tags | The IP Tags that match the source addresses; for untagged addresses there is a No Tags option. When the tag of a wide block is selected, the sources that carry the tag of a narrower block inside it also remain in the list. |
| IP Version | IPv4 or IPv6. |
| Device | The TR7 device that wrote the record. Displayed only in a cluster installation. |
Clicking an IP Address
When the pointer is moved over an address in the IP column, a small window opens that shows the location, ASN, network type and, if any, tag information of the address. When the address is clicked, the <ip> details window with the same information opens; this window contains the following operations for the address:
| Operation | What it does |
|---|---|
| Add IP Tag | Gives the address an IP Tag; if the address has a tag of its own, it takes the name Edit IP Tag. |
| Add to Blacklist (IP Intelligence) | Adds the address to the IP Intelligence & Reputation blacklist. If the address is a manually added blacklist entry, Remove from Blacklist (IP Intelligence) is displayed; for the addresses that come from the threat database there is no removal button. |
| Add to Whitelist (IP Intelligence) | Adds the address to the IP Intelligence & Reputation whitelist; if the address is a manually added whitelist entry, Remove from Whitelist (IP Intelligence) is displayed. |
The operations other than Add IP Tag are applied after a confirmation question with the IP address: <ip> (<country>) line below it; the question texts are listed on the IP Intelligence & Reputation page. These operations change the IP Intelligence & Reputation lists; they do not change the L4 DDoS quarantine or the L4 DDoS exemption list.
Cluster Behaviour
In a cluster installation, every TR7 device keeps its own quarantine entries in its own log. The screen lists the records of the two devices merged; the device a record comes from is displayed in the Source column and in the Device filter card.
Scope and Limits
INFO
- The history is kept per route table; the screen shows only the records of the route table on which it was opened.
- Rows are written only on entry into quarantine. Manual removal and list emptying operations do not change the history; these operations are seen in User Logs.
- The color and tags in the IP column belong to the moment the screen is opened, not to the moment of the record.
- The records are fed by the same detection as the quarantine graphs in Dashboard; quarantines lasting less than five seconds are not visible on either screen.
