
Smarter by Design.Simpler for Business
WAF Report
What Is WAF Report?
WAF Report is the report screen that gathers the WAF activity of a vService in the selected period in a single document. While Dashboard shows the instant state and Event Logs the individual requests, the report summarizes the whole of a period: how many attacks have been caught, which signatures have been triggered, from which countries the attackers have come, which OWASP items and CWE weaknesses they correspond to.
The report is produced in three formats. The HTML report opens on the screen interactively and is for examining; PDF produces a document with a cover and a table of contents to be presented to the management; XLSX, on the other hand, writes every breakdown to a separate sheet and makes the data processable with other tools.
The actual value of the screen is that it turns the raw data the security team looks at into a document the management can read. The answer to the questions "how many attacks were blocked last quarter, which vulnerability classes did they correspond to, where did the attackers come from" is given with a single document, without screenshots being collected and without a table being combined manually. With its cover that carries the organization logo, the PDF output enters the audit and reporting processes as it is.
The filter support narrows the same document down to a single event: the report of a certain source address, of a certain signature or of a certain path can be produced separately. Thus the output of an incident examination can be shared without the noise in the rest of the period.
The reporting is not configured and turned on separately: in every vService with WAF protection enabled, it is produced from the logs that vService already keeps.
3
Output format
HTML on the screen, PDF for the management, XLSX for the data
6
HTML view
Overview, Attacks, Classification, Traffic, Client, Country
Instant
No queue
The report is produced together with the request, it is not waited for to be ready
Filtered
Targeted report
By being narrowed down to ten condition groups, a single event can be reported
With a cover
Corporate PDF
The organization logo, the table of contents and the sections per host group
Cluster
A single document
The records of the two devices are combined and a single report is produced
Included
Not a separate module
It is used in every vService with WAF protection enabled without being turned on separately
Host Group
Examination with a breakdown
In the vServices with many domain names the report is examined on a group basis
The reports are not stored on the device
The produced report is not archived and a list of the past reports is not kept. The HTML report lives only in the open tab; when the tab is closed or the page is refreshed, it disappears. The PDF and XLSX outputs are downloaded to the browser. When the same report is needed again, it is produced again.
If a report sent by e-mail at regular intervals is wanted, Periodic Reporting is used.
How to Access?
The report opens as a WAF Report tab that can be closed on the WAF screen of the vService. There are two doors that open the tab:
| Door | Behavior |
|---|---|
| The For Detailed Analysis → WAF Report shortcut on Dashboard | The time range selected on the Dashboard is handed over to the tab and the Date field in the report form comes filled with this range. |
| The Generate Report link on the Periodic Reporting card on the WAF Management screen | It opens the same tab; it can be used while the card is off as well. |
If the tab is already open, it preserves its own time range; the range is handed over only while the tab is being opened for the first time. The handover is made only while a relative range (such as the last 1 day) is selected on the Dashboard; a range selected by giving a start and end date is not handed over and the form opens with a default one day.
 The WAF Report Tab
When the tab is opened for the first time there is no report yet; on the screen only the Generate Report button and the information No report yet — generate one and it will appear here. are displayed.
The Generate Report Screen
When the Generate Report button is clicked, the form titled WAF Report opens. The selections made in the form are remembered per user and come with the same values at the next opening.
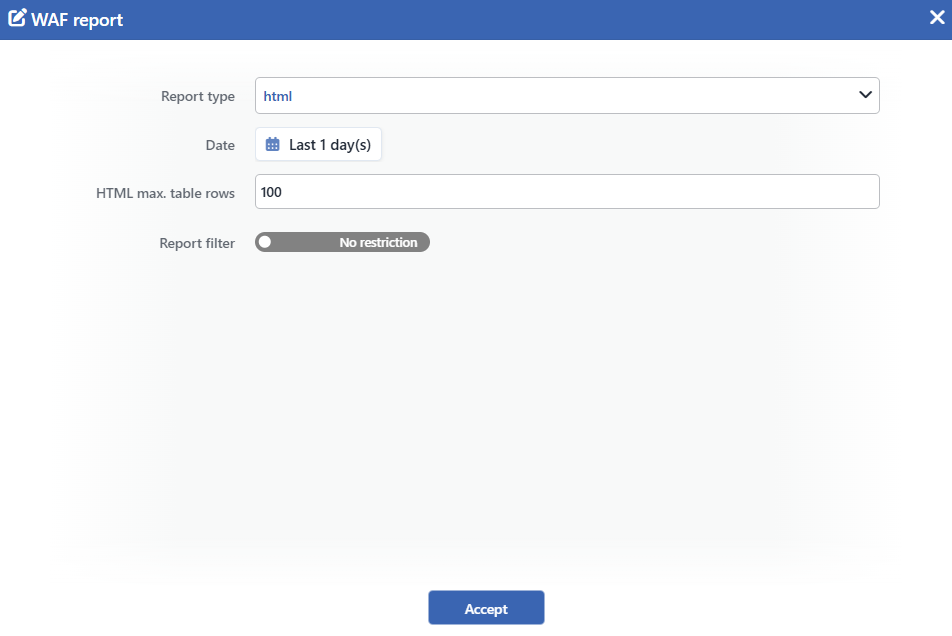 The Generate Report Form
INFO
Report Type Default: html
The format of the report is selected: html, xlsx or pdf.
When html is selected, the report is displayed interactively inside the tab. In the pdf and xlsx selections the report is produced as a file and is downloaded to the browser.
INFO
Date Default: 1 day
The time range the report will cover is selected. The ready ranges are offered from one hour to three months; additionally a custom duration in minutes, hours, days, weeks and months or an absolute date range in the DD.MM.YYYY HH:mm form can be entered.
If the tab has been opened from the shortcut on the Dashboard, the field comes filled with the range selected on the Dashboard.
INFO
Report Language Only pdf and xlsx
The language of the report is selected. The field is displayed only when xlsx or pdf is selected as the Report Type; since the html report always uses the interface language, it is not shown in that type.
When Default is selected, the report is produced in the interface language of the user who makes the request.
INFO
Max. Table Rows HTML default: 100
It determines at most how many values will be carried into the report for every breakdown. The field is displayed as HTML Max. Table Rows, XLSX Max. Table Rows or PDF Max. Table Rows according to the selected output format; only the relevant one of the three is shown.
At least 5 can be entered. When the field is left empty, 100 is used. Only the HTML field opens filled with the value 100; the XLSX and PDF fields come empty.
This value is not the same thing as the number of rows printed into the document: in PDF every table shows at most 10 rows (25 in the breakdowns that have no graph), and in XLSX up to 1,000 rows are written. Enlarging the field widens the value set the report calculates, it does not lengthen the PDF tables.
INFO
Report Filter Default: No Restriction
It is determined from which attack records the report will be produced.
| Option | Meaning |
|---|---|
| No Restriction | All the attack records in the period enter the report. |
| Select | The same condition builder as the one on the Event Logs screen opens; up to ten and/or condition groups can be defined. The report is produced only from the attack records that match the filter. |
In the filtered reports the Filtered Report badge and the summary of the filter are displayed above the document.
The filter is applied only to the attack tables
In a filtered report the traffic graphs continue to show all the traffic; the filter narrows the attack tables. For this reason in a filtered report the total number of requests and the attack numbers do not come from the same set.
INFO
Accept
The report production is started by clicking the Accept button. The form closes with this click; the production continues not in the background but in the same request. The waiting is shown by the Generate Report button on the toolbar: during the production it turns into a spinning symbol and stays passive.
The Production of the Report
The report is produced at the same time as the request: it is not taken into a job queue in the background, it is not waited for to be ready. During the production the Generate Report button on the toolbar stays passive and shows a spinning symbol.
The waiting time of the request changes according to the format: five minutes is waited for the HTML report, and thirty minutes for PDF and XLSX.
In the cluster setups the records of both members are combined and a single report is produced. If the peer device cannot be reached, the report is produced only with the data of the local device and this situation is not stated separately in the document.
The PDF and XLSX outputs are downloaded to the browser named in the pattern WAF_<vService name>_<start> - <end>.
The source of the data
The report is produced from the WAF event logs and is based on the same data as the Event Logs screen; since the working mode of the host group determines the log production, it directly affects the report as well.
The reading is done per hour file: for the hours older than two hours the summaries prepared beforehand are used, and the last two hours with the incomplete hours at the ends of the range are read directly from the log. In the filtered reports the summaries cannot be used at all, every line is scanned one by one; for this reason a filtered report is noticeably slower than an unfiltered one.
The total request number in the PDF and XLSX summary comes from the traffic counters. The number in the blocked request box, on the other hand, is the count of the WAF log records; the graph in the same box is drawn from the traffic counters, therefore the number and the graph are based on different sources.
The suppressed records are counted in the unfiltered report
The suppression conditions on the Log Settings screen affect the report differently from the Event Logs list: the report produced unfiltered counts the suppressed records as well, and the filtered report skips them.
The result of this is that the totals of the unfiltered and filtered reports produced for the same period can differ not only because of the filter but also because of the suppression.
The HTML Report
The HTML report is presented inside the tab with six views:
| View | Content |
|---|---|
| Overview | The summary indicators (Total Attacks, Unique Attacker IPs, Attacking Countries, Triggered Rules, Top CWE) with the world map and the country table that show the country distribution of the attacks. |
| Attacks | The Attack ID, rule and scope, argument, attack field and risk level breakdowns of the attacks. |
| Classification | The OWASP Web, OWASP API, CWE, CAPEC, MITRE ATT&CK, category and target classifications; every one of them is presented with a graph. The table that carries the identity and name columns together is present only in the OWASP Web, OWASP API, CWE, CAPEC and MITRE ATT&CK breakdowns; the category and the target come with a table with a single label. |
| Traffic | The HTTP(s) method, the path, the body length, the WAF processing time and the distribution of the attacks according to the hours of the day. The last breakdown is not a timeline, it shows the 0–23 hour slices and is presented only as a graph. |
| Client | The user-agent information of the attackers and the visitor tables (IP, country, user-agent). |
| Country | The world map, the country distribution table and the attacker IP table with a country column. |
If more than one Virtual Host Groups is defined in the vService, with the host group selection above the report the breakdown is examined on a group basis. On the screen there is no combined view of the groups: all the values and the summary indicators shown are the figures of the selected group. The total of the groups takes place only in the summary section of the PDF and XLSX outputs.
The PDF and XLSX Outputs
INFO
PDF
The document consists of the following sections:
- The cover: the organization logo in the Localization settings, the vService name and the report range. If the report is filtered, the filter note also takes place on the cover.
- The table of contents
- Report Summary: the total and blocked request graphs, the country map of the attacks and the most intensive attack signatures. If there is more than one host group, the group comparison table is added as well.
- The detail sections per host group: the own breakdowns of every group. In the graphs the values whose share stays below 2% are gathered in a single Others item; this combining is applied in all the breakdowns except the hour distribution.
INFO
XLSX
Every breakdown is written to a separate sheet. At the beginning of the file there is a summary sheet that contains the report range, the filter applied and the totals. In the XLSX output the cover and the logo do not take place.
Scope and Limits
INFO
- The report scope is a single vService. This screen reports only the data of the vService that is open. The version that covers all the vServices with WAF protection on the device is explained on the Global WAF Report page.
- Its relationship with the scheduled reports. The e-mail report sent with Periodic Reporting is produced from the same template, but it does not use the filter and format selections made on this screen; it is produced with the standard scope and in the default interface language of the device.
- The tab is not permanent. WAF Report is a tab that can be closed. When it is closed or the page is refreshed, it is not created again; the report disappears with it as well.
