
Smarter by Design.Simpler for Business
Advanced Traffic Inspection
What Is the Advanced Traffic Inspection Action?
The Advanced Traffic Inspection action makes it possible to monitor and analyze the traffic passing through the vService in real time. This action collects the traffic statistics in a table according to the specified keys (IP, port, host, etc.) and enables these data to be displayed live.
The Advanced Traffic Inspection action can only be used for analyzing the traffic according to the specified keys. On its own, it cannot manipulate the traffic in any way. Thanks to the Traffic Tag feature with Tracking Condition, operations such as blocking, showing content and redirecting can be performed when abnormal traffic is detected from the tracked information.
This action can work at the request or the response stage and can collect traffic statistics in both directions.
The Importance of the Advanced Traffic Inspection Action
Traffic monitoring is critically important for performance analysis, security detection and capacity planning. Thanks to this action, how much traffic comes from which sources, the error rates and the connection states can be displayed in real time.
The Advanced Traffic Inspection action;
- provides real-time traffic statistics,
- can monitor on an IP basis or on a multiple-key basis,
- collects different metrics for HTTP and TCP traffic,
- helps to detect abnormal traffic patterns,
- can be used in DDoS or brute-force attack detection,
- provides data for capacity planning.
For this reason, the Advanced Traffic Inspection action is a powerful tool for operational visibility and security analysis.
The Use of the Advanced Traffic Inspection Action
The Advanced Traffic Inspection action is used in order to monitor the traffic through the desired Fields to Track key information, such as the client IP address, the User-Agent and the HTTP Host header information, during the defined period, and to record it statistically. This action serves only a tracking and measurement function; on its own, it does not perform any traffic manipulation such as blocking, redirecting or showing content.
A Traffic Tag is assigned to the tracking table created within the scope of this action. The related keys (IP, User-Agent, Host, etc.) are monitored grouped under this tag and the data obtained is for reference purposes only.
These tracked data are evaluated in actions such as blocking, redirecting and showing content by using Tracking Condition. For example, while the Block action is being defined, Tracking Condition is selected as the condition, and in this condition, the Traffic Tag created in the Advanced Traffic Inspection action is entered in the Tracked Table field.
The metrics monitored within the scope of Tracking Condition are as follows according to the vService type.
HTTP vService
| Metric | Description |
|---|---|
| HTTP requests | The number of HTTP requests in the specified period |
| HTTP errors | The number of faulty HTTP requests in the specified period (4xx) |
| Incoming data (B) | The total data received during the specified period (bytes) |
| Outgoing data (B) | The total data sent during the specified period (bytes) |
| Total connections | The total number of connections in the specified period |
| Current connections | The instantaneous number of active connections; in HTTP vServices this counter can remain 0 because of a technical restriction; thresholds must not be set on this metric in HTTP |
L7 TCP vService
| Metric | Description |
|---|---|
| Incoming data (B) | The total data received during the specified period (bytes) |
| Outgoing data (B) | The total data sent during the specified period (bytes) |
| Total connections | The total number of connections in the specified period |
| Current connections | The instantaneous number of active connections; in HTTP vServices this counter can remain 0 because of a technical restriction; thresholds must not be set on this metric in HTTP |
Thanks to this structure, by defining a threshold value such as HTTP requests > 100, the clients for which abnormal traffic behavior is detected within the specified period are blocked with the Block action.
In summary, the structure works in two separate stages:
1. Advanced Traffic Inspection
Condition: Always or a desired condition (e.g. `path → /login.php`)
Purpose: To monitor the traffic and collect statistics under the Traffic Tag.
Purpose: To monitor the traffic and collect statistics under the Traffic Tag.
2. Block (or a similar action)
Condition: Tracking Condition
Purpose: To make a decision by using the data obtained from the Advanced Traffic Inspection action.
Purpose: To make a decision by using the data obtained from the Advanced Traffic Inspection action.
Thanks to this approach, the traffic tracking and action application processes are separated from each other, and a more controlled, flexible and scalable traffic management is provided.
Supported vService Types
HTTP
L7 TCP
Network
Execution Timing
On Request
On Response
How to Add?
A new Advanced Traffic Inspection Action can be added through the TR7 web management interface by following the steps below:
- The Configuration Menu is opened by clicking the TR7 logo at the bottom left.
- The Load Balancer → Actions → Add steps are followed.
- A unique and descriptive name is entered for the action.
- Advanced Traffic Inspection is selected as Action Type.
- The related configurations of the action are made.
- In the Conditions tab, the condition/conditions under which the action takes effect are determined.
- The action is added by clicking the
Addbutton.
Advanced Traffic Inspection Action Add Form
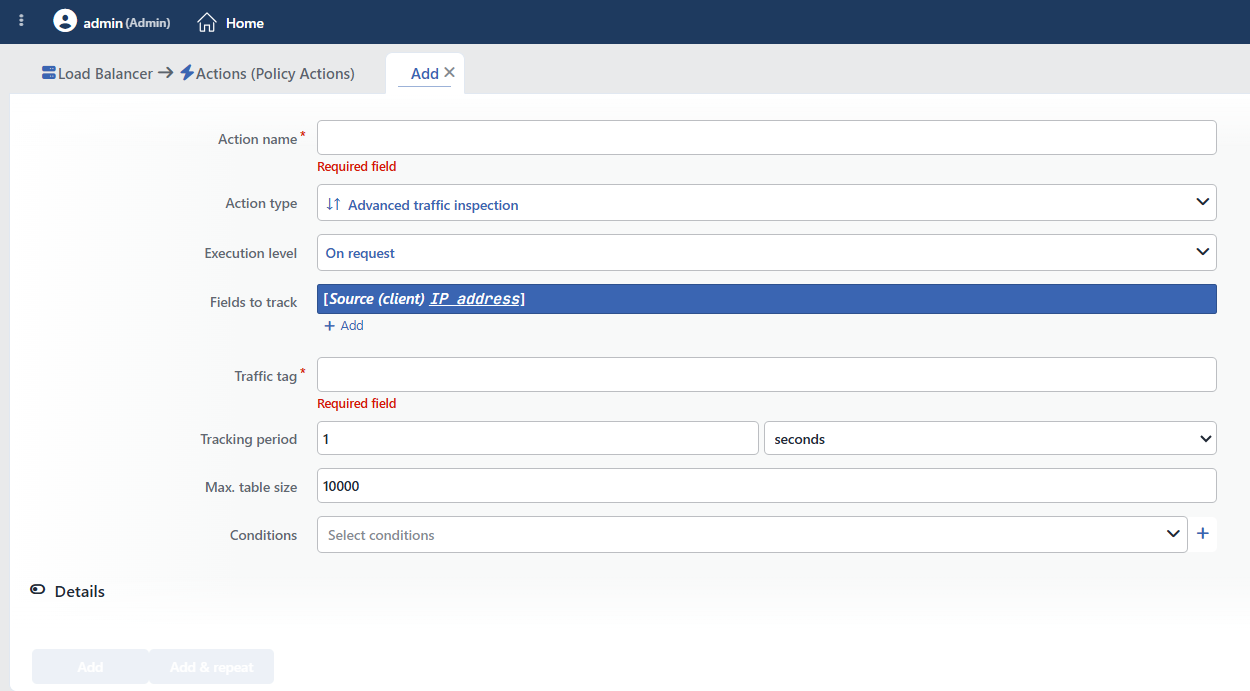 Advanced Traffic Inspection Action Add Form
INFO
Execution Level
Determines at which stage the action is run.
- On Request: The action is applied before the request is forwarded to the related Backend Service. This level is used in cases where changes need to be made to the request or additional information needs to be passed to the Backend Service.
- On Response: The action is applied before the response is forwarded to the client. This level is used in cases where edits or additions need to be made to the response sent to the client.
TIP
In both options, all the metrics (incoming/outgoing data, the number of connections, etc.) are collected. The selection determines at which point the statistics will be updated.
15 Tracking Tables per vService
At most 15 Advanced Traffic Inspection rules can work in a vService. When the limit is exceeded, the table of the overflowing rule is not created at all; the rule (and the Tracking Condition conditions bound to it) is silently disabled and the situation is written only to the system logs.
INFO
Fields to Track Required
According to which key or keys the traffic statistics will be grouped is selected in this field; at least one key must be selected. Composite keys can be created by selecting more than one field.
Each row added to the list opens the Add variable / Edit variable window when it is clicked. In this window:
- Variable name: The smart variable to be used as the tracking key is selected from the searchable list (e.g. Client IP address, Request HTTP header content).
- The argument field of the variable: If the selected variable takes an argument (e.g. the header name for an HTTP header, the cookie name for a cookie), the related field opens and the value is entered.
- Add functions: The value is passed through one or more smart functions before being tracked (e.g. converting to lowercase, taking the first N characters). The functions are applied in order.
- Summary: The readable preview of the variable resulting from the selections made is shown.
- The window is closed with the
Submitbutton and the variable is written to the row.
Commonly used smart variables:
- Client IP address: Group according to the client IP address
- Client port number: Group according to the client port
- Destination IP address: Group according to the destination IP
- Destination port number: Group according to the destination port
- Request HTTP header content (
host): Group according to the HTTP Host header (HTTP only) - Request HTTP header content (
user-agent): Group according to the browser/client type (HTTP only)
TIP
This field supports Smart Variables. Existing variables can be accessed with the fx button and dynamic content can be created.
When more than one field is selected, the combination of these fields is used as the unique key. For example, when IP + User-Agent is selected, the traffic coming from the same IP with different browsers is monitored in separate rows.
Detailed information is on the Variables page.
INFO
Traffic Tag Required
A descriptive tag is entered for this monitoring rule. The tag must be 3-20 characters long, must contain only letters, digits, - and _, and must be unique among all the actions. The defined Traffic Tag is used by being referenced in the Tracked Table field within Tracking Condition.
TIP
Sample tags:
API_TRAFFIC: For monitoring the API trafficLOGIN_MONITOR: For the login page trafficSTATIC_ASSETS: For the static file traffic
INFO
Tracking Period
The time window in which the statistics will be calculated is determined; all the metrics are counted over this window (e.g. if the period is 1 minute, "HTTP requests" is the number of requests in the last 1 minute). Seconds, Minutes, Hours or Days can be selected as the unit. The record of a key lives in the table for as long as the period after its traffic stops, and then it drops.
TIP
- Short period (1-5 seconds): Catches instantaneous traffic changes, it is ideal for DDoS detection.
- Medium period (30 seconds - 1 minute): It is suitable for monitoring general traffic patterns.
- Long period (5+ minutes): It is used for long-term trend analysis.
INFO
Max. Table Size
The maximum number of unique records (rows) that the traffic table can hold is determined. When the table is full, the oldest records are deleted automatically.
Valid range: 5 - 1000000 · Default: 10000
WARNING
Large table sizes consume more memory. A balanced value should be selected in high-traffic environments.
TIP
- Low traffic (< 1000 clients): 5,000 - 10,000
- Medium traffic: 50,000 - 100,000
- High traffic (DDoS protection): 500,000 - 1,000,000
INFO
Conditions
In this field, it is defined under which condition or conditions the related action takes effect.
By adding one or more conditions, the behavior can be applied in a targeted and controlled way with the and/or structure.
Detailed information about conditions is on the Conditions page.
WARNING
If no condition is defined in this field, the related action runs unconditionally (Always). In this case, the action is applied to all traffic coming to the related vService.
In live environments, using an action without defining a condition can lead to unexpected situations (service outages). For this reason, it is recommended that at least one condition always be defined when an action is created.
INFO
Details
The Details section at the bottom of the form contains the advanced settings.
Rule Protocol
Determines whether the action will work in the HTTP or the TCP context; it cannot be changed after saving and, if the action is added from within a vService, it comes automatically according to the type of that vService. This selection also determines the set of metrics stored: when TCP is selected, the HTTP metrics (HTTP requests, HTTP errors) are not collected at all.
INFO
Form Buttons
Add
The action adding process is completed by clicking the Add button.
Add & Repeat
With the Add & Repeat button, the action adding process is completed, and another new action can be added with different configurations without leaving the related window.
 Action Added
How Are the Collected Data Viewed?
The data collected by the Advanced Traffic Inspection action can be viewed from the Logs & Tracking tab of the vService.
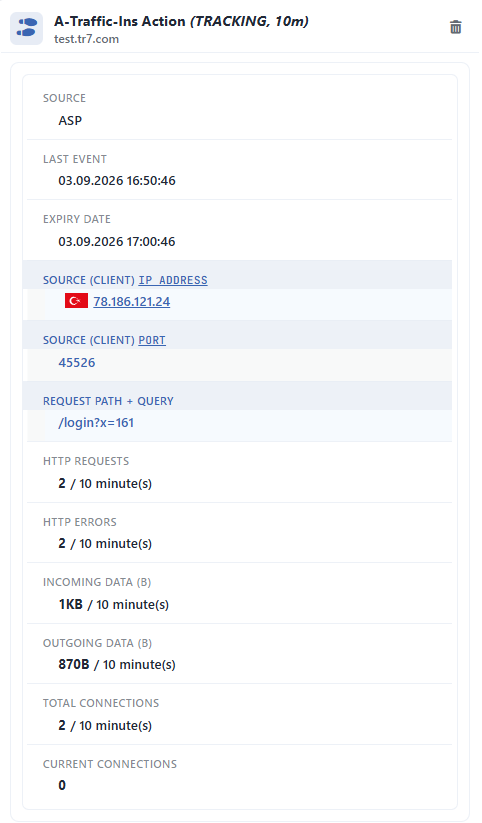 Traffic Monitoring Data View
1
Step 1 Go to the vServices screen
The Load Balancer → Load Balancer vService List path is followed in the TR7 web interface.
2
Step 2 Open the Logs & Tracking tab
The related vService is selected from the list and the Dashboard icon is clicked, or the related service under vServices is selected directly from the left menu. With both methods, the Dashboard screen of the related vService is reached and the Logs & Tracking tab is opened.
3
Step 3 Select the table
The traffic table is selected from the dropdown menu at the top left; the table is listed in the form action name (TRACKING, period).
4
Step 4 Load the data
The table data is loaded automatically. The Refresh button is clicked in order to update the table manually.
Tracking Logs: Table Columns
| Column | Description |
|---|---|
| Last event | The time of the last activity for this record |
| Expiry date | The time when the record will be deleted from the table |
| (key columns) | Each selected Fields to Track key becomes a separate column with its own short name (e.g. ↓IP, ↓Port, ↓PathQ) |
| ↓Request | The number of HTTP requests (HTTP only) |
| ↓Request.error | The number of faulty HTTP requests; 4xx (HTTP only) |
| ↓Data | The amount of incoming data |
| ↑Data | The amount of outgoing data |
| ↓Connection | The total number of connections |
| ↓Connection.current | The instantaneous number of connections (can remain 0 in HTTP) |
For a detailed description of the columns, the Advanced Traffic Inspection (Tracking) Logs page can be referred to. The counters are kept synchronized between the devices in cluster installations.
Operational and Safe Usage Recommendations
- A Key Suitable for the Purpose Should Be Selected. The correct key selection according to the monitoring purpose is critical: only the IP address for DDoS detection, IP + User-Agent for bot detection, IP + Host + URL Path for API usage analysis.
- The Period Should Be Set According to the Purpose of Use. Short periods (1-5 seconds) should be preferred for security monitoring, and long periods (1+ minutes) for trend analysis.
- The table size is set according to the traffic. By estimating the number of unique clients, a size at which the table will not overflow is selected. A full table deletes the old data for new records.
- Targeted monitoring is performed with conditions. When targeted monitoring is performed with specific conditions (e.g. specific URL paths, specific Host headers) instead of monitoring all the traffic, more meaningful data is obtained.
- The HTTP Metrics Should Be Used in HTTP vServices. The HTTP Requests and HTTP Errors metrics collected in HTTP vServices are very valuable for detecting application layer problems. High error rates can indicate Backend Service problems.
- Multiple monitoring with different tags. More than one monitoring action can be created on the same vService with different conditions and different keys; a unique Traffic Tag is used for each of them.
