
Smarter by Design.Simpler for Business
Advanced Captcha (Quarantine) Logs
What Are Advanced Captcha (Quarantine) Logs?
Advanced Captcha (Quarantine) Logs are the live content of the quarantine stage of the Captcha Quarantine feature of the Advanced Captcha action assigned to a vService. They list the clients that have exceeded the threshold (Quarantine Failure Threshold) by repeatedly failing CAPTCHA verification and are actually in quarantine at the moment.
Each row represents a client in quarantine (by default Client IP, or the keys selected with Tracking Type) and shows the Quarantine Start (entry into quarantine) and Quarantine Expiry (exit from quarantine) times. The client is blocked for the defined time (Quarantine Duration); when the time expires, it is released automatically.
This is a membership table; the Incorrect column, which shows the number of failed CAPTCHAs, and the other tracking metrics are not present here: only which client was quarantined when and when it will exit are included. Clients that are tracked but not yet quarantined are listed in the Advanced Captcha (Tracking) Logs view.
Active Quarantine
Currently blocked
Clients in quarantine
Bot Blocking
CAPTCHA failed
Clients exceeding the threshold are in quarantine
Time-Limited
Quarantine Duration
Released automatically when the time expires
Membership Table
No counters
Quarantine start and end time
Release
Remove from Table
Can be removed before the time expires
HTTP Only
Web traffic
CAPTCHA only in HTTP vServices
Quarantine Logs are not a recorded history log; they are the current content of the quarantine table. Records drop from the table when the Quarantine Duration expires, and the client is released.
Supported vService Types
HTTP
L7 TCP
Network
How to Enable?
This view does not require a separate enabling; it becomes usable automatically when an Advanced Captcha action is defined on the vService and the action's Captcha Quarantine feature is enabled. The threshold (Quarantine Failure Threshold), the quarantine duration (Quarantine Duration) and the keys (Tracking Type) are determined in the action's own configuration.
Appearance in the drop-down menu
This record source appears in the source list in the Logs & Tracking tab together with the action's name and quarantine duration, in the <action name> (QUARANTINE, <Quarantine Duration>) format (e.g. captcha (QUARANTINE, 1h)).
Viewing
- Left Monitor Panel is opened.
- Load Balancer vServices is selected from the category tabs at the top left.
- The vServices defined on TR7 are listed.
- The vService to be monitored is clicked; the screen opens with the Dashboard tab that carries the vService's name.
- On the screen that opens, the Logs & Tracking tab is clicked and the
(QUARANTINE, …)entry of the related Advanced Captcha action is selected.
Advanced Captcha (Quarantine) Logs Listing Screen
When the related quarantine source is selected, the clients currently in quarantine are listed as a table.
 Advanced Captcha (Quarantine) Logs Listing Screen
The table opens with the following columns by default:
| Column | Description |
|---|---|
| Quarantine Start | The date and time the client was quarantined (entry). |
| Quarantine Expiry | The date and time the quarantine will end (the client will be released). |
| Source (Client) IP Address (key) | The value of the quarantined client (quarantine key). It appears in the list with the ↓IP heading. If more than one Tracking Type is configured, each becomes a separate column. |
The following column is hidden by default and is added from the column selector:
| Column | Description |
|---|---|
| Source | The name of the TR7 device that holds the record (in cluster setups). It is always present in the preview panel. |
INFO
Since this is a membership table, the Incorrect Answers (number of failed CAPTCHAs) column of the tracking view is not present here.
The items in the toolbar are arranged from left to right in the following order; the last two items (Page Information and Page Size) are located in the information strip below the table.
Columns
Which columns are shown in the table is selected. In the same panel, columns are reordered by dragging and alignment is selected per column; the row height is fitted to the page with the Fit rows to the page button, and the column layout is reset to default with the Reset button. The layout is stored per user.
Logs Type
Determines the source to be viewed. The (QUARANTINE, …) entry of the related Advanced Captcha action is selected.
Filter
The Filter button is used to filter the list according to specific criteria. The filter criterion is the Tracking Type key selected in the action (e.g. ↓IP in this configuration).
Export
The table is exported as Excel, CSV or PDF by clicking the Export button. In the window that opens, the Filename, Format and Data Source, together with the Columns to be exported, are determined; the remaining fields are displayed according to the format: CSV Separator for CSV, Excel Sheet Name for Excel, and Page Orientation and Page Size for PDF.
Refresh
The current content of the quarantine table is fetched by clicking the Refresh button. Since the list is not refreshed automatically, the current state is obtained with this button. While fetching is in progress, the button stays inactive and shows a spinning icon.
Remove from Table
To release a client from quarantine before its time expires, the related row(s) are selected and the Remove from Table button is clicked. The client is released, and the paired tracking record is also cleared. The operation asks for confirmation and cannot be undone; the button is inactive while no row is selected. The trash can in the header of the preview panel does the same job but does not ask for confirmation; that path also clears the paired tracking record. The same operation is also available in the right-click menu.
Search
Used to search all information in the table.
RegExp Search
Used to search all information in the table with a regular expression (RegExp).
Column Based Search
Used to perform a column-based search on the information in the table.
Page Information
Contains information about the total number of fetched records and the range of records displayed in the list: Showing N-M of T records and the number of selected rows (N selected, or Nothing selected when there is no selection).
Page Size
The maximum number of records to be displayed on the page is selected. The default is 100; the options are 50, 100, 250 and All. The selection is not stored.
Right-Click Menu
When a row is right-clicked, a menu with a single operation opens. The operation applies only to the right-clicked record; a selection made in the list does not affect the menu.
| Operation | What it does |
|---|---|
| Remove from Table | Removes the right-clicked record from the quarantine table; like Remove from Table in the toolbar, it asks for Are you sure? confirmation. It is not displayed in the menu while the operation is in progress. |
Preview of the Selected Log
When any row in the list is clicked, the preview panel of that quarantine record opens. The panel shows the information of the record one below the other.
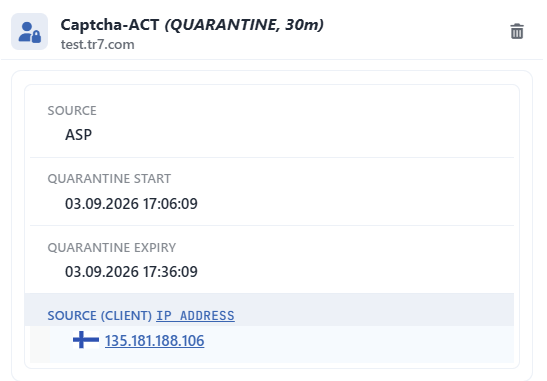 Preview of the Selected Log
Operations are performed on the record with the icon at the top right of the header:
| Operation | What it does |
|---|---|
| Remove from Table | Releases the client from quarantine. Unlike the toolbar and right-click paths, it deletes without asking for confirmation. |
| Information | Description |
|---|---|
| Source | The name of the TR7 device that holds the record (in cluster setups). |
| Quarantine Start | The date and time the client was quarantined. |
| Quarantine Expiry | The date and time the quarantine will end. |
| Source (Client) IP Address | The value of the quarantined client (quarantine key). |
