
Smarter by Design.Simpler for Business
Dashboard
What Is Dashboard?
Dashboard is the tab that shows the threat state of a vService with the Bot/DDoS protection enabled, from which axis the pressure comes and how the protection concludes every request on a multi-panel monitoring screen with a selectable time range. When the management screen of a Bot/DDoS protected vService is opened, the Dashboard tab (with the name of the vService) comes first.
The screen gathers the combined threat state value, the axis-based breakdown of the pressure, the bot score distribution, which protection applied which action and from which sub-protection the DDoS decisions came out in different panels. Every panel can be displayed in the form of a line, a table, a pie, a bar, a heatmap or a numeric indicator; it is updated automatically according to the selected time range. An attack wave is read at a single glance: whether the pressure comes from the volume or from a single source, how much of it the protection has intervened in and how the requests have concluded appear on the same screen.
All the monitoring and reporting capabilities are a built-in part of TR7: the data is collected on the device with per-second resolution and is stored in archives of up to 10 years; without the need to install an external analytics or SIEM tool, besides instant monitoring, the trends of years ago can also be examined retrospectively. The archiving is tiered: the finest resolution is kept only for the near past, and as the data ages it is stored summarized with wider steps.
1 s
Per-second data collection
Metrics are collected with per-second resolution; panels are updated automatically according to the selected range
10 Years
Historical data
Statistics are stored in archives of up to 10 years; the time range picker offers preset ranges of up to 5 years
Built-in
No external tool required
All data is collected on the device; no separate analytics/SIEM installation is required
7
View Tabs
Summary, L7 DDoS, Bot, IP Reputation and Quarantine always; two more tabs if the waiting room and the challenge are used
3
Protection Layers
The L7 DDoS, IP Reputation and Bot protections are monitored together on a single dashboard
0–1
Single Threat Value
The combined pressure value calculated from four axes is named with five bands
11
Outcome Types
The fate of every request is gathered in a single distribution, from Clean to Quarantined
20
Bot Score Buckets
The bot score between 0–100 is separated into buckets of five points and into four class bands
Personal
Customizable layout
Templates, adding/moving panels and resizing are stored per user
Accessing Dashboard
- Left Monitor Panel is opened.
- Bot/DDoS Protected vServices is selected from the category tabs at the top left.
- The vServices defined on TR7 that have the Bot/DDoS protection enabled are listed.
- The vService to be monitored is clicked; the screen opens with the Dashboard tab that carries the vService's name.
In the list every row carries the combined state of the vService, the Threat Protection strip that shows which protections work in which mode, and the type of the vService; the primary metric of the row is the threat state value, that is, the list is read directly according to the question "which vService is under pressure".
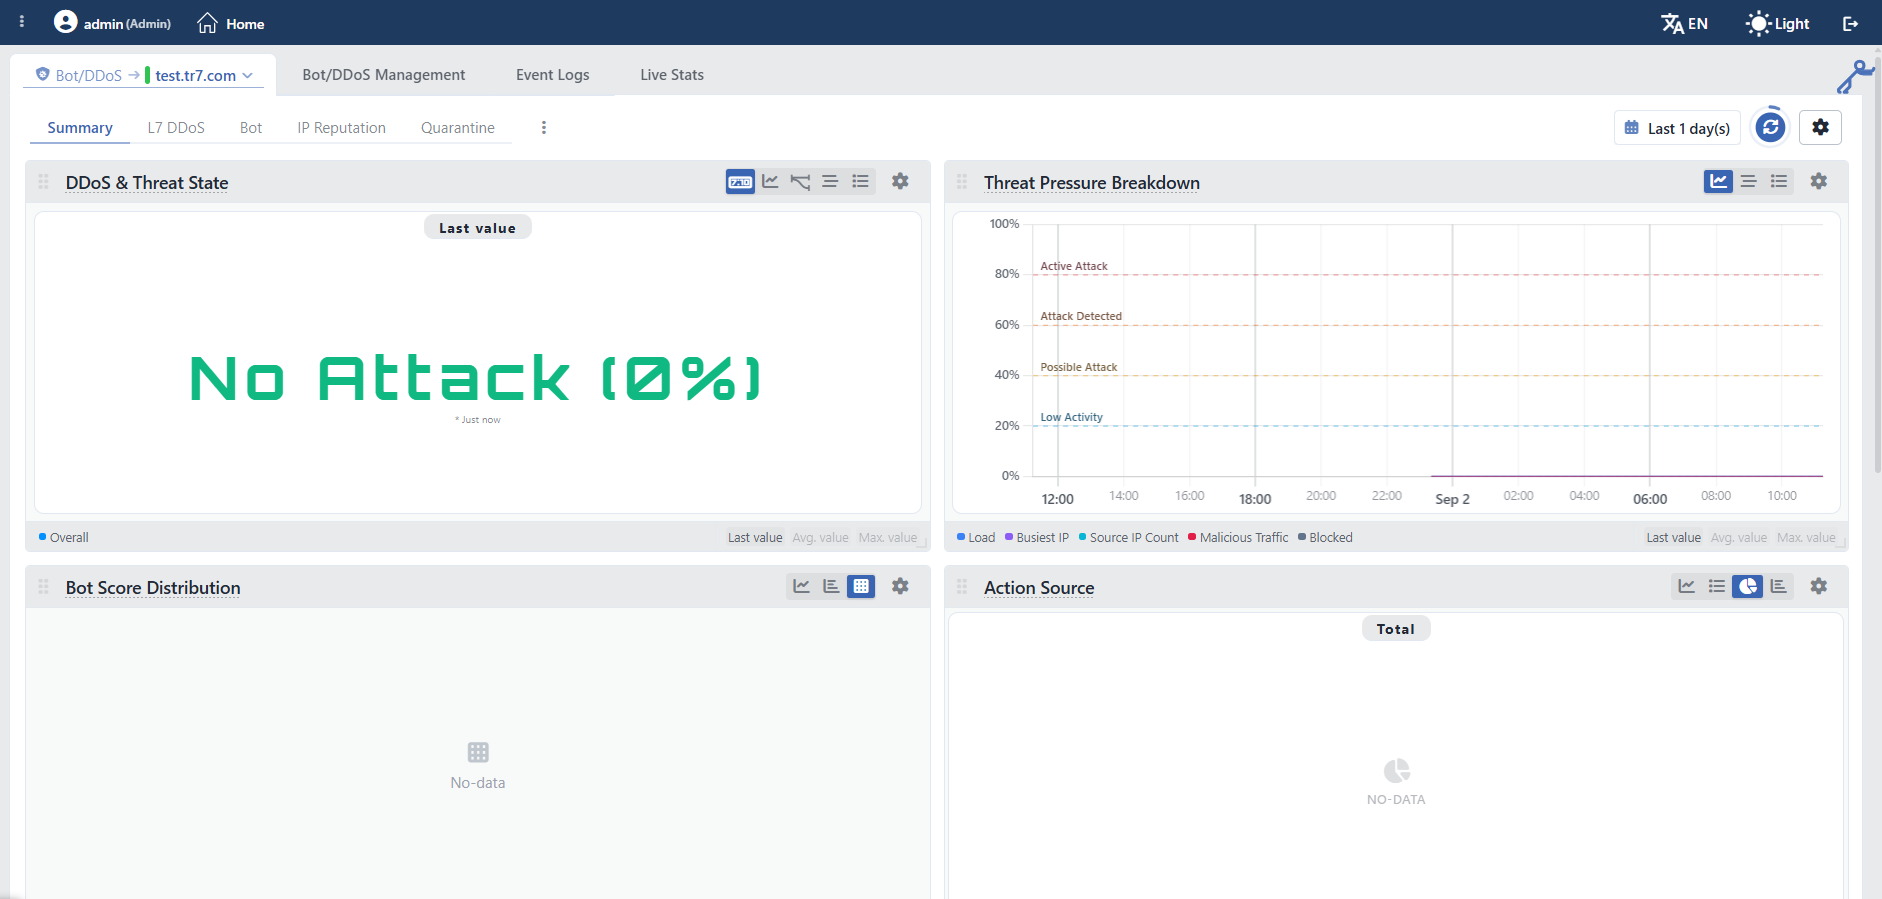 Bot/DDoS Dashboard
Tab Bar
Next to the Dashboard tab, the Bot/DDoS Management, Event Logs and Live Stats tabs are located on the same screen. The Event Logs tab is displayed if the event log source of the vService is defined. The live tables opened from the Bot/DDoS Management screen (the penalty box, the challenge tracking, the waiting room queue) and the notification log are also opened as closable tabs on the same screen. The settings edits, on the other hand, are opened not as a tab but as a window that leaves the screen when it is closed.
The first tab is at the same time a scope switcher: its label is in the form Bot/DDoS → <vService name> and when it is clicked, a menu for switching between the Load Balancer, WAF and AGS dashboards of the same vService opens. Only the modules that are enabled on the vService, included in the license and within the permission area of the user are listed in the menu; the WAF dashboard requires WAF permission.
On the right side of the screen there is also a collapsible panel that summarizes the Bot/DDoS configuration of the vService as a request flow diagram; for its detail see Bot/DDoS Data Flow Panel.
Bot/DDoS Data Flow Panel
The preview panel on the right side of the screen summarizes the Bot/DDoS configuration of the vService as a request flow diagram. The panel has no separate title in the interface; in this document it is described under the name Bot/DDoS Data Flow Panel so that it can be referred to easily. The panel is introduced in Bot/DDoS Data Flow Panel. In the diagram, the path that the traffic follows from entering at the listener addresses, through the three protection columns, until it reaches the Backend Services is seen at a single glance together with the quarantine wing and the decision outcomes. Every element in the diagram reflects the live configuration; the related setting is gone to directly with the gear icons of the cards and the pencil icons of the rows.
Unlike the one on the WAF dashboard, the panel is open on all the tabs of the screen. It is collapsed and expanded by clicking the handle figure outside the left of the panel; when it is hovered over, the figure shows the opposite operation. Resizing is done only by dragging from the left edge of the panel; the width is between 380 and 600 pixels and its default value is 450 pixels. The width and the collapsed state are remembered per user. The panel has no close button; it can only be collapsed.
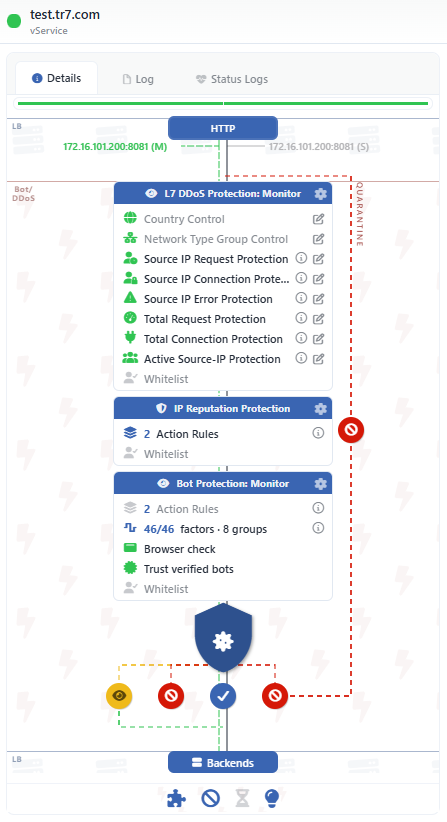 Bot/DDoS Data Flow Panel
The diagram is dynamic
The Bot/DDoS Data Flow Panel is not a fixed image; it is shaped dynamically according to the configuration made on the vService. Which cards and rows are listed, which outcome strips and the quarantine path are displayed and whether the mode badge appears depend entirely on the settings at that moment: for example, if the quarantine action is not used anywhere, the QUARANTINE path is not displayed at all, a closed protection column consists of the heading only, and if the waiting room is not defined, the pill node at the gate does not appear.
The image above shows a sample vService on which the DDoS and Bot protections work in the Monitor mode; the descriptions on this page cover all the elements that can appear in the diagram and under which condition they appear. The diagram on the screen can be different from this example according to the configuration of the vService.
Panel Header
In the header the name of the vService, the vService subtitle under the name and the colored status dot that shows the combined state are located: green OK, red Error, orange Warning, blue Evaluating, gray Disabled. In cluster installations the dot is in two halves; the left half shows the state of this device and the right half the state of the peer device, and the two states are written together in the tooltip.
There is no shortcut button in the header
Unlike the WAF preview, there is no edit shortcut and no three-dot operation menu in the header of this panel. The reason for this is that the Bot/DDoS configuration is edited not from a single screen but separately per protection column and settings group: the editing is done from the gear icon of each card and, for the DDoS blocks, from the pencil icon of the rows.
Panel Tabs
| Tab | Content |
|---|---|
| Details | The deprecated configuration warnings, the configuration warning rows, the device-based status messages and, below them, the flow diagram. At most four rows of status messages are shown per device, the rest are behind an expanding row. If all three of the fields are empty, the upper grid is not displayed at all and the tab opens directly with the diagram. |
| Log | The ones labeled Bot/DDoS among the audit (who changed what and when) records of the vService; with the date range, the record limit, the refresh and the Excel/CSV export tools. With a separate icon the records are opened in the full-screen log view. This tab is the complement of the Log tab on the vService dashboard: that one leaves the Bot/DDoS records out. |
| Status Logs | The status transition history of the vService; every transition is listed with the "old state → new state" badges and a reason row. It is filtered with the date range and limit selection, and there is a refresh button. |
The flow diagram is displayed only on the Details tab; when the other two tabs are passed to, the diagram does not appear.
Flow Diagram: LB Section
The upper section of the diagram is marked with the LB strip and shows the entry layer of the vService:
| Element | Meaning |
|---|---|
| Type Node | The blue node at the very top shows the type of the vService: HTTP or L7 TCP. Since the Bot/DDoS protection can be defined only on these two types, no other type appears in the diagram. The node cannot be clicked on any diagram; the debugging magnifier next to it, on the other hand, is displayed only on the diagram on the vService dashboard, while the debugging mode is on. |
| Listener Rows | Every row is a listener address (IP:port). In cluster installations the left side of the row shows the instance on this device and the right side the instance on the peer device; on cluster (VIP) type IPs, (M) indicates the master and (S) the slave instance. The color is the operating state of the address on that device: green = active, light gray = waiting in standby, dark gray = off, orange = warning (no carrier signal, master not found), red = the address cannot be found. When the address is clicked, the IP detail window opens; with the copy icon on the row, the address is taken to the clipboard. |
| SSL Badges | On the listeners on which SSL termination is done, the SSL badge is displayed next to the address; on the listeners on which QUIC (HTTP/3) is enabled, h3 is added next to the badge. On the listeners that redirect from HTTP to HTTPS, on the other hand, a circular arrow shaped redirection sign is shown. |
| Backends | The node at the very bottom of the diagram represents the Backend Services that the passing traffic reaches and is marked with a second LB strip. The Backend Service tree is not detailed on this panel; the diagram on the vService dashboard is used for the detail. |
Flow Diagram: Bot/DDoS Section
The Bot/DDoS strip contains the path that the traffic follows in the protection layer and the three protection columns. The strip is displayed with lightning silhouettes in its background and in its own threat color.
The label of the strip says Bot/DDoS in two lines.
The strip mode badge appears only while the three columns are in the same mode
The badge at the beginning of the strip shows that mode together with its icon and name in the case in which all three protection columns are in the same mode: Active with the shield icon, Monitor with the eye icon, Off with the forbidden icon. If even one of the columns is in a different mode, the badge is not displayed at all. In the example above, since the DDoS and Bot protections are Monitor and the IP Reputation protection is Active, the badge does not appear.
The columns are always lined up in the order L7 DDoS Protection → IP Reputation Protection → Bot Protection; this order is at the same time the evaluation priority of the protections. A box is displayed for every column even if the mode is Off: the box in the Off state stays without rows and fades completely.
| Card element | Meaning |
|---|---|
| Header icon | Shows the mode of the column: shield (Active), eye (Monitor), forbidden (Off). |
| Header suffix | If the mode is not Active, : <mode> is added to the header; for example L7 DDoS Protection: Monitor. In the Active mode no suffix is written, the header consists only of the name of the protection. |
| Gear icon | Opens the edit window of the whole column. It is displayed only on the users that have change permission in the Load Balancer area. |
| Row ⓘ icon | Opens an information window that summarizes the configuration of the row in full sentences; if there is more than one rule, the rules are listed numbered. The limit values and the time windows are written not on the row but in this window. |
| Row pencil icon | It is present only on the DDoS block rows and opens the edit window of that block directly. The editing of the other rows is done from the gear in the header of the card. |
L7 DDoS Protection Rows
The rows are listed in the evaluation order of the protection:
| Row | Value | Note |
|---|---|---|
| Country Control | The number of rules | If no rule is defined, the row stays faded. |
| Network Type Group Control | The number of rules | If no rule is defined, the row stays faded. |
| Source IP Request Protection | - | Only on HTTP vServices. |
| Source IP Connection Protection | - | |
| Source IP Error Protection | - | Only on HTTP vServices. |
| Total Request Protection | - | Only on HTTP vServices. |
| Total Connection Protection | - | |
| Active Source-IP Protection | - | |
| Trust Verified Bots | - | The row is added only while the setting is on. |
| Whitelist | The number of entries | If no exemption is defined, the row stays faded. |
On the vServices of the L7 TCP type, only the three blocks specific to HTTP (Source IP Request, Source IP Error, Total Request) drop from the list; five block rows remain on the card.
IP Reputation Protection Rows
| Row | Value | Note |
|---|---|---|
| Action Rules | The number of defined rules | If no rule list is defined, the row does not carry a value and stays faded. |
| Whitelist | The number of entries | If no exemption is defined, the row stays faded. |
Bot Protection Rows
| Row | Value | Note |
|---|---|---|
| Action Rules | The number of defined rules | If the rule list is empty, the built-in default list is considered. |
| factors · N groups | on/total | For example 46/46 factors · 8 groups. If no factor restriction is defined, the ratio is shown full. On L7 TCP vServices, since only the infrastructure and fingerprint groups can be triggered, the row says 17/17 factors · 2 groups. |
| Browser Check | - | Only on HTTP vServices and if the setting is not off. The operating mode is written in the icon tooltip of the row. |
| Trust Verified Bots | - | The row is added only while the setting is on. |
| Whitelist | The number of entries | If no exemption is defined, the row stays faded. |
A faded row has three reasons
A row being displayed faded shows one of three situations:
- The block having been switched off manually.
- The inspection not carrying a meaningful configuration: a block whose limit, action or window is missing, a country control with no rule, an exemption list with no entry.
- The column being in the Monitor mode: since the rule rows are not applied in that mode, the Action Rules row is also displayed faded.
On an HTTP vService on which a waiting room is defined, before the columns, at the gate of the module, a Waiting Room node with a dashed border is displayed; if it is in the monitor mode, the eye icon appears next to it.
Flow Diagram: Decision Node and Flow Paths
| Element | Meaning |
|---|---|
| Decision Node | The shield shaped node below the protection columns is the decision point of the Bot/DDoS layer. Inside the shield there is a virus symbol that carries the identity of the module; the same shield carries an artificial intelligence chip on the WAF dashboard and a key on the AGS dashboard. It works as follows: every request that passes through the columns is concluded here. The node is displayed only while at least one column is on; if all three columns are Off, neither the node nor the outcome strips appear. There is no clickable control on the node. |
| Outcome Strips | Below the node, according to the configuration, at most five outcome icons appear. From left to right: yellow Monitor (the traffic that stays in the monitor mode), red Blocked (blocking, slowing down or silent drop), in the middle blue Clean (the main line), on the right Challenge (challenge, redirection, alternative content or bandwidth limiting) and red Quarantine. Only the strip of the actions that are actually used is displayed; Clean is always there. |
| Strip Colors | The branch that goes from the decision node to the strip is displayed in the color of the strip itself. The branch that returns to the main line from the strips that release the traffic (Monitor, Challenge) is always green. On the blocking and quarantine strips there is no return line; the request ends there. |
| QUARANTINE Path | It is the red dashed path that carries the vertical QUARANTINE text and is displayed on the right edge when the quarantine action is used in any protection. The path starts from the quarantine strip and, passing the columns, climbs up to the gate of the module: the next request of a source that has been taken into quarantine is concluded at the gate without visiting any protection. The red sign in the middle of the path represents this memorized ban. |
A protection in the monitor mode does not produce an outcome strip
The outcome strips are produced only from the actions of the columns in the Active mode. While a protection is in the Monitor mode, its decisions are gathered in the yellow Monitor strip; the blocking or quarantine actions defined in the rule list of that protection are not displayed as a strip.
Bottom Settings Strip
The icon strip below the diagram represents the Bot/DDoS settings that are not located on the traffic path. The strip is fixed below the diagram. When an icon is clicked, the summary window of the related settings opens; if there is edit permission, the setting is passed to with the Edit button in the header of the window. If it is not used at all, the icon is displayed faded.
| Icon | Setting |
|---|---|
| Captcha: it is enabled if a protection directs the request to a challenge. | |
| Quarantine: it is enabled if a protection directs to quarantine, if a source-based hard ceiling is defined or if the ones that cannot pass the challenge are taken into quarantine. | |
| Waiting Room: it is enabled if the waiting room is on or in the monitor mode. | |
| Smart Advisor: it is enabled if the learning is not off; in the default state it is on. |
Since the challenge and the waiting room cannot be defined on the vServices of the L7 TCP type, only the Quarantine and Smart Advisor icons remain on the strip.
View Levels (Drill-Down)
The Bot/DDoS monitoring view is offered at two levels:
| Level | Scope |
|---|---|
| All vServices | The L7 DDoS & Threat Protection tab on the Home screen of the device; it shows the aggregate panels (prefixed with All vServices -) that cover all the Bot/DDoS protected vServices and the vService-based breakdown of the protection. See Home Dashboard: L7 DDoS & Threat Protection. |
| vService | The Dashboard of a single selected Bot/DDoS protected vService (the screen described on this page). |
This page describes the Dashboard at the vService level. The panels on this dashboard show only the data of the selected vService; the device-wide totals and the vService breakdowns have consciously not been taken to this dashboard.
Screen Controls
Above the panels there is a full-width toolbar that controls all panels together. On the left of the bar are the view tabs and the template menu; on the right are the time range picker, the refresh button and the settings. In the top right corner of each panel, there are view icons specific to that panel.
 Screen Controls
INFO
Menu
The menu next to the view tabs holds the operations for the Dashboard tab layouts (templates).
Create New Template
A new empty template (tab layout) is created.
Duplicate Current
A copy of the current template is created.
Edit Template
The name of the current template is edited. The option is enabled only for templates created by the user; it is inactive for preset templates. The layout is not changed from this window; panels are edited by dragging and resizing them directly.
Reset to Default
The current template is returned to its default state after confirmation is obtained. The option is enabled only on the templates on which a change has been made. The same operation is also done by double-clicking the tab.
Remove Template
The current template is deleted after confirmation is obtained. The option is enabled only on the templates created by the user; the ready templates cannot be deleted. If the deleted template is open at that moment, the first template is returned to.
Reset All to Defaults
After confirmation is obtained, the dashboard is returned entirely to its default state: the templates created by the user are deleted, the panel changes in preset templates are undone, and the toolbar preferences (time range, automatic refresh, resolution, source, height, theme) return to their default values.
The WAF Report shortcut is not present on this dashboard
The For Detailed Analysis → WAF Report shortcut located next to the menu on the WAF Dashboard screen has no equivalent on the Bot/DDoS dashboard; on this toolbar the time range picker comes directly after the menu.
INFO
Last 1 day(s) Time Range
Which time slice the panels will show the data of is selected; the default range is Last 1 day(s). The preset ranges are offered in fourteen steps from 5 minutes to 5 years: 5m, 15m, 30m, 1h, 3h, 12h, 1d, 3d, 7d, 1M, 3M, 6M, 1y, 5y. An absolute range can also be selected by entering a start and an end date; the absolute range is not stored, and when the screen is reopened, the relative range is returned to. While an absolute range is selected, the automatic refresh stops: a fixed time window has no new data to be refreshed. All the panels are updated according to the selected range and the relative selection is preserved per user.
Next to the range picker the consolidation function is also selected: when more than one measurement falls on a point, Average Value (the default), Minimum Value, Maximum Value or Last Value is shown. In long ranges, Maximum Value is used so that short-lived peaks are not mixed into the average.
INFO
Refresh
It reloads the data on the panels instantly. The automatic refresh is on by default and the panels are updated by themselves every 10 seconds; the remaining time is shown with the progress ring around the button. The panels are refreshed in groups of twenty.
INFO
Settings
The general appearance of the Dashboard and the display settings of the panels are accessed. The window is separated into three sections: Data (the resolution, the operating mode and the automatic refresh), Clustering (the source selection; only while the cluster is enabled) and Visual (the height, the theme and the legend).
Chart Resolution
The resolution of the charts (data point density) is selected: High Resolution (1,440 points), Standard Resolution (720 points, default) or Low Resolution (360 points). High resolution provides a more detailed display, and low resolution a more performant one.
Mode
Whether the panels show the historical data (History, the default) or the live stream (Live) is selected.
Auto-Refresh
The interval at which the panels refresh by themselves is set: Disabled, 5s, 10s (the default), 30s or 60s.
Source
In cluster installations, the data of which member will be shown is selected: the name of this device, the name of the peer device or Both Devices. When the data of more than one member is shown, the combining form is also selected: Smart (the default), Separate, Stacked or Sum. This section is displayed only while the cluster is enabled.
Height
The height of the panels on the screen is set.
Theme
The appearance theme (color scheme) of the charts is selected; the default theme is Professional. The panel legend is switched on and off from the same section.
INFO
Panel View Icons
With the icons in the top right corner of every panel, the display form of the data is changed. On a panel only the views suitable for that data are enabled; for example, the numeric indicator is offered only for the threat state panel, which produces a single value.
| Icon | View | What does it do? |
|---|---|---|
| Line Chart | Shows the metric's change over time (its trend); in multi-series panels it can be drawn stacked. | |
| Bar Chart | Compares the values between series with side-by-side bars. | |
| Pie Chart | Shows the proportional share of the series within the total. | |
| Heatmap | Shows the series as color bands on the time axis; as density increases, the band "heats up". | |
| Stat Table | Lists the series in an ordered table with their summary values (last/average/highest/total). | |
| Status Timeline | Shows the change of a categorical state over time as color bands. | |
| 7:10 | Digital | Emphasizes a single summary value with large digits. |
| Mini Chart | Reduces the panel to a compact card that carries a single number and a small curve. It is offered only on the panels that produce a single series: DDoS & Threat State and DDoS Bandwidth Limiting. |
The settings specific to the related panel are reached from the symbol of the panel. The panels can be moved and resized with drag and drop; a new panel is added to the tab with the Add Visualization card at the end of the layout. All the layout changes made are stored specially for the user.
INFO
Panel Metric Columns
Below each panel, the summary statistics of that metric are listed in columns for each series shown:
| Column | Meaning |
|---|---|
| Last Value | The last (most current) value in the selected range |
| Avg. Value | The average value throughout the range |
| Max. Value | The highest value in the range |
| Total | The total accumulated over the range |
Which summaries come open changes according to the view and the nature of the panel: the table view lists all four columns, and in the pie and bar views of the distribution panels only Total comes open. On the DDoS & Threat State and Threat Pressure Breakdown panels, on the other hand, only Last Value is meaningful; since these panels carry an instant state value, the average and the highest value are off by default.
On the panels that carry more than six series (Protection Outcomes, DDoS Trigger Attribution, Bot Score Distribution, Bot Detection Factor Distribution, the IP Reputation category distribution), the summary boxes of the line view come closed by default.
Disabled summaries are enabled by clicking them in the strip below the panel. By clicking the series names in the same strip, individual series are also hidden and shown.
View Tabs
The Dashboard contains upper tabs that group the panels according to their subjects. By default the Summary tab comes open; if another tab has been selected earlier within the same navigation, that tab is remembered.
 View Tabs
| Tab | Visibility Condition | Content |
|---|---|---|
| Summary | Always | The threat state, the pressure breakdown and the general outcomes of the protection. |
| L7 DDoS | Always | The DDoS outcomes, the trigger breakdown and the limit comparison panels. |
| Bot | Always | The bot score distribution, the score classes, the detection factors and the bot decisions. |
| IP Reputation | Always | The reputation decisions and the matching category distribution. |
| Waiting Room | If the waiting room is on or in the monitor mode on an HTTP vService | The occupancy, the capacity and the admission flow of the waiting room. |
| Captcha | If the action of a protection working in the active mode directs to a challenge on an HTTP vService | The challenges shown, solved and failed. |
| Quarantine | Always | Who sends to the penalty box. |
The same panel can be located in more than one tab; below, each panel is described in detail only in the tab where it first appears, and its repetitions are linked to the related description.
A panel that is not located in the ready tabs
The Protection Modes panel is not present in any ready tab; it is added manually from the Add Visualization card. The panel draws the mode (Off, Monitor, Active) of every protection block and of the waiting room over time as colored bands: which protection changed its stance when and for how long is read from this panel.
Summary Tab
The Summary tab gathers the seven panels that summarize the threat state of the vService.
DDoS & Threat State
It shows the single threat state value of the vService. The value is between 0 and 1, is written as a percentage and is presented together with the name of the band it belongs to: for example No Attack (0%). The Last Value badge above the panel indicates that the value shown is not the average but the last read value. There is a single series: Overall.
| Band | Value range | Meaning |
|---|---|---|
| No Attack | 0 – 0.2 | There is no notable pressure on the measured axes. |
| Low Activity | 0.2 – 0.4 | There is activity; this is not a finding but a reading and is not offered as a notification threshold. |
| Possible Attack | 0.4 – 0.6 | The pressure is approaching the attack limit. |
| Attack Detected | 0.6 – 0.8 | More than one axis has risen at the same time. |
| Active Attack | 0.8 – 1 | An ongoing attack. |
The value is calculated from four axes: the total load, the busiest single source address, the spread of the source addresses and the share of hostile traffic. While the axes are being averaged, the denominator is always accepted as four: an axis that cannot be measured is not dropped from the denominator, it is counted like a witness without verification. In this way a vService with only a single block open cannot give a higher reading than a fully configured vService.
The practical result of this is the following: even if a single axis goes to the top, the combined value cannot reach the Attack Detected band, at most Possible Attack is read. In order to be able to rise to the attack band, the verification of at least two axes is needed.
A gap is not calmness
The gaps in the chart do not mean "there is no attack", they mean it was not measured. If the block of a protection is off, no value is written to the series of the related axis and that axis is not counted as a verifying witness; however, since it is not dropped from the denominator either, it pulls the combined value down.
The defense alone cannot claim an attack
The rate of traffic intervened in is also monitored, but this strip does not enter the average; it can raise the combined value only up to a certain ceiling. In this way a configuration that does intense blocking cannot carry the dashboard to the attack band without there being real pressure.
The panel can also be opened in the status timeline, line, table and mini card views; in the line view the horizontal threshold lines that show the band boundaries are also drawn. In cluster installations the values of the two devices are not summed, the larger one is taken.
Threat Pressure Breakdown
It separates where the threat state value comes from. Above the chart there are horizontal threshold lines that show the boundaries of the bands (Low Activity, Possible Attack, Attack Detected, Active Attack); every axis is drawn in its own color.
| Series | What it measures |
|---|---|
| Load | The position of the total request and connection rate coming to the vService with respect to the defined total limits. |
| Busiest IP | The position of the request, connection and error peaks of the busiest single source address with respect to the per-source limits. |
| Source IP Count | The position of the number of different source addresses that are active at that moment with respect to the defined spread limit. It is the axis that shows botnet participation. |
| Malicious Traffic | The hostile share of the traffic: the bot share, the reputation match share and the share on which an action is applied. |
| Blocked | How much of the traffic has actually been intervened in. It is drawn dashed and does not join the average of the combined value. |
The Y axis is always between 0 and 1 and its marks coincide exactly with the band boundaries. Since zero is also counted as a reading on this panel, it is not hidden in the tooltip box.
Bot Score Distribution
It shows the distribution of the bot score given to every request. The score is between 0 and 100 and is separated into 20 buckets of five points: 0–4, 5–9, 10–14 … 90–94, 95–100. The buckets are colored with the color of the class they belong to:
| Class | Score range | Meaning |
|---|---|---|
| Clean | 0 – 39 | There is no sign of automation. |
| Suspicious | 40 – 59 | There is suspicious behavior but it is not certain. |
| Bot | 60 – 84 | Most probably an automatic client. |
| Bad Bot | 85 – 100 | Malicious automation. |
The real information to be read from the shape of the distribution is the valley between the two peaks: it shows how clearly the clean traffic and the bot traffic are separated from each other. The buckets are not folded or reordered in any view; the order itself is meaningful. Unlike the factor and category distributions, no upper limit is applied in the heatmap view either: all twenty buckets are always drawn. The panel can be opened in the heatmap, bar and line views and is calculated on both HTTP and L7 TCP vServices.
Action Source
It shows from which protection every intervention applied comes: L7 DDoS Protection, IP Reputation Protection, Bot Protection and Quarantine.
The series do not overlap
A request has a single action owner; for this reason the series never overlap and their total directly gives the number of requests stopped by the module. The penalty box is counted as a source on its own: the blocking of a source that has already been taken into quarantine is not the live decision of a protection working at that moment.
If more than one protection is in a position to intervene in the same request, the priority order is in the form L7 DDoS → IP Reputation → Bot: first the flood, then the known bad address, and at the very end the behavioral bot evaluation.
Who Sends to Quarantine
It shows who sends the actors to the shared penalty box: a DDoS hard ceiling, a bot rule row, a reputation category or a visitor that continuously cannot pass the challenge.
The series are L7 DDoS Protection, IP Reputation Protection, Bot Protection and Captcha. It must be noted that the fourth series is different from the one on the Action Source panel: there the box itself is an action source, while here the challenge is among the ones that fill the box.
Protection Outcomes — Action Distribution
It shows how every request has concluded when all the protections are evaluated together. This panel is a combined view: the decision of the winning protection is counted only once per request, therefore the total of the series is equal to the volume of traffic evaluated.
| Outcome | Meaning |
|---|---|
| Clean | It passed without any intervention. |
| Whitelisted | It passed because it is explicitly on the trusted list. |
| Trusted Bot | It was recognized as a verified good bot. |
| Silent Drop | It was dropped without a response being given. |
| Blocked | It was blocked. |
| Tarpit | It was slowed down and kept waiting. |
| Redirected | It was redirected to another address. |
| Show Content | Alternative content was shown. |
| CAPTCHA | The challenge was shown. |
| Quarantined | It was taken into the penalty box. |
| Monitored | In the monitor mode an intervention was going to be made; the request was let through. |
The series change according to the vService type
A part of the list above is produced only on HTTP vServices. On L7 TCP vServices the Blocked, Tarpit, Redirected, Show Content and CAPTCHA series do not appear at all; on this type only the silent drop and the quarantine can be applied as a concluding action. Since bandwidth limiting does not conclude the request, it is outside this distribution and can be used on L7 TCP as well in the country and network type rules.
Bandwidth limiting is not a part of this distribution: since the limited request continues on its way, it is shown on a separate panel as an overlapping layer.
DDoS Trigger Attribution
It shows by which sub-protection the DDoS decision was made.
| Metric | Its equivalent |
|---|---|
| Source IP request rate | The request rate protection per source address. |
| Source IP connection rate | The connection rate protection per source address. |
| Source IP error rate | The error rate protection per source address. |
| Total request rate | The total request rate protection across the vService. |
| Total connection rate | The total connection rate protection across the vService. |
| Active source count | The active source address count protection. |
| Country rules | The country rules. |
| Network type rules | The network type group rules. |
| Hard ceiling (requests) | The total request hard ceiling. |
| Hard ceiling (connections) | The total connection hard ceiling. |
For every blocking only the winning trigger is counted. The country and network type rules are gathered in a single row; the breakdown on a rule basis is not on this panel but on the Event Logs screen. The requests of the challenge infrastructure itself do not enter this count.
L7 DDoS Tab
The L7 DDoS tab examines the decisions of the DDoS protection and the observed values together with the defined limits.
The repeated panel located in this tab (its description is in the Summary tab):
- DDoS Trigger Attribution: see DDoS Trigger Attribution.
DDoS Protection Outcomes
It shows the distribution of the decisions made only by the DDoS protection. The series are the subset of the outcomes in the Protection Outcomes table that can be produced by DDoS. While on the combined panel the decision of a request is written to the winning protection, on this panel it is looked at only through the DDoS lens.
DDoS Bandwidth Limiting
It shows the requests limited with a bandwidth rule as a single series. These requests are not blocked, they continue on their way; for this reason it is not a slice of the outcome distribution but a separate overlapping layer.
DDoS Limit Comparison Panels
Six panels draw the observed value together with the defined limit:
| Panel | What it compares | Scope |
|---|---|---|
| DDoS — Total Requests & Limits | The request rate across the vService | Only HTTP |
| DDoS — Total Connections & Limits | The connection rate across the vService | HTTP and L7 TCP |
| DDoS — Per-Source-IP Requests & Limits | The request rate of the busiest source address | Only HTTP |
| DDoS — Per-Source-IP Connections & Limits | The connection rate of the busiest source address | HTTP and L7 TCP |
| DDoS — Per-Source-IP Errors & Limit | The number of errors per source address | Only HTTP; it has no hard ceiling |
| DDoS — Active Source IPs & Limit | The number of active different source addresses | HTTP and L7 TCP; it has no hard ceiling |
These panels have a common visual language:
- On the panels that measure totals, next to the observed average there is the Peak (busiest moment) series; the green fill between it and the limit shows the headroom and the red fill the overrun.
- On the panels that measure per source, Peak (worst source IP) gives the worst single address and p95 (bulk upper edge) the upper edge of the bulk. In this way a single aggressive address and a general rise are separated from each other.
- The Limit line shows the learned or manually defined soft limit and the Ceiling line the hard ceiling.
- The form of the limit line carries the mode of the protection: while the protection is off it is drawn gray and sparsely dashed, in the monitor mode dashed, and while it is active solid.
- The DDoS — Active Source IPs & Limit panel is outside these two kinds: it is an absolute count that does not use a window, it carries a single observed series (Active source IPs) and a single Limit line; the Peak, p95 and Ceiling series are not present.
In cluster installations the line of every device is shown separately, the values are not summed.
Bot Tab
The Bot tab examines the distribution of the bot scores, their classes and the detection factors that produce the scores.
The repeated panel located in this tab (its description is in the Summary tab):
- Bot Score Distribution: on this tab it opens by default with the bar view, with the class bands marked on the axis. See Bot Score Distribution.
Bot Score Classes
It shows the distribution of the requests into the four bot score classes (Clean, Suspicious, Bot, Bad Bot). The classification is done on the device while the data is being collected; the interface does not recalculate the score buckets. This panel is used when a summary at the class level is sought instead of the detail of the score distribution.
Bot Detection Factor Distribution
It shows which detection factor is triggered how often, that is, what produces the bot scores. The series are at the leaf factor level and are labeled in the form sub factor (parent factor); the colors are given according to the parent factor. In the heatmap view only the fifteen most intense factors are drawn. On L7 TCP vServices the factors that cannot be triggered on that protocol drop from the list.
Bot Protection Outcomes
It shows the distribution of the decisions made only by the bot protection; the series are filtered with the same logic as the DDoS Protection Outcomes panel: the outcomes that the bot rule list can produce on that protocol are listed.
IP Reputation Tab
IP Reputation Outcomes
It shows the distribution of the decisions made only by the IP reputation protection; its behavior is the same as the DDoS Protection Outcomes panel.
IP Reputation — Detected Category Distribution
It shows the distribution of the matching reputation categories. For a request the first matching category is counted, therefore every request falls into a single category and the total of the series is equal to the number of matching requests. The categories consist of twenty-five headings, including the user's own blacklist and the external feed: DNS Compromise, DNS Poisoning, Fraud Orders, DDoS Attack, FTP Brute-Force, Ping of Death, Phishing, Fraud VoIP, Open Proxy, Web Spam, Email Spam, Blog Spam, VPN IP, Port Scan, Hacking, SQL Injection, Spoofing, Brute-Force, Bad Web Bot, Exploited Host, Web App Attack, SSH and IoT Targeted. In the heatmap view only the fifteen most intense categories are drawn; the table, pie and bar views list all of them.
Quarantine Tab
On the Quarantine tab there is a single panel: Who Sends to Quarantine. Its content is the same as the one on the Summary tab; see Who Sends to Quarantine.
This tab has no opening condition: since every protection can send to the penalty box, the tab is displayed even if the quarantine is never used.
Waiting Room Tab
The Waiting Room tab appears only on HTTP vServices and while the waiting room is on or in the monitor mode.
Waiting Room — Occupancy & Capacity
It draws the number of visitors that are inside (Inside) and waiting in the queue (In Queue) against the defined capacity (Capacity). The capacity line carries the mode of the protection: while the waiting room is off it is drawn gray, in the monitor mode dashed, and while it is active solid.
Waiting Room — Admissions & Queueing
It shows the ticket issuing rate (Admitted) and the rate of entry into the queue (Queued) together with the sudden rise protection limit (Limit). In the total view the cumulative values are also offered.
Captcha Tab
The Captcha tab appears only on HTTP vServices, if a challenge action is defined in the rule list of a protection working in the active mode or in a DDoS block. A challenge action in the monitor mode does not open the tab.
CAPTCHA Lifecycle
It shows the challenges shown (Shown) and what the visitors did with them (Solved, Failed) side by side. The requests of the challenge infrastructure itself do not enter the count.
These three series are not a division
The number shown can exceed the total of solved and failed; the difference between them is the visitors that see the challenge and give up. For this reason the stacked line and pie views are consciously not offered on the panel.
Scope and Limits
INFO
- The screen is opened with monitoring permission in the Load Balancer area. There is no separate permission area for Bot/DDoS; the Load Balancer area is used. The tabs are not separated according to the permission. The edit surfaces (the card gears, the row pencils, the Edit button in the summary windows) are displayed only on the users that have change permission.
- The layout settings are not separated per vService. Adding, moving and resizing panels, the templates and the toolbar preferences are stored in a single place per user; an arrangement made on one vService appears on all the Bot/DDoS dashboards.
- At most 32 panels per tab and at most 16 custom templates per user can be created.
- A version update resets the saved layout. When the dashboard version changes, the stored templates, panel arrangement and toolbar preferences return to default.
- The open tab is written to the address bar; both the upper tab and the view tab inside it are carried in the address and are preserved when another vService is passed to.
- Reset and delete operations require confirmation. Each of the template reset, template delete and full dashboard reset operations shows a separate confirmation window.
- The panels being empty does not mean that the protection does not work. Every panel family fills only if the related protection produces data:
- Protection Outcomes, Action Source and Who Sends to Quarantine produce data if the bot protection is configured, if the reputation protection is in observation or if the DDoS protection is in the active state.
- DDoS Trigger Attribution produces data only while the DDoS protection is active; in the monitor mode this panel stays empty.
- The Bot panels fill while the bot protection is on and while at least one suitable detection factor is selected.
- The IP Reputation panels fill while the reputation protection is in the monitor or the active state.
- CAPTCHA Lifecycle fills only if the action of a protection working in the active mode directs to a challenge.
- The DDoS limit panels are displayed only if the related block is on and its limit is defined.
- The threat state panels have a warm-up period. When the module is newly switched on or when the device restarts, the threat state and pressure breakdown panels do not write any value until the second slow collection round is completed. This period lengthens together with the number of vServices on the device: on a small number of vServices it can take a few seconds, on a large number of vServices tens of seconds. The gap in the first rounds is the expected behavior.
- The collection interval changes according to the number of vServices. The data is collected at the finest resolution per second; however, as the number of vServices on the device increases, the collection interval automatically widens. The heavy tables that feed the distribution panels are read more rarely and in the rounds that are not read nothing is written: instead of writing a stale counter, a gap is left in the chart. For this reason the breaks on the distribution panels are ordinary.
- Panel operations. In the gear menu in the top right corner of every panel there are two operations: Edit (the settings of the panel) and Remove (removing the panel from the dashboard). The panel is resized by dragging from the corner of the panel; during the dragging the target size is shown with a ghost frame.
