
Smarter by Design.Simpler for Business
WAF
What Is WAF?
WAF is the view tab that gathers the attack picture of all the WAF-protected vServices on the device on a single screen on the TR7 home page. The tab consists of eight panels: the blocked request and detected attack totals, the inspection distribution that shows how the WAF concludes the requests, the category and OWASP breakdowns of the attacks, the source country map and the blocking table per vService.
All the panels are the device-wide equivalent of the WAF panels on the Dashboard screen of a single vService. Above the title of these panels, All vServices is written and the value is the total of all the vServices to which a WAF profile is assigned. The table that has vService Distribution written above its title, on the other hand, lists the same metric as one row per vService; this table is found only on the home page.
The scope of the totals depends on the WAF profile: the traffic of a vService whose WAF is not on does not contribute to any panel in this tab. For the tab to be displayed, however, a WAF-protected vService being present on the device is not required; if the protection is not used at all, the tab opens but the panels stay empty.
8
Panels
The panel order has been determined by hand; there is no conditional panel in the tab
WAF
Required Permission
The tab and all eight panels are bound to the WAF permission
vServices with WAF
Total Scope
The All vServices panels gather only the vServices to which a WAF profile is assigned
Per vService
Distribution Table
WAF Blocked Requests is listed in a separate row for every WAF-protected vService
Access to the WAF Tab
- The Home shortcut on the left of the Header Bar is clicked.
- WAF is selected from the view tabs.
The tab does not have a subtab, so the second row of the tab bar is not displayed. For the Header Bar shortcuts, see Header Bar.
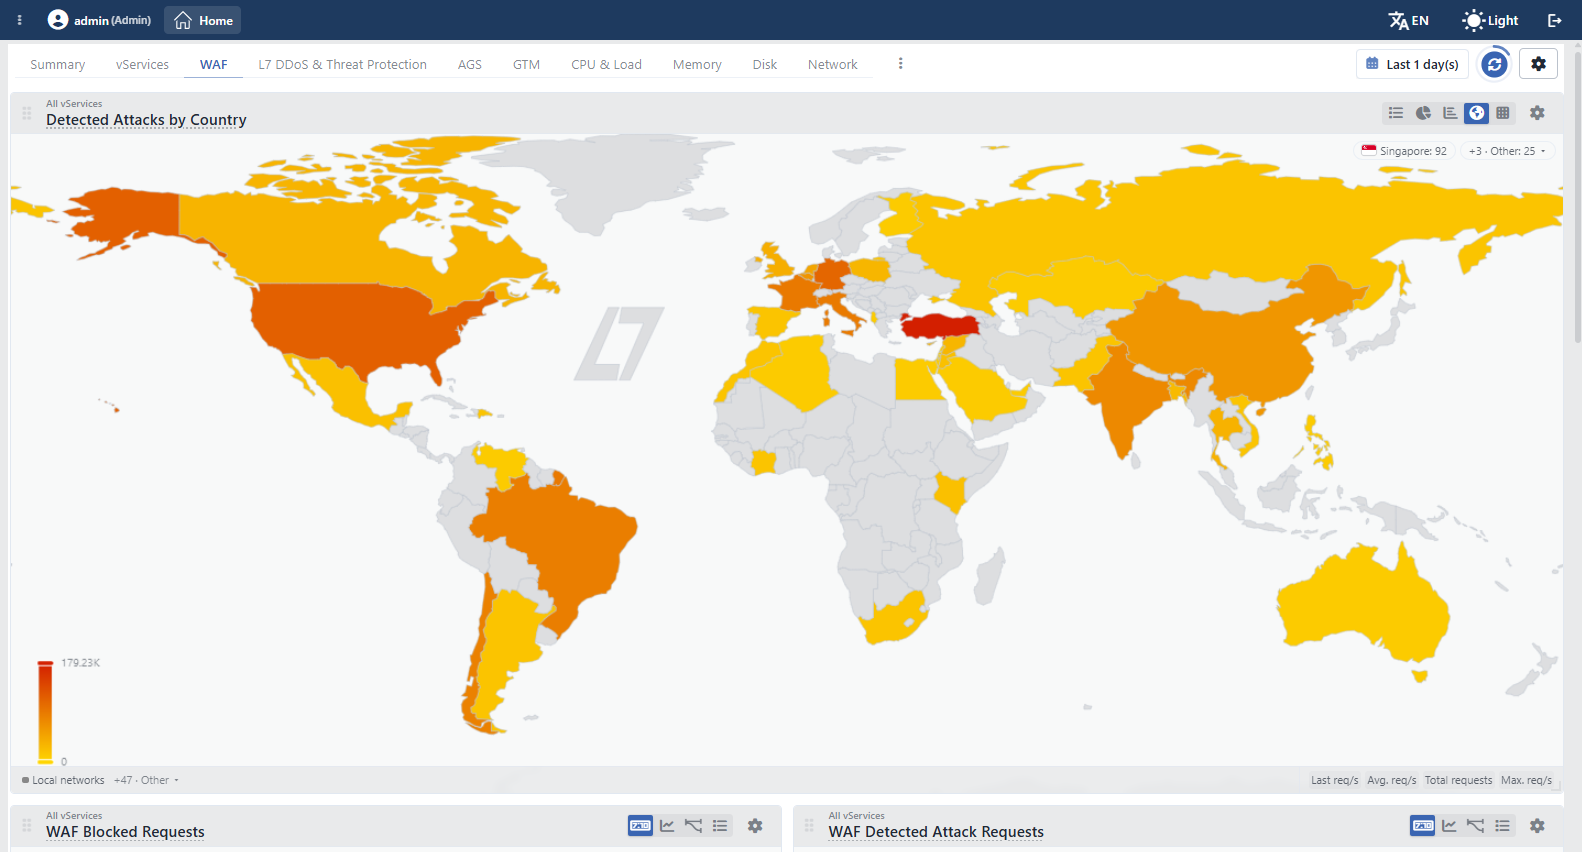 The WAF Tab
The screen controls are common to all the tabs
The time range selector, the refresh, the settings, the template menu and the arrangement of the panels are the same in all the view tabs of the home page; for the detail, see Screen Controls.
Panels
There are 8 panels in the WAF tab and their order has been determined by hand. There is no conditional panel in the tab: all eight panels are laid out regardless of whether there is a WAF-protected vService on the device. The tab and all the panels are bound to the WAF permission; in a user who does not have this permission, the tab does not take place among the view tabs at all.
The Detected Attacks by Country map has been placed at the beginning of the tab, two cards wide and two cards high. The Detected Attacks by Category and WAF Blocked Requests tables grow up to two cards high as the content lengthens. The other panels are one card in size.
The card width changes according to the screen width: as many columns as the number of cards that fit side by side are opened and the cards fill the column. On a screen on which two cards fit side by side, the map covers both columns entirely and the two numerical panels below it are laid out side by side.
With Add Visualization, the following panels are also added to this tab: the vService Distribution table for WAF Detected Attack Requests, Learning Log Sampling and Learning Discovery Rate. Apart from these three, no other WAF panel that can be added to the tab is offered; the non-WAF totals such as Frontend Request Count do not take place in the panel list of this tab.
Detected Attacks by Country
Written All vServices above its title, this panel shows the country distribution of the attacks detected on all the WAF-protected vServices according to the location of the source IP on a world map. Every series is a country; the attacks coming from the local and private networks are gathered in the Local networks series and this series is always shown even if its value is zero. The countries that have not produced a record do not enter the list. The map is colored with a threat gradient extending from yellow to red; the scale is displayed in the bottom left corner of the map together with the highest value.
As a summary, Last req/s, Avg. req/s, Total requests and Max. req/s come open; the map is colored according to the Total requests value, and if another summary is left alone from the summary strip, the coloring is recalculated according to it. The records that cannot be shown on the map (the local and private networks together with the small countries that do not have their own area on the map) are listed as chips at the top right of the map; the record with the highest value is in a separate chip in the form Singapore: 92, and the rest are gathered in a single chip in the form +3 · Other: 25 ▾ and all of them are opened by clicking this chip and folded again with ▴ Show less.
The series legend and the summary strip are overlaid on the lower edge of the map as a semi-transparent band; in this way the map uses the whole of the card. The strip does not carry all the countries: together with the first series in the definition order (Local networks), the rest are gathered in the +N · Other ▾ item and are opened by clicking. The map is scrolled by being dragged and is zoomed in with the wheel; when the view is changed, it is returned to the initial view with the Recenter / Reset button that appears at the top right. By dragging the handles of the color scale, the countries that remain outside the selected range are dropped from the map; the scale is displayed only in a normal-sized card, and it is hidden in a half-height card. In the panel, the Stat Table, Pie Chart, Bar Chart, Map and Heatmap views are offered; the heatmap shows only the 15 busiest countries.
The attack definition of this panel is not exactly the same as that of the WAF Detected Attack Requests panel: while the map counts the blocked and monitored attacks, the other panel also adds to them the requests caught by the teacher. For the same panel belonging to a single vService and the definition difference, see Detected Attacks by Country.
WAF Blocked Requests
Written All vServices above its title, this panel shows the total of the requests that are actually blocked on all the WAF-protected vServices (the Blocked series). As a summary, Last req/s, Avg. req/s and Total requests come open; Max. req/s is opened from the strip under the panel. The requests that are detected but passed within the scope of Monitor or Teacher are reflected not to this panel but to the WAF Detected Attack Requests panel.
In the panel, the Digital, Line Chart, Mini Chart and Stat Table views are offered. In cluster setups, the values of the two devices are summed and a single value is shown. For a single vService, see WAF Blocked Requests.
WAF Detected Attack Requests
Written All vServices above its title, this panel shows the total of the requests detected as an attack on all the WAF-protected vServices (the Attacks series). The series is the total of the attack requests that are blocked, taken into monitoring and coming from the teacher traffic. The summary, the views and the cluster behavior are the same as WAF Blocked Requests.
For the scope of the series and its difference from the blocked request, see WAF Detected Attack Requests.
WAF Inspection Distribution
Shows how the requests coming to all the WAF-protected vServices are concluded as six series. The series are shown stacked; as a summary, only Total requests comes open.
| Series | Meaning |
|---|---|
| Whitelisted | The requests that do not enter the WAF inspection at all because they match the bypass conditions. |
| Clean | The requests that are inspected and for which no attack finding is reported. |
| Blocked | The requests that are inspected and blocked. |
| Monitor | The requests for which a blocking decision is made in a host group in Monitor mode but which are only monitored. |
| Teacher | The requests that come with the teacher identity and for which a blocking decision is made but which are passed. |
| Learning | The requests within the scope of learning. |
A request is counted in only a single series; for the mutual exclusion order of the series and the first link of the chain that is not shown in this panel, see WAF Inspection Distribution. In the panel, the Line Chart, Stat Table, Pie Chart and Bar Chart views are offered.
Detected Attacks by Category
Lists the breakdown of the attacks detected on all the WAF-protected vServices according to the attack categories. Every row is a category and the row name is read from the WAF classification database that comes with TR7: the signature categories (such as SQL Injection, Cross-Site Scripting, Directory/Path Traversal and OS Command Execution) and the four structural categories added to them (Structure Limits, Structure Policies, Content Integrity, IP Reputation). The panel carries 36 categories at once: 32 signature categories and four structural categories. The columns are Last value, Avg. value, Max. value and Total; the table opens sorted by the Total column from the largest to the smallest.
In the panel, the Line Chart, Stat Table, Pie Chart, Bar Chart and Heatmap views are offered. The heatmap shows only the 15 busiest categories; the other views list all the defined categories and the ones that have not produced a record in that period take place with a value of zero. For a single vService, see Detected Attacks by Category.
The category totals are not the number of requests
Since a single request can enter more than one attack category at the same time, the total of the series in this panel does not have to be equal to the number of attack requests. The panel shows not the number of requests but the detection density on a category basis. For this reason, the Y axis unit is not written in the panel either.
Detected Attacks by OWASP Top 10 (Web)
Shows the distribution of the attacks detected on all the WAF-protected vServices according to the OWASP Top 10 (2021) web categories. The ten series are labeled with the identity and the name together in the form A01:2021 · Broken Access Control; in the pie slices only the identity (such as A03:2021) is written and the slice percentages are shown. As a summary, only Total comes open.
In the panel, the Line Chart, Stat Table, Pie Chart, Bar Chart and Heatmap views are offered. The same counting rule as the category panel applies: if a signature is related to more than one OWASP item, its detection is reflected to every item separately. For a single vService, see Detected Attacks by OWASP Top 10 (Web).
Detected Attacks by OWASP API Top 10
Gives the same breakdown over the OWASP API Security Top 10 (2023) categories; the ten series are labeled in the form API1:2023 · Broken Object Level Authorization and the identities from API1:2023 to API10:2023 are written in the slices. The summary, the views and the counting rule are the same as Detected Attacks by OWASP Top 10 (Web). For a single vService, see Detected Attacks by OWASP API Top 10.
WAF Blocked Requests
Written vService Distribution above its title, this table lists every WAF-protected vService on the device in a separate row; the row name is the name of the vService. The vServices to which a WAF profile is not assigned do not take place in the table. The columns are Last req/s, Avg. req/s, Max. req/s and Total requests; the table opens sorted by the Total requests column from the largest to the smallest.
The sorting is changed by clicking the column header: the first click sorts from the largest to the smallest, the second click from the smallest to the largest, and the third click removes the sorting. In the strip under the panel, the vService names take place and that row is hidden by clicking a name. When the title is hovered over, a description tooltip does not appear. In the panel, the Stat Table, Pie Chart and Bar Chart views are offered. In cluster setups, the values of the two devices are summed for every vService.
The detected attack equivalent of the same table is not present in the default layout; it is added for WAF Detected Attack Requests with Add Visualization.
Scope and Limits
INFO
- The tab is displayed only with the WAF permission. All eight panels are bound to the same permission; in a user who does not have the permission, the tab does not take place among the view tabs at all.
- Only the vServices to which a WAF profile is assigned enter the totals. The traffic of a vService whose WAF is not on does not contribute to any panel; if there is no WAF-protected vService on the device at all, the tab still opens but the panels stay empty:
No datais displayed in the value sections of the two numerical panels,No-datain the two OWASP pie panels, and in the panels for which no record has been produced at all, the textNo data recorded for the selected time range.is displayed inside the card. - The vService scope is not narrowed through the tab. The panels read the device-wide total; for the individual values of certain vServices, the vService Distribution table or the vService's own Dashboard screen is used.
- All the panels are summed in a cluster. In all the panels in this tab, the values of the two devices are summed and a single series is shown; for the separate device values, the source selection in the settings is used.
- The fine-resolution history changes according to the panel. While the per-minute resolution goes 14 days back in the blocked request, detected attack and inspection distribution panels, it is kept for 7 days in the category and OWASP panels and for 1 day in the country map. The older ranges are kept with a coarsening resolution for up to 10 years.
- The learning panels are offered without looking at the condition. The Learning Log Sampling and Learning Discovery Rate in the Add Visualization menu take place in the list even if there is no vService with smart sampling enabled on the device, and when they are added they are laid out as an empty card. On the vService dashboard, the same panels are created only while learning is enabled.
- The total traffic is not present in this tab. For the size of the attack rates relative to the total request traffic, the Frontend Request Count panel in the Summary tab or the Frontend Request Count table in the vServices tab is used.
- There is no transition to another screen from the cards. By clicking a vService row in the vService Distribution table, that vService's WAF dashboard is not opened; for the event record, live statistics and report screens, the vService's own tabs are used.
