
Smarter by Design.Simpler for Business
Summary
What Is Summary?
Summary is the view tab that summarizes the general status of the device on a single screen on the TR7 home page. When the home page is opened, this tab comes first. The tab brings together the hardware, clock, cluster and synchronization information of the device, its uptime, the processor and memory usage, the network traffic and the basic totals belonging to all the vServices and DNS services on the device in nine panels.
While the other view tabs look in detail at a single subject (vService traffic, WAF, AGS, GTM, processor, memory, disk, network), Summary shows one or two basic panels from every subject. When a value draws attention, the detail is examined from the related tab or from the vService's own dashboard.
The totals in the panels belong to the device as a whole: Frontend Request Count shows the total of all the HTTP vServices, AGS Concurrent Sessions of all the vServices whose AGS is on, and DNS Query Rate of all the DNS services. For a single vService or DNS service, the same panels are located on that service's dashboard.
9
Panels
Nine hand-picked panels; every panel is bound to its own permission area
Default
Opening Tab
Summary comes when the home page is opened and when it is returned to from another screen
Device-Wide
Totals
The request, AGS session and DNS query panels are the total of all the services
A Single Click
Synchronization Status
From the synchronization row in Device info, the HA Clustering & Sync screen is opened
Access to the Summary Tab
- The Home shortcut on the left of the Header Bar is clicked; the home page opens with the Summary tab.
- If another view tab is open, Summary is selected from the tab bar.
The tab does not have a subtab, so the second row of the tab bar is not displayed. The home page is also opened with the Dashboard link on the bottom row of the Configuration Menu. For the Header Bar shortcuts, see Header Bar.
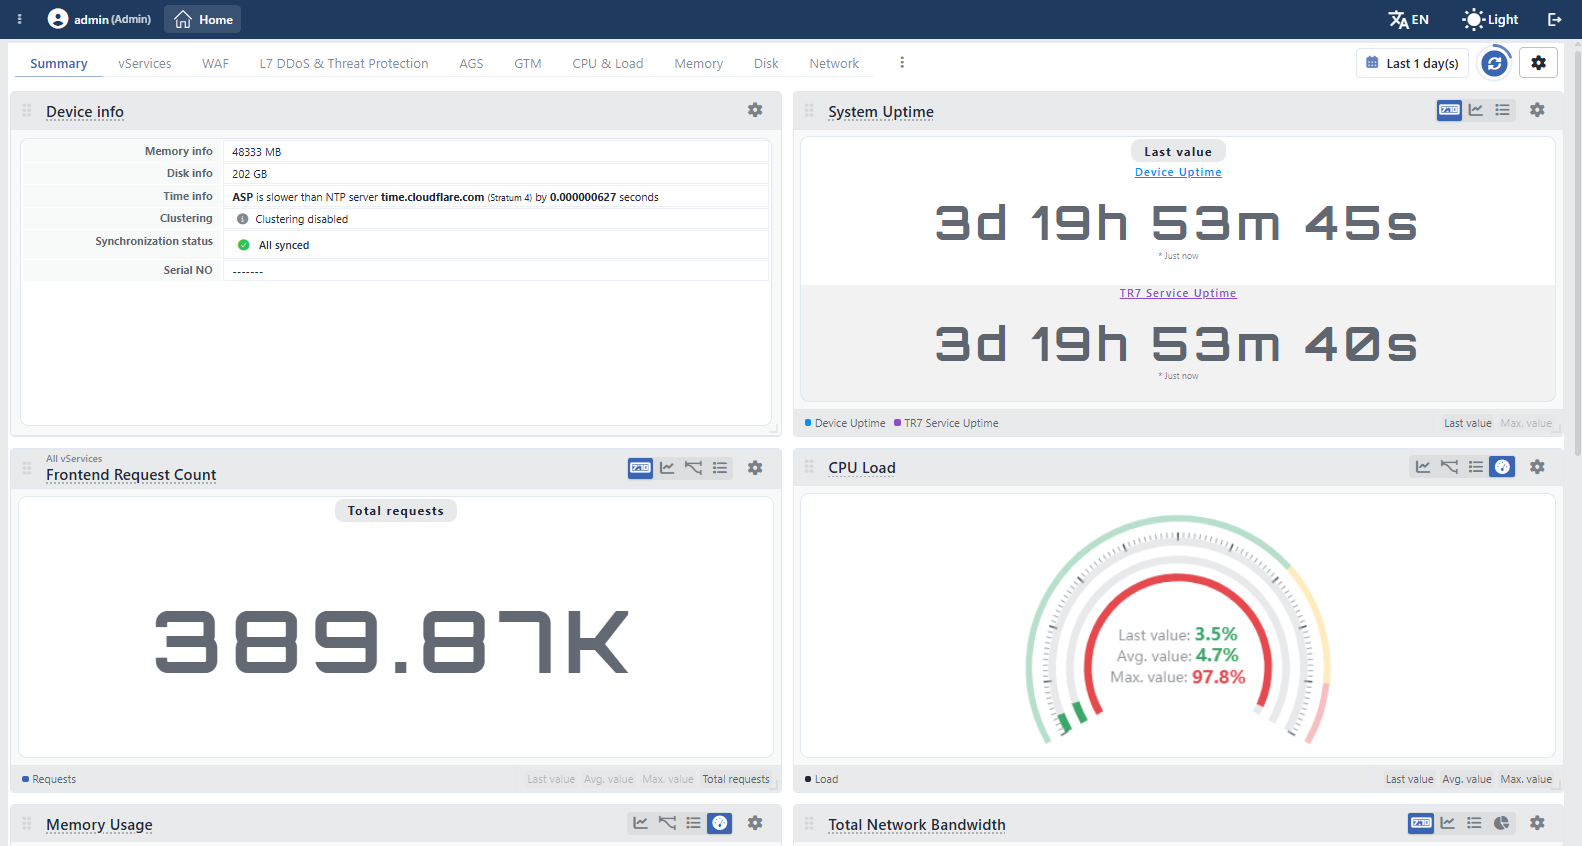 The Summary Tab
The screen controls are common to all the tabs
The time range selector, the refresh, the settings, the template menu and the arrangement of the panels are the same in all the view tabs of the home page; for the detail, see Screen Controls.
Panels
The nine panels in the Summary tab have been hand-picked and each of them is bound to its own permission area:
| Panel | Required permission |
|---|---|
| Device info, System Uptime, CPU Load, Memory Usage | Settings |
| Frontend Request Count | Load Balancer |
| Total Network Bandwidth, Total Network Packets | Network |
| AGS Concurrent Sessions | Load Balancer |
| DNS Query Rate | GTM |
The order of the panels is Device info, System Uptime, Frontend Request Count, CPU Load, Memory Usage, Total Network Bandwidth, Total Network Packets, AGS Concurrent Sessions and DNS Query Rate. The panel of an area for which there is no permission is not created in the tab at all. All the panels are one card wide and one card high by default.
The total panels are displayed even if the feature is not used
The Frontend Request Count, AGS Concurrent Sessions and DNS Query Rate panels are device-wide totals. Even if there is no HTTP type vService, no vService whose AGS is on or no DNS service on the device, the panel takes place in the tab; in this case No data is displayed in the value sections.
Device info
Lists the hardware, clock, cluster and synchronization status of the device as rows. There is no chart or summary strip in the panel; no view icon takes place in the title, only the panel settings icon is present. If the cluster has been enabled, a second column is opened for the rows that change per device.
| Row | Meaning |
|---|---|
| Memory info | The total memory of the device, in MB. In a cluster it is shown in a single column. |
| Disk info | The total size of the disks on the device, in GB. In a cluster, if the values of the two devices are equal, it is shown in a single column. |
| Time info | The status of the device clock according to the NTP server. While the clock is matched, how many seconds the clock is behind or ahead of the server is written in the form <device name> is slower than NTP server <server> (Stratum <N>) by <difference> seconds or … is faster than …; if the server cannot be matched, a red Cannot synchronize with NTP server is displayed. For the NTP settings, see NTP Time Sync. |
| Clustering | The cluster status (in a cluster it is shown in a single column): Cluster connection is OK (green), Clustering error (red; the cluster is enabled but there is no connection to the peer device) or Clustering disabled (gray). |
| Synchronization status | The summary of the configuration synchronization. If all the fields are synced, All synced is displayed with a green check icon; while the synchronization continues, the text Syncing <field>... for a single field, Syncing <field> (both devices)... if the field is being synchronized on both devices, Syncing <N> fields... for more than one field and the progress ratio next to it, <N> field(s) out of sync if there is a difference, <N> sync error(s) if there is an error, <N> waiting... if there is a locked field, <N> queued if there is a field waiting in the queue, and Cluster Disconnected when the cluster connection is lost, is written. If more than one status is valid at the same time, a single text is printed; the priority order is an error, an ongoing synchronization, a lost cluster connection, an out-of-sync field, a locked field and the queue. If there is an ongoing synchronization, an error, an out-of-sync field, a locked field or a queued field, a detail window that lists them opens when it is hovered over; in the All synced state the window is not displayed. When the row is clicked, the HA Clustering & Sync screen is opened. |
| Serial NO | The serial number of the device. If it has not been written by the manufacturer, the placeholder reported by the device (such as -------) is displayed, and if the field is not present at all, -. |
| Bandwidth Limit | The bandwidth limit in the device license (Mbit/s or Gbit/s). If no limit is defined on any device, the row is not displayed. |
The Time info, Synchronization status, Serial NO and Bandwidth Limit rows are shown in a separate column per device in a cluster even if their values are equal. In the users of the cloud client type, the Memory info, Disk info and Clustering rows are not displayed.
System Uptime
Shows the uninterrupted operation time as two series: Device Uptime and TR7 Service Uptime. The values are printed in a readable form such as 3d 19h 53m 45s; as a summary, only Last value comes open and the measurement time (* Just now) is written under the value. The data is recorded every five seconds.
| Series | Meaning |
|---|---|
| Device Uptime | The time that has passed since the last startup of the device. It is reset when the device is restarted. |
| TR7 Service Uptime | The time that has passed since the last start of the TR7 service. It is reset when the service is restarted even if the device stays on; for this reason its value can be smaller than Device Uptime. |
In cluster setups, the time of every device is shown as a separate series, they are not summed. If the cluster is enabled, the TR7 Service Uptime series comes closed; the series is opened by clicking it in the strip under the panel.
Frontend Request Count
Written All vServices above its title, this panel shows the total of the requests coming to all the HTTP type vServices on the device (the Requests series). As a summary, only Total requests comes open: the total number of requests that came in the selected time range is printed abbreviated, such as 389.87K. Since the L7 TCP and Network vServices do not carry a request counter, they do not enter the total.
In cluster setups, the requests of the two devices are summed and a single value is shown. For the same panel belonging to a single vService, see Frontend Request Count.
CPU Load
Shows the processor usage of the device as a percentage (the Load series): the ratio of the time the processor has not spent idle over all the cores. In the gauge, Last value, Avg. value and Max. value take place as three nested rings and their values are written in the middle of the gauge.
The rings are colored according to the value: green up to 70%, yellow between 70% and 90%, red at 90% and above; in the values between the thresholds the color transitions gradually. The thin outer ring shows these threshold bands. For the usage type and core breakdown, the CPU Usage and CPU Cores panels in the CPU & Load tab, and for the 1, 5 and 15 minute load average, the System Load panel are used (CPU & Load). In cluster setups, a separate gauge is laid out for every device.
Memory Usage
Shows the usage ratio of the device memory (the Used % series). The ratio is calculated by subtracting the memory that can still be given to the applications from the total memory; the reclaimable caches and buffers of the system are not included in the used memory. In the gauge, Last value, Avg. value and Max. value take place as three rings.
The color thresholds are the same as CPU Load (70% yellow, 90% red), but the color does not transition gradually: the value takes the color of whichever threshold it has passed. For the memory distribution, the Memory tab is used. In cluster setups, a separate gauge is laid out for every device.
Total Network Bandwidth
Shows the total data flow of the interfaces defined on the device as two series: RX Traffic (received) and TX Traffic (sent). As a summary, Last data/s, Avg. data/s and Total data come open; the rates are printed as bits per second such as Mbps, and the total as bytes such as GB.
In cluster setups, the values of every device are shown separately. For the detail of the network panels, the Network tab is used.
Total Network Packets
Shows the number of packets received and sent per second on the same interfaces: RX Packets and TX Packets. As a summary, Last pkt/s, Avg. pkt/s and Total packets come open. In cluster setups, the values of every device are shown separately.
AGS Concurrent Sessions
Written All vServices above its title, this panel shows the total of the sessions that are open at that moment on all the vServices whose AGS is on (the Total Concurrent Sessions series). As a summary, Last sessions, Avg. sessions and Max. sessions are printed in three separate sections.
In cluster setups, the values of the two devices are summed. For the session status and authentication breakdown of the sessions, the AGS tab, and for a single vService, the AGS Concurrent Sessions panel are used.
DNS Query Rate
Written All DNS Services above its title, this panel shows the total of the UDP and TCP queries coming to all the DNS services (the Total Queries series). As a summary, Avg. q/s, Max. q/s and Total queries come open; Last value is closed. The data is recorded every five seconds.
The Stat Table view is not offered in this panel. In cluster setups, the values of the two devices are summed. For the detail of the DNS traffic, the GTM tab, and for a single DNS service, the DNS Query Rate panel are used.
Scope and Limits
INFO
- The content of the tab narrows according to the user permission. Every panel is bound to its own permission area. Since none of the panels is bound to the WAF permission, in a user who has only the WAF permission and in a user who does not have the permission of any panel, the tab opens only with the Add Visualization card.
- The panel list is fixed, the panels that can be added are broad. The nine panels in Summary have been hand-picked; with Add Visualization, the panels in the other tabs of the home page are also added to this tab.
- The totals belong to the device as a whole. The request, AGS session and DNS query panels do not make a service distinction; for the distribution on a service basis, the vService Distribution tables in the vServices, AGS and GTM tabs or the dashboards of the services themselves are used.
- The combination in a cluster changes according to the panel. In the request, AGS session and DNS query totals, the values of the two devices are summed; in the uptime, processor, memory and network panels, the value of every device is shown separately.
- There is no transition to another screen from the cards. The only clickable item in Summary is the Synchronization status row in the Device info panel.
