
Smarter by Design.Simpler for Business
Remote Devices (Data Centers)
What Is a Remote Device?
Remote Device is the definition that makes it possible for another TR7 device working in a different data center to be monitored from this device. Every definition is queried with the determined period over the specified WAN and LAN access addresses, and the internet status, the WAN/LAN accessibility, the processor (CPU), the memory (Memory), the bandwidth (BW) of the other device and the status of the vServices on that device are collected.
In the GTM architecture every device has two roles: a local data center that defines its own identity and the remote data centers that it monitors. The local data center is defined with its name, the addresses that the other devices will reach, the internet access scenario and the maintenance mode from the Settings tab in the bottom strip of this screen. A device produces its own internet status and maintenance mode itself; the remote devices read this information during the query.
The collected metrics feed the scenarios and the record selectors on the Health Scenarios screen that determine to which data center the DNS records in the Datacenter and Disaster Recovery modes will be routed.
Central Monitoring
Multiple data centers
All the remote data centers are monitored and managed from a single screen
Live Metrics
CPU · Memory · BW · vService
The resource usage and the vService status of the remote device are collected at every query
Double Path
WAN + LAN
The WAN and LAN addresses are checked separately in every cycle
5
Automatic health check
For every remote data center the access, WAN, LAN, internet and maintenance checks are created by themselves
Maintenance Mode
Planned work
The maintenance mark is published to the other devices and used as a condition in the scenarios
DNS Decision
Datacenter · Disaster Recovery
The data center status and metrics guide the record selection
How does it work?
- For every remote data center the WAN and/or LAN access addresses are defined.
- TR7 queries the defined addresses with the Access Period interval: first the WAN list and then the LAN list is tried; in every list the first answering address is enough.
- The answering device returns the internet status, the maintenance mode, the CPU, the memory, the bandwidth, the vService list and the DNS record set as a single information packet. The result is reflected in the Status circle in the list at the moment of the query.
- The same results go to the automatic health checks of the data center; these checks change status with the Required Success / Required Failure thresholds and route the DNS records over Health Scenarios.
Its Place in the GTM Architecture
The remote data centers are the data source that feeds the multi-data-center DNS routing of GTM. The chain that comes into play when a remote data center is added works as follows:
- The automatic health checks are produced. For every remote data center that is added, five automatic Health Checks that cannot be edited are created and appear in the Automatic Health Checks list on the Health Checks screen: WAN access to
<name>is successful, LAN access to<name>is successful, Access to<name>is successful,<name>has internet access and<name>is under maintenance. For the local data center only the<name>(local)has internet access and<name>(local)is under maintenance checks are produced. The checks inherit the Required Success / Required Failure values of the data center; if these values are not defined in the data center, 3 is used and the two checks of the local device also work with the 3 / 3 thresholds. The five checks are produced even if the related address type is not defined: the WAN access to<name>is successful check of a data center for which only a LAN address is defined never passes to success; in the scenarios only the check of the defined access type must be used. In the Automatic Health Checks list there are also the fixed Always and Never checks. - They are combined in the health scenarios. The automatic checks, together with the user-defined checks, are turned into composite conditions with the AND / OR / NOT logic on the Health Scenarios screen (e.g. the access to the main data center is cut and the local device has internet access). An automatic scenario is not produced per data center; in the Automatic Health Scenarios list there are only Always and Never.
- They determine the DNS routing. The scenario results and the data center metrics manage the Disaster Recovery switching on the Records screen and the data center sorting in the Datacenter mode (CPU, memory, bandwidth or service status).
In this way the real-time accessibility and the resource status of a data center are reflected in the DNS answers that return to the clients.
The Status Values
In the list and the preview panel the status of the data center is shown with one of the values below; the value is updated instantly according to the result of the last query:
| Status | Color | Meaning |
|---|---|---|
| OK | green | The access to the defined ones among the WAN and LAN lists is provided. |
| no WAN access | yellow | There is LAN access, none of the WAN addresses answers. |
| no LAN access | yellow | There is WAN access, none of the LAN addresses answers. |
| No access | red | No access can be provided from any address. |
| No internet | red | Only for the local data center: the internet access scenario is passive or is not selected. Since the local device is not a row in the list, this value is monitored from the Local Internet Status field in the bottom strip and from the GTM dashboards. |
| Unknown | the interface accent color (blue) | A data center that has not been queried yet. |
A data center for which only a LAN address is defined does not produce a status for WAN; no WAN access is seen only while a WAN address is defined.
Operational Best Practices
- Both WAN and LAN access must be defined. The two lists are checked separately in every cycle; when any one of the two answers, the data center is considered accessible. In this way a false alarm is prevented for a data center that is in working condition while one of the paths is problematic.
- The access period must be adjusted according to the environment. The default is 5 minutes; too short periods create a network load and too long periods make the metrics stale. If the field is left empty or zero, the query is made every 60 seconds.
- The Required Success / Required Failure values manage the automatic checks. These thresholds affect not the status circle in the list but the automatic health checks of the data center; in order for the scenarios not to change unnecessarily in the temporary network fluctuations, Required Failure is kept at a value such as 2–3.
- In the scenarios only the check of the defined access type must be used. The automatic check produced for the other access type of a data center for which only a LAN (or only a WAN) address is defined never passes to success; if this check is taken into a scenario, the condition remains false continuously.
- The maintenance mode must be bound to the scenarios. Maintenance Mode does not take the data center out of the routing by itself; it publishes the maintenance mark and activates the
<name>is under maintenance check. If it is desired that the traffic shifts in a planned maintenance, this check is added with a NOT condition to the health scenario that the records use. - The local access addresses must be configured correctly. In order for the other TR7 devices to be able to reach this device, a suitable IP and port are defined in the Access Addresses list in the Settings tab; the WAN/LAN addresses entered on the remote devices must match this list. Every address creates an automatic firewall rule that routes to the GTM access service.
- The monitoring must be established mutually. Defining a device here only makes this device monitor it; the other device must also add this device to its own Remote Devices list.
- The dependencies must be reviewed before deleting. The health scenarios and the DNS record configurations that refer to the deleted data center are not cleaned by themselves.
How to Add?
A new remote data center is added through the TR7 web management interface with the steps below:
- The Configuration Menu is opened by clicking the TR7 logo at the bottom left.
- The GTM → Remote Devices (Data Centers) → Add steps are followed.
- A unique and descriptive name is entered for the remote data center.
- The WAN and/or LAN access addresses, the access period and the thresholds are configured.
- The remote data center is added by clicking the
Addbutton.
TIP
Reaching the page via quick search
Instead of navigating the menu step by step, the related page is reached directly by using the search bar in the bottom left corner of the screen. The search bar opens with the Alt + T shortcut on Windows and Opt + T on macOS; typing the name of the feature being searched for is then sufficient.
The added remote data center can be used in the health scenarios, in the data center selection of the DNS records and in the health checks of the Datacenter HC type.
Remote Devices Listing Screen
By following the GTM → Remote Devices (Data Centers) path, the list of all the remote data centers defined on the TR7 device is reached. Remote data center adding, editing and deleting and the local data center settings are done through this screen.
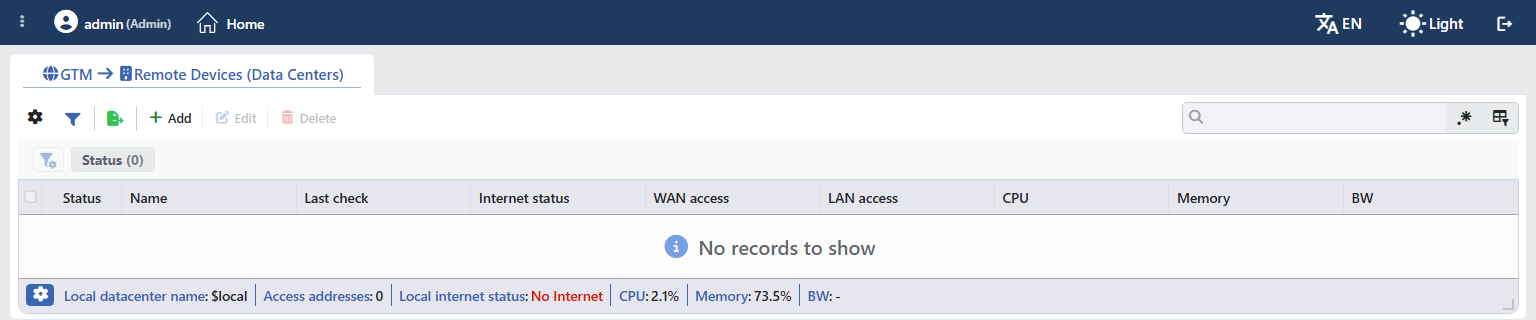 Remote Data Centers Listing Screen - Default
 Remote Data Centers Listing Screen
The table opens with the following columns by default:
| Column | Description |
|---|---|
| Status | The status of the data center is shown with a colored circle; when it is hovered over, the status text appears (see The Status Values). In a cluster a separate circle is shown for every device; every device queries the remote data center itself. The sorting and the Status filter use only the result of this device. |
| Name | The name of the data center. If the remote device is in the maintenance mode, (Maintenance mode) is added to the end of the name and the whole row is highlighted in beige. |
| Last Check | The time that has passed since the last query (e.g. 12s, 3m 5s); it is refreshed at every attempt even if the query fails. |
| Internet Status | The result of the own internet access scenario of the remote device: Has internet (green) or No Internet (red); if there is no information, -. |
| WAN Access | The access from the WAN addresses: Has access (green) or No access (red); if no WAN address is defined, -. |
| LAN Access | The access from the LAN addresses: Has access / No access; if no LAN address is defined, -. |
| CPU | The processor usage of the remote device, as a percentage. |
| Memory | The memory usage of the remote device, as a percentage. |
| BW | The total network traffic of the remote device (bps, Kbps, Mbps, Gbps, Tbps). |
There is no column hidden by default; these nine columns are in the column selector. The table is not sorted by default; it is sorted by clicking a column header. The local device does not take place as a row in the list; its information is shown in the strip under the table. The list updates by itself as the query results arrive.
The items in the toolbar are arranged from left to right in the following order; the last item (Settings) is in the information strip under the table. There is no pagination on this screen; the Page Information and Page Size items are not present and all the data centers are listed on a single page.
Columns
Which columns are shown in the table is selected; all nine columns are on by default. In the same panel, columns are reordered by dragging and alignment is selected per column; the row height is fitted to the page with the Fit rows to the page button, and the column layout is reset to default with the Reset button. When the width badge next to a manually widened column is clicked, the column returns to the automatic width. The layout is stored per user.
Filter
The filter button with the funnel icon (tooltip: Filter) opens and closes the filter strip above the table; the button shows the number of active filters with a badge. In this list there is a single card: Status. In the card the status values seen in the list at that moment are listed, with the number of rows that have that value in parentheses next to each of them, and more than one value can be selected together; the selections are displayed as a label in the Status = Value form and are removed with the close icon on the labels. The layout of the card is stored per user.
Export
The table is exported as Excel, CSV or PDF by clicking the Export button. In the window that opens, the Filename, Format and Data Source, together with the Columns to be exported, are determined; the remaining fields are displayed according to the format: CSV Separator for CSV, Excel Sheet Name for Excel, and Page Orientation and Page Size for PDF.
Add
By clicking the Add button, the form for creating a new remote data center opens in the Add tab.
Edit
By clicking the Edit button, the editing form of the selected data center opens in the Edit tab. The button becomes enabled only when a single data center is selected. The editing form is the same as the add form; no field is locked and the change is saved without asking for confirmation. When Access Period, WAN Access or LAN Access changes, the query cycle restarts immediately with the new settings; the other changes become valid at the next query. When the name changes, the names of the automatic health checks are updated as well. The save is written into the user operation record (Datacenter "<name>" is edited).
Delete
When one or more data centers are selected and the Delete button is clicked, the related data centers are deleted. Before deleting, the "Are you sure?" confirmation is asked. The button is passive while there is no selection.
WARNING
The five automatic health checks of the deleted data center are removed and its querying stops.
The health scenarios that refer to these checks and the DNS record and domain name configurations that use this data center are not cleaned by themselves; the related scenarios and records must be reviewed manually. The deletion is reflected to the peer device in a cluster installation as well and is written into the user operation record (Datacenter "<name>" is deleted).
Search
Used to search all information in the table.
RegExp Search
Used to search all the information in the table with a regular expression (RegExp). While Column Based Search is on, this switch is not displayed at all; the own RegExp switch of every search line is used.
Column Based Search
Used to perform a column-based search on the information in the table; a separate search line opens for every column and next to every box there are the Negate button that reverses the result and its own RegExp key.
Settings
The gear icon at the left of the strip under the table opens the local data center settings in the Settings tab (see The Local Data Center Settings). In the strip, from left to right, the information of the local device takes place: Local Datacenter Name (the name; while it is in the maintenance mode the background is colored and (Maintenance mode) is added to the end of the name), Access Addresses (the number of defined access addresses; when it is hovered over, the addresses are listed in the ip:port form and with their status color in the interface), Local Internet Status (Has internet / No Internet), CPU, Memory and BW (the instant values of the local device).
Right-Click Menu
When a row is right-clicked, a menu with the name of the data center in its title opens. Both operations in the menu apply only to the right-clicked data center; a selection made in the list does not affect the menu.
| Operation | What it does |
|---|---|
| Edit | Opens the editing form of the data center in the Edit tab; it is the same as the form opened by the Edit button in the toolbar. |
| Delete | Deletes the right-clicked data center; the same confirmation question as the deletion in the toolbar is displayed. |
Preview of the Selected Data Center
When a row in the list is clicked, the preview of the data center opens on the right of the screen; when the selected row is clicked again, the panel closes. In the title there are the status circle (in a cluster one circle for every device), the name of the data center and the Datacenter subtitle, and at the top right there are two operations.
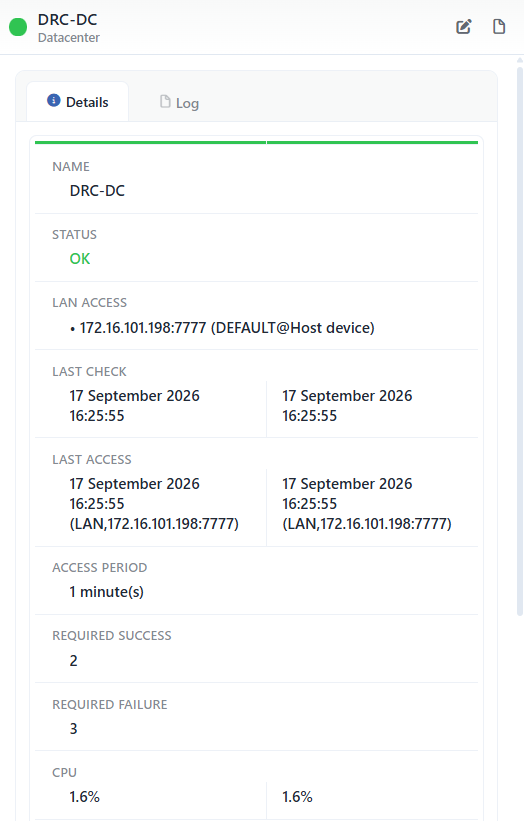 Preview of the Selected Data Center
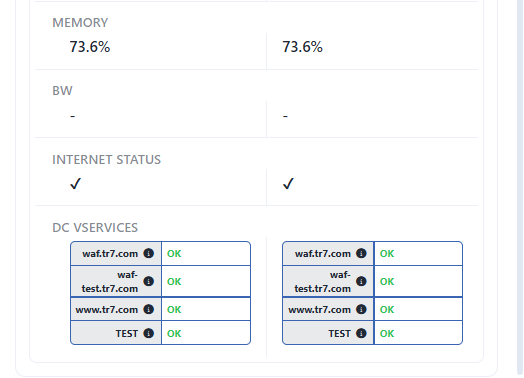 The Lower Part of the Preview Panel
| Operation | What it does |
|---|---|
| Edit | Opens the editing form of the data center in the Edit tab. |
| Log | Opens the GTM event records and the user operations that belong to the data center in a window, without leaving the page. |
The panel has two tabs:
Details
Lists the configuration and status lines of the data center (the table below).
Log
Lists the operations performed on the data center and the GTM events that belong to it (the WAN/LAN access and internet status changes) as a timeline.
The rows in the Details tab are as follows, in order. In a cluster the table is shown with two value columns without a header: the configuration lines are written once and the live measurement lines (Last Check, Last Access, CPU, Memory, BW, Internet Status, Record Status, DC vServices) separately for every device; Status is separated only when the two devices give a different result.
| Row | Description | Visibility condition |
|---|---|---|
| Name | The name of the data center. | Always |
| Status | The status text, with the status color. | Always |
| WAN Access | The defined WAN addresses; every address with the • bullet and in the ip:port (route table@vDevice) form, and more than one address is written one under the other. | While a WAN address is defined |
| LAN Access | The defined LAN addresses, in the same form. | While a LAN address is defined |
| Last Check | The date and the time of the last query. | Always |
| Last Access | The address from which the access was provided in the last query and its time (date (WAN,ip:port) or (LAN,…); if both lists answered, the WAN line is written); if the last query failed in both lists, -. | Always |
| Access Period | The query period. | Always |
| Required Success | The number of consecutive successes required for the automatic checks to pass to healthy. | Always |
| Required Failure | The number of consecutive failures required for the automatic checks to pass to unhealthy. | Always |
| CPU | The processor usage of the remote device (%). | Always |
| Memory | The memory usage of the remote device (%). | Always |
| BW | The total network traffic of the remote device. | Always |
| Internet Status | If the remote device has internet access, ✔, and if it does not, -. | Always |
| Record Status | The currentness of the DNS record set received from the remote device: Actual or Renewed at <date>. | While a device uses the old record set |
| DC vServices | The vServices on the remote device; in every row the vService name, the information icon and the status text. | When the remote device reports a vService |
When the information icon in the DC vServices row is hovered over, Name, Type, Status and Statistics (the incoming and outgoing traffic, the requests, the connections, the sessions, the CPU, the memory, the bandwidth, the number of healthy Backend Services) are displayed; the statistics come filled only on the vServices that are running and healthy, and on the others - is written.
Remote Device Add Form
A new remote data center is added on the TR7 device by following the GTM → Remote Devices (Data Centers) → Add steps. The fields are explained below in the screen order.
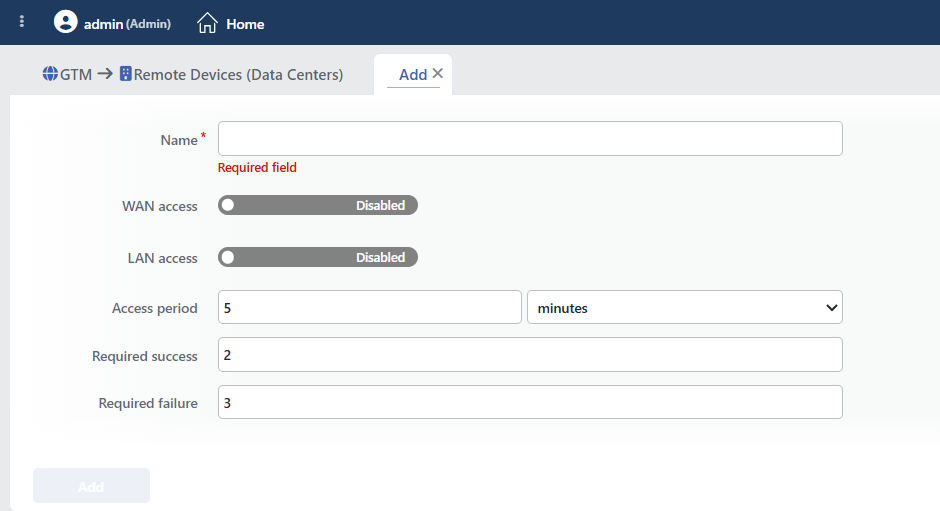 Remote Data Center Add Form
INFO
Name Required
The name of the remote data center is entered. The name starts with a letter; it consists of letters, digits, _ and - characters and is 3–20 characters long. The name identifies the data center in the list, in the names of the automatic health checks and in the logs. This screen does not prevent the same name from being used in a second data center; giving a distinctive name is recommended.
INFO
WAN Access Default: Disabled
The addresses over which the remote device will be accessed over the wide area network are defined. The field is opened with the Enabled / Disabled switch; when the switch is turned on, one empty row occurs, and when it is turned off, all the addresses are deleted. In the table there are two headers: IP&Port and Access Source; the plus icon is in the Access Source header and adds a new row, and the trash can icon at the end of the row deletes the row. In every row there are four entries from left to right:
IP
The WAN access IP address of the remote device; the address is written freely, it is not selected from a list.
Port
The access port (1–65535).
vDevice
From which virtual device the query will be made; the default is Host Device.
Route Table
From which route table of the selected vDevice the query will be made; the default is DEFAULT.
When more than one address is defined, they are tried in order; the first answering address is enough for the WAN access.
A half-filled row is not accepted
A row in which only one of the IP and the Port is filled is shown as an error before the form is saved; a row in which both fields are left empty, on the other hand, is ignored.
INFO
LAN Access Default: Disabled
The addresses over which the remote device will be accessed over the local network are defined. The structure, the switch, the headers and the row entries (IP, Port, vDevice, Route Table) of the field are the same as WAN Access. The WAN and LAN lists are checked separately in every cycle; when any one of the two lists answers, the data center is considered accessible, and the WAN and LAN status is shown separately.
INFO
Access Period Default: 5 minutes
How often the remote data center will be queried is entered; in the unit selector next to the number there are seconds, minutes and hours. If the field is left empty or zero, the query is made every 60 seconds.
INFO
Required Success Default: 2
The number of consecutive successful queries required for the automatic health checks of the data center to pass to healthy; an integer between 1–100. The threshold does not affect the status circle in the list; the circle shows the result of every query instantly.
INFO
Required Failure Default: 3
The number of consecutive failed queries required for the automatic health checks of the data center to pass to unhealthy; an integer between 1–100.
INFO
Add
The remote data center adding process is completed by clicking the Add button. Together with the adding, the five automatic health checks of the data center are created, the first query is started immediately (until the result arrives, the status appears as Unknown), the definition is reflected to the peer device in a cluster installation as well and the operation is written into the user operation record (DC "<name>" is created).
The Local Data Center Settings
The data center identity of the local TR7 device is configured from the Settings tab opened with the gear icon in the bottom strip of the listing screen. The form is always in the editing mode and its button is Edit.
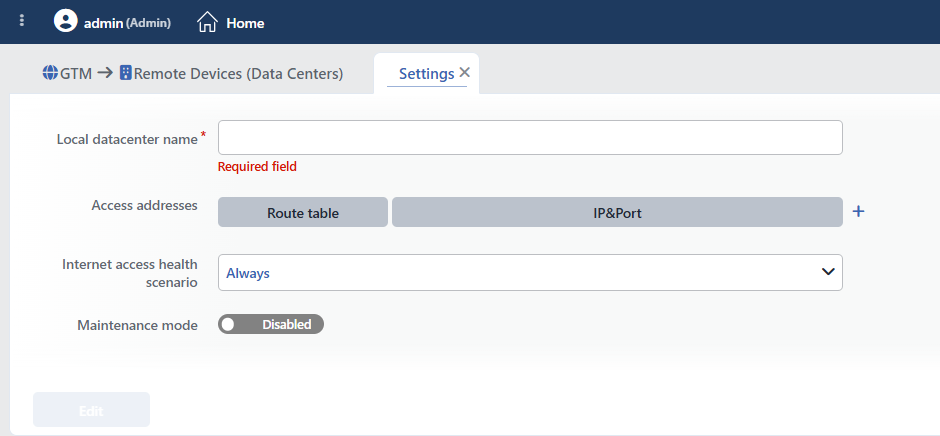 The Local Data Center Settings
INFO
Local Datacenter Name Required
The data center name of the local device is entered; the name rule is the same as the remote data center name (it starts with a letter, letters/digits/_/-, 3–20 characters). The name appears as <name>(local) in the own automatic checks of this device, in the bottom strip and in the lists of the other devices. When no name is defined, $local is written in the strip.
INFO
Access Addresses
The addresses over which the other TR7 devices will reach this device are defined. In the table there are two headers: Route Table and IP&Port; the plus icon is in the IP&Port header and the new row opens with the first defined IP selected and the port empty (until the port is entered, an error is shown), and the trash can icon at the end of the row deletes the row. There is no separate vDevice selection; the addresses belong to the main device. In every row, from left to right:
Route Table
The route table to which the address belongs.
IP
One of the IP addresses defined in the selected route table is selected; a free address cannot be entered.
Port
The port to be opened to the access (1–65535). The same address and port being used in another service is shown as an error before the form is saved.
For every address, an automatic firewall rule that routes the incoming connections to the GTM access service is created (it appears among the automatic rules on the Firewall screen with the GTM DNAT rule description) and the address is reserved device-wide for this use. The remote devices enter one of these addresses as a WAN or LAN address in their own Remote Devices definitions.
INFO
Internet Access Health Scenario
The scenario that determines the internet access status of the local device is selected. In the list, first the user-defined Health Scenarios records and then the automatic scenarios Always and Never take place; the Add button next to the selector opens the form for adding a new scenario and assigns the saved scenario to the field. The field can be left empty; when no scenario is selected, the internet access is considered nonexistent.
| Option | Meaning |
|---|---|
| Always | The internet access is considered to always exist. |
| Never | The internet access is considered nonexistent. |
| A health scenario | While the selected scenario is active, the internet access is considered to exist, and while it is passive, nonexistent. |
The result determines the Local Internet Status value in the bottom strip, the status of the local data center (No internet while the scenario is passive), the <name>(local) has internet access automatic check and the Internet Status column that the remote devices see for this device.
INFO
Maintenance Mode Default: Disabled
With the Enabled / Disabled switch the local device is taken into the maintenance mode. While the switch is on, the name block in the bottom strip is colored and (Maintenance mode) is added to the end of the name, the row is highlighted in beige in the lists of the remote devices that monitor this device and the <name>(local) is under maintenance automatic check becomes active.
The maintenance mode does not change the DNS routing on its own: in order for the records to be taken away from the data center that is under maintenance, this automatic check is added as a condition to the health scenario that the related records use.
INFO
Edit
The local data center settings are saved by clicking the Edit button; while there is an erroneous field in the form the button is passive, and the save does not ask for confirmation. The settings are written as a whole, the automatic firewall rules are reproduced and the operation is written into the user operation record (Own DC settings are edited).
Operating Mechanism
INFO
- The query cycle. For every remote data center a separate timer works; at every attempt first the addresses in the WAN list and then in the LAN list are tried in order and in every list the first successful address is enough; both lists are tried in every cycle and when both of them answer, the information packet is taken from the LAN answer. At every address attempt the connection must be established within 2 seconds and the query must be completed within 10 seconds; the periods are per address. The rows whose IP or port is empty are skipped. The query is made over the vDevice and the route table selected in the row.
- The connection form. The access address of the remote device is connected to with HTTPS; certificate verification is not done; there is no credential defined by the user, the devices carry a built-in fixed verification key between them in the request header and the requests whose key does not match are rejected with 401 Unauthorized. The answer is the instant information packet of the remote device (the CPU, the memory, the bandwidth, the internet status, the maintenance mode, the vService list and the DNS record set).
- The status and the periods. Status reflects the result of every query instantly; Last Check shows the time of the last attempt and Last Access the last successful access. The query results are stored on the device and are restored at a restart.
- The automatic checks. The query result is conveyed to the automatic health checks of the data center as an event; the checks change status according to the Required Success / Required Failure thresholds. The additional checks towards the vServices of the remote device are defined manually with the Datacenter HC type on the Health Checks screen.
- The cluster. The remote data center definition is reflected to the peer device as well; every device makes the query itself and keeps its own result. For this reason two status circles are seen in the list and two value columns in the preview.
Scope and Limits
INFO
- The screen requires a GTM license and full GTM authorization. The GTM tab is visible with the display authorization; this screen opens only on the users who have full authorization in the GTM area, and if there is no GTM module in the license, the Not covered by your license card is displayed.
- The name uniqueness is not enforced. A second data center that carries the same name can be saved; distinctive naming is the responsibility of the administrator.
- The monitoring is one-way. Defining a device here only makes this device monitor it; for mutual monitoring every device adds the other one to its own list.
- The local device does not take place in the list. The information of the local data center is shown in the bottom strip and is edited only from the Settings tab.
- The deletion does not clean the dependencies. The health scenarios and the record configurations that refer to the deleted data center must be updated manually.
- The logs. The access and internet status events that belong to the data center and the user operations are monitored in the Log window on the preview panel and on the GTM Logs screen.
Usage Location
The defined remote data center is selected on the screens below:
| Screen | Where it is used |
|---|---|
| Health Checks | In the Datacenter field of the check of the Datacenter HC type; the CPU, the bandwidth, the number of services and the vService metrics of the data center are compared with a threshold. In addition, when a data center is added, five automatic checks are created in the Automatic Health Checks list. |
| Health Scenarios | The automatic checks of the data center are selected in the scenario conditions (Health Check, Activation Check, Deactivation Check). |
| Records | In the data center list of the records in the Datacenter mode and in the Disaster Recovery configuration. |
