
Smarter by Design.Simpler for Business
AGS
What Is AGS?
AGS is the view tab that gathers the access gate table of all the vServices whose AGS is on on the device on a single screen on the TR7 home page. The tab consists of three subtabs: Sessions shows the session, user, authentication, audit record and request authorization totals; Lockouts the number of the account lockouts and their scope breakdowns; and MFA the CAPTCHA and one-time code verifications channel by channel.
The panels on which All vServices is written above the title are the device-wide equivalent of the AGS panels on the Dashboard screen of a single vService; the value is the total of all the vServices whose AGS is on. The table on which vService Distribution is written above the title, on the other hand, lists the same metric as one row per vService; this table is present only on the home page.
The scope of the totals depends on AGS being on: the traffic of a vService whose AGS is not on does not make a contribution to any panel in this tab. There being a vService whose AGS is on on the device is not required for the tab to be displayed; if AGS is not used at all, all three subtabs open as well, the panels stay empty and the distribution table is displayed without rows.
3
Subtabs
Sessions, Lockouts and MFA; when the upper tab is clicked, Sessions opens
24
Panel
Sessions 9, Lockouts 5, MFA 10; there is no conditional panel in any of the three subtabs
Load Balancer
Required Permission
The tab and all of the twenty-four panels are bound to the Load Balancer permission
vService with AGS
Total Scope
The All vServices panels sum only the vServices whose AGS is on
Access to the AGS Tab
- The Home shortcut on the left of the Header Bar is clicked.
- AGS is selected from the view tabs; the tab opens with the Sessions subtab.
- For the other subtabs, Lockouts or MFA is selected from the second row.
For the Header Bar shortcuts, see Header Bar.
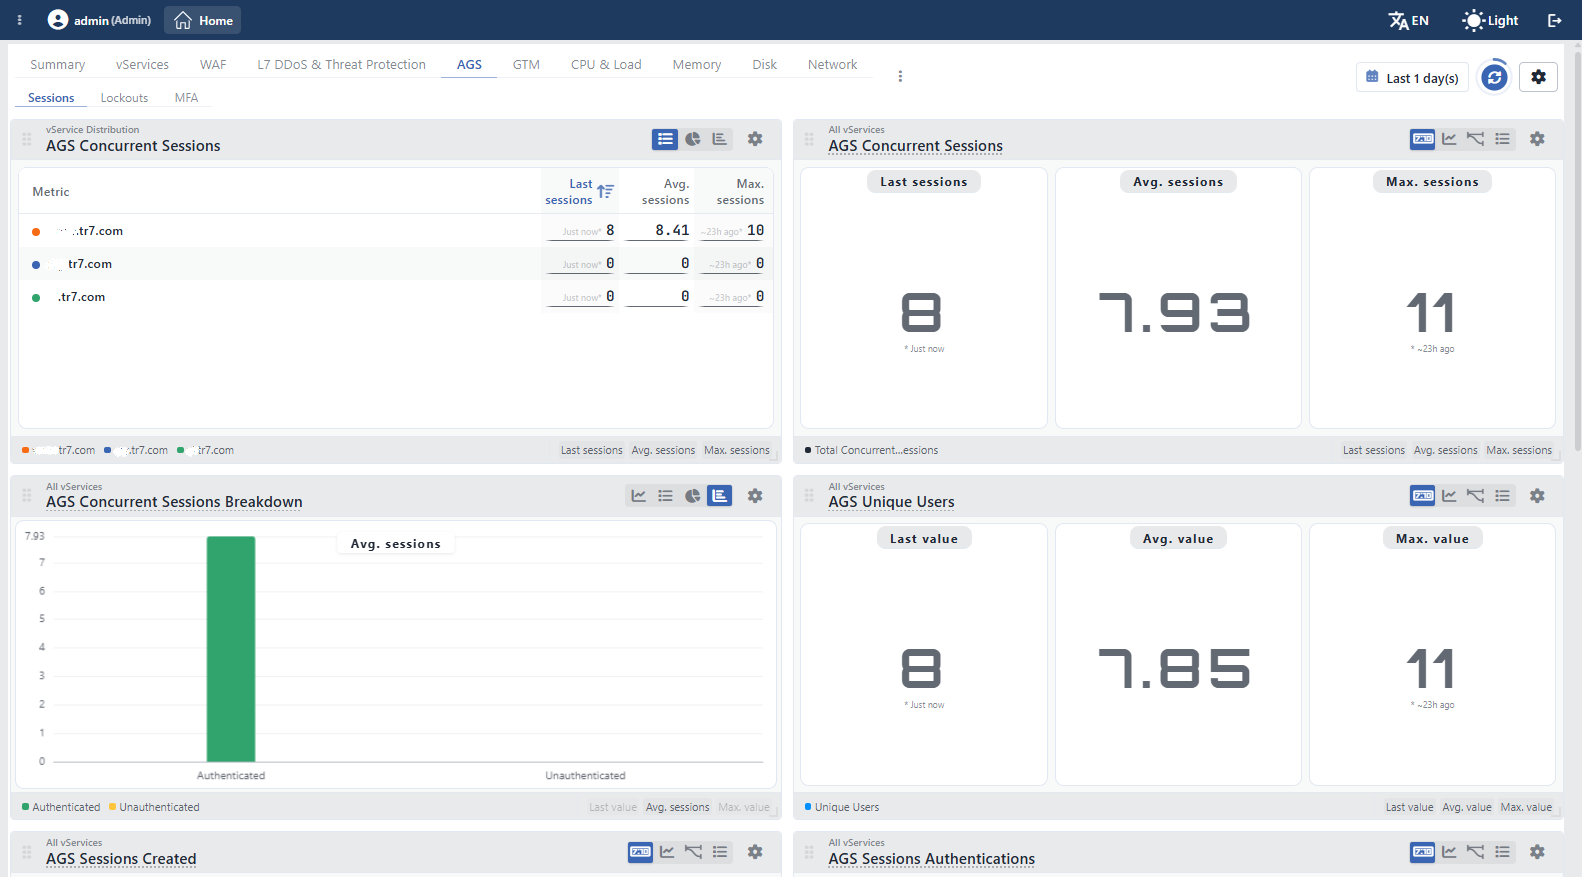 The AGS Tab
The screen controls are common to all the tabs
The time range selector, the refresh, the settings, the template menu and the arrangement of the panels are the same in all the view tabs of the home page; for the detail, see Screen Controls.
Subtabs
| Subtab | Content |
|---|---|
| Sessions | The concurrent session, unique user, session creation and authentication rate, authentication results, audit record and request authorization totals; the session table per vService. |
| Lockouts | The number of the active lockouts, the lockout events and the breakdown of the lockouts according to the scope. |
| MFA | The CAPTCHA, TOTP and e-mail, SMS, custom channel one-time code panels together with the combined total of all the channels. |
The tab is displayed if the user has the Load Balancer permission; all of the panels in the three subtabs are bound to the same permission. In a user who has only the WAF permission the tab does not take place among the view tabs at all. When the AGS tab in the upper row is clicked, Sessions always opens, no matter which subtab was opened before. The second row is displayed only while the AGS tab is selected.
Sessions Tab
There are 9 panels in the Sessions subtab and there is no conditional panel in the tab. The AGS Concurrent Sessions table grows up to two cards high as the content lengthens; the other panels are one card in size. The card width changes according to the screen width: as many columns as the number of cards that fit side by side are opened and the cards fill the column.
With Add Visualization, the vService Distribution tables for AGS Unique Users, AGS Sessions Created and AGS Sessions Authentications are also added to this subtab. The device-wide equivalent of the AGS Authentication Attempts by Provider panel on the single vService dashboard is not produced; the provider breakdown is present on the home page neither in the default layout nor in the Add Visualization menu.
AGS Concurrent Sessions
Written vService Distribution above its title, this table lists every vService whose AGS is on on the device in a separate row; the row name is the name of the vService. The listing looks only at AGS being on in the vService; the vServices whose AGS is not on do not take place in the table. The columns are Last sessions, Avg. sessions and Max. sessions; since an instantaneous value is shown, there is no total column. The table opens sorted from the largest to the smallest according to the Last sessions column and next to these values the time at which the value was measured (such as Just now*, ~23h ago*) is shown in small writing.
The sorting is changed by clicking the column header: the first click sorts from the largest to the smallest, the second click from the smallest to the largest, and the third click removes the sorting. In the strip under the panel, the vService names take place and that row is hidden by clicking a name. When the title is hovered over, a description tooltip does not appear. In the panel, the Stat Table, Pie Chart and Bar Chart views are offered. In cluster setups, the values of the two devices are summed for every vService.
AGS Concurrent Sessions
Written All vServices above its title, this panel shows the total of the sessions that are open at that moment on all the vServices whose AGS is on (the Total Concurrent Sessions series). As a summary, Last sessions, Avg. sessions and Max. sessions are printed in three separate sections. In the panel, the Digital, Line Chart, Mini Chart and Stat Table views are offered.
The panel is the same as the panel in the Summary tab; see AGS Concurrent Sessions. For a single vService, see AGS Concurrent Sessions.
AGS Concurrent Sessions Breakdown
Shows the total of the open sessions according to the authentication state as two series: Authenticated and Unauthenticated. As a summary, only Avg. sessions comes open; the two summaries that stay closed take place in the strip under the panel with the general names Last value and Max. value and are opened by being clicked. In the panel, the Line Chart, Stat Table, Pie Chart and Bar Chart views are offered; in the line view the two series are shown stacked.
For the meaning of the series, see AGS Concurrent Sessions Breakdown.
AGS Unique Users
Shows the total of the number of unique users whose identity has been verified on all the vServices whose AGS is on (the Unique Users series). As a summary, Last value, Avg. value and Max. value are printed in three separate sections. In the panel, the Digital, Line Chart, Mini Chart and Stat Table views are offered.
The counting is done per vService: if the same user has opened a session on more than one vService, they are counted separately for every vService in the total. For a single vService, see AGS Unique Users.
AGS Sessions Created
Shows the total of the new (not yet verified) sessions opened per second (the Created series). As a summary, only Total sessions comes open; the three summaries that stay closed take place in the strip under the panel with the general names Last value, Avg. value and Max. value and are opened by being clicked. In the panel, the Digital, Line Chart, Mini Chart and Stat Table views are offered. For a single vService, see AGS Sessions Created.
AGS Sessions Authentications
Shows the total of the sessions that complete their authentication per second (the Authenticated series). The summary and the views are the same as AGS Sessions Created. When the two panels are read together, how much of the sessions opened has turned into a login is seen across the device. For a single vService, see AGS Sessions Authentications.
AGS Authentication
Shows the total of the authentication operations as four series.
| Series | Meaning |
|---|---|
| Attempts | The number of attempts that reach the authentication provider. |
| Success | The attempts that conclude successfully. |
| Failed | The attempts rejected because the credential is not verified. |
| Errors | The attempts that cannot be concluded for reasons such as the provider not being reached. |
In the table view all of the Last req/s, Avg. req/s, Max. req/s and Total requests columns are listed. In the panel, the Digital, Line Chart and Stat Table views are offered; in the line view the series are shown stacked. To which provider the attempts are distributed is not shown on the home page; for this breakdown the own dashboard of the vService is used. For a single vService, see AGS Authentication.
AGS Audit Events
Shows the total rate of the audit record events produced by all the vServices whose AGS is on (the Events series). As a summary, Last evt/s, Avg. evt/s and Total events come open; the summary that stays closed takes place in the strip under the panel with the general name Max. value. In the panel, the Digital, Line Chart, Mini Chart and Stat Table views are offered.
The records themselves are not listed on the home page; for the record list per vService the Audit Logs tab is used. For a single vService, see AGS Audit Events.
AGS Request Distribution
Shows the distribution of the requests coming to all the vServices whose AGS is on according to the AGS authorization state as three series.
| Series | Meaning |
|---|---|
| Authorized | The requests authorized with a valid session. |
| Unauthorized | The requests that do not have a valid session; the login page requests are counted here as well. |
| Whitelisted | The requests that do not pass the access inspection because they do not fit the AGS scope condition; if a scope condition is not defined, it stays zero. |
The series are shown stacked and as a summary only Total requests comes open. In the panel, the Digital, Line Chart and Stat Table views are offered. The data of this panel is read not from the AGS engine but from the request counters of the load balancer; for this reason it continues to produce data at the moments when the session store of the engine cannot be reached as well. For a single vService, see AGS Request Distribution.
Lockouts Tab
There are 5 panels in the Lockouts subtab and there is no conditional panel in the tab; all of the panels are one card in size. No additional panel is offered in the Add Visualization menu of this subtab. The vService Distribution table for AGS Active Lockouts is not offered in this subtab; the table is added only from the Add Visualization menu of the Summary tab.
The values in the tab show the device-wide effect of the Account Lockout Policies policies. In the three panels with a scope breakdown every lockout scope is a series:
| Series | Scope |
|---|---|
| Username | The lockouts of the policies whose Policy Scope value is Username Only |
| Username + IP | The lockouts with the Username + IP scope |
| IP Address | The lockouts with the IP Address Only scope |
| Composite | The lockouts with the Custom Combination scope |
The four series take place in the panel and show a zero value even if there is no policy in the related scope on the device.
AGS Active Lockouts
Written All vServices above its title, this panel shows the total of the lockouts that are active at that moment on all the vServices whose AGS is on (the Active Lockouts series). As a summary, only Avg. value comes open; Last value and Max. value are opened from the strip. In the panel, the Digital, Line Chart, Mini Chart and Stat Table views are offered.
This panel, which is laid out as a numerical value in the AGS - Summary tab of the single vService dashboard, is a line chart on the home page and in the AGS - Lockouts tab of the vService; see AGS Active Lockouts.
AGS Lockout Events
Shows the total of the lockout events as two series: Created (the newly opened lockouts) and Blocked (the requests blocked because of a lockout). As a summary, only Total events comes open. In the panel, the Digital, Line Chart and Stat Table views are offered.
This panel, which is a line chart in the AGS - Summary tab of the single vService dashboard, is laid out as a numerical value on the home page and in the AGS - Lockouts tab of the vService; see AGS Lockout Events.
AGS Active Lockouts by Scope
Lists the total of the active lockouts according to the scope. In the table view the Last value, Avg. value and Max. value columns are listed for every scope; since an instantaneous value is shown, there is no total column. In the panel, the Line Chart, Stat Table, Pie Chart and Bar Chart views are offered; in the line view the series are shown stacked.
For a single vService, see AGS Active Lockouts by Scope.
AGS Lockouts Created by Scope
Lists the rate of the newly opened lockouts according to the scope. In the table view the Last evt/s, Avg. evt/s, Max. evt/s and Total events columns are listed. The rows open not according to the value but according to the scope order; for the sorting the column header is clicked. Whether the attack is directed at the usernames or at the source addresses across the device is read from this panel. The views are the same as AGS Active Lockouts by Scope; in all three scope panels the slice percentages are shown in the pie view.
For a single vService, see AGS Lockouts Created by Scope.
AGS Lockouts Blocked by Scope
Lists the rate of the requests blocked because of a lockout according to the scope. Its columns, its sorting and its views are the same as AGS Lockouts Created by Scope. For a single vService, see AGS Lockouts Blocked by Scope.
MFA Tab
There are 10 panels in the MFA subtab and there is no conditional panel in the tab; all of the panels are one card in size. No additional panel is offered in the Add Visualization menu of this subtab. The device-wide equivalent of the AGS CAPTCHAs Shown by Provider panel on the single vService dashboard is not produced; the provider breakdown is not present on the home page. The values in the tab show the device-wide effect of the Multi-Factor Authentication (MFA) and CAPTCHA Providers configurations.
There are three series in the code sending panels:
| Series | Meaning |
|---|---|
| Sent | The one-time codes sent. |
| Resent | The codes resent at the request of the user. |
| Send Errors | The codes that could not be sent. |
There are four series in the code verification panels and in the CAPTCHA panels:
| Series | Meaning |
|---|---|
| Shown | The verification steps shown to the user. |
| Answered | The verification steps answered. |
| Correct | The steps answered correctly. |
| Incorrect | The steps answered incorrectly. |
In the sending panels, as a summary, only Total events comes open; in the verification and CAPTCHA panels all of the Last evt/s, Avg. evt/s, Max. evt/s and Total events columns are listed.
AGS CAPTCHA
Written All vServices above its title, this panel lists the total of the CAPTCHA verifications shown on all the vServices whose AGS is on as four series. The Answered series is produced not from a separate counter but by the correct and incorrect answers being summed. In the panel, the Line Chart, Stat Table and Bar Chart views are offered; there is no numerical view.
The panel is laid out and shows a zero value even if a CAPTCHA provider is not in service on the device. For a single vService, see AGS CAPTCHA.
AGS TOTP
Lists the total of the time-based one-time password verifications as four series. Since TOTP does not have a sending stage, this panel has no sending equivalent. In the panel, the Digital, Line Chart, Stat Table and Bar Chart views are offered; this is the only panel that offers a numerical view in the MFA subtab.
The management of the TOTP records is done per vService; see TOTP. For a single vService, see AGS TOTP.
AGS Email OTP Sending
Shows the total of the one-time codes sent over the e-mail channel as three series. The Send Errors series growing points to a problem in the e-mail sending configuration. In the panel, the Line Chart, Stat Table and Bar Chart views are offered. For a single vService, see AGS Email OTP Sending.
AGS Email OTP Verification
Lists the total of the verifications of the codes sent over the e-mail channel. Its views are the same as AGS Email OTP Sending. For a single vService, see AGS Email OTP Verification.
AGS SMS OTP Sending
Shows the total of the one-time codes sent over the SMS channel. Its series, its summaries and its views are the same as AGS Email OTP Sending. For a single vService, see AGS SMS OTP Sending.
AGS SMS OTP Verification
Lists the total of the verifications of the codes sent over the SMS channel. For a single vService, see AGS SMS OTP Verification.
AGS Custom OTP Sending
Shows the total of the one-time codes sent over the custom channel. For a single vService, see AGS Custom OTP Sending.
AGS Custom OTP Verification
Lists the total of the verifications of the codes sent over the custom channel. For a single vService, see AGS Custom OTP Verification.
AGS OTP Sending (All Channels)
Shows the combined code sending total read from a counter separate from the channel panels. The explanation that appears when the panel title is hovered over states that the total covers the e-mail, SMS and custom channel sendings. Its series, its summaries and its views are the same as the channel sending panels. For a single vService, see AGS OTP Sending (All Channels).
The combined total should not be compared with the sum of the channel panels
The combined panel is produced not by the values of the channel panels being summed in the interface but from a set of counters kept separately. For this reason the combined value and the manual sum of the four channel panels may not match each other; for the exact distinction on a channel basis the channel panels are used.
AGS OTP Verification (All Channels)
Lists the combined code verification total as four series. The panel explanation states that the total covers the e-mail, SMS, custom channel and TOTP verifications. Its columns and its views are the same as the channel verification panels. For a single vService, see AGS OTP Verification (All Channels).
Scope and Limits
INFO
- The tab is displayed only with the Load Balancer permission. All of the twenty-four panels in the three subtabs are bound to the same permission; in a user who does not have the permission the tab does not take place among the view tabs at all.
- Only the vServices whose AGS is on enter the totals. The traffic of a vService whose AGS is not on does not make a contribution to any panel; if there is no vService whose AGS is on on the device, the three subtabs still open, the panels stay empty and the vService Distribution table is displayed without rows. For AGS to be turned on in a vService, see How to Enable AGS?.
- There is no conditional panel in the tab. The MFA panels are laid out and show a zero value even if CAPTCHA, TOTP or channel-based code verification has not been configured at all. The device-wide equivalent of the provider breakdown panels that are created on the single vService dashboard only when their condition is met, on the other hand, is not produced at all.
- The provider breakdown is not present on the home page. The distribution of the authentication attempts to the Authentication Providers profiles and of the CAPTCHAs shown to the CAPTCHA Providers profiles is shown only on the own dashboard of the vService.
- All the panels are summed in a cluster. In all the panels in this tab, the values of the two devices are summed and a single series is shown; for the separate device values, the source selection in the settings is used.
- The data collection interval widens according to the number of vServices. While there are up to 20 active vServices on the device, the totals are calculated once per second; as the number of vServices increases, the interval gradually extends to 20 seconds. The AGS counters are read in every collection round.
- The fine-resolution history gradually coarsens. In the panels in this tab the per-second record goes one minute back, the five-second resolution 24 hours and the per-minute resolution 14 days; the older ranges are kept with a coarsening resolution for up to 10 years.
- The subtab selection is not remembered. At every click on the AGS tab in the upper row, Sessions opens; when another screen is gone to and it is returned to the home page, Summary opens.
- The appearance of an empty panel changes according to the card type. If there is no value in the selected time range,
No datais displayed in the Digital view andNo-datain the Pie Chart and Bar Chart views. - There is no passing to another screen from the cards. By clicking a vService row in the vService Distribution table, it is not passed to the AGS dashboard of that vService; for the session, lockout, TOTP and audit record lists the own tabs of the vService are used over AGS-Enabled vService List.
