
Smarter by Design.Simpler for Business
Global Event Log
What Is Global Event Log?
Global Event Log is the screen that gathers the events of all the Bot/DDoS protected vServices on the device in a single table. Its view and its working logic are the same as Event Logs: the same columns, the same toolbar, the same two-layer filtering and the same four-tab preview are used. Its difference is its scope.
| Event Logs | Global Event Log | |
|---|---|---|
| From where it is opened | From the Bot/DDoS screen of a vService | From the Configuration Menu |
| The traffic covered | Only that vService | All the vServices whose Bot/DDoS protection is enabled |
| The additional column | - | vService |
| The additional filter tab | - | vService |
| The field added to the server filter | - | The vService scope picker |
| The default row limit | 1,000 | 5,000 |
| The upper value of the row limit | 20,000 | 50,000 |
| The reading form | The hourly files of a single vService | A time-sliced scan in the files of all the vServices |
| The access | Change permission in the Load Balancer area | Monitoring permission in the Load Balancer area and an unrestricted vService scope |
The value of the screen is that it shows at a single glance whether an attack targets only a single application or whether it wanders across the device. The traces that the same source address leaves on different vServices come side by side in a single list; how many times a rule or a bot factor has been triggered in all the applications is seen with a single query.
This changes the starting point of an investigation. Instead of going through the log screen of every vService on the device one by one, it is started from a single table; the search can be made even before it is known which application is affected.
A Single Table
The Whole of the Device
The events of all the vServices whose Bot/DDoS protection is on are in a single list
UID
Direct Access with the Identity
The identity of the request is enough; it is found without knowing which vService it is
Cross Monitoring
The Same Actor, Many Services
The trace that an address leaves in all the applications is seen side by side
One Click
Passing to the Service
By clicking the vService name, the Bot/DDoS dashboard of that service is opened
5,000
Default Row Limit
Five times that of the vService screen for a device-wide scan
Sliced
Scan Model
The range is scanned from the newest to the oldest with slices that grow by doubling
Scope Warning
An Incomplete Scan Is Not Hidden
If the scan cannot reach the whole of the range, how far it has come is written above the list
Separate Settings
Its Own View
The column layout, the filters and the selections are stored independently of the vService screen
The whole of the explanation is on the Event Logs page
The columns, the Action values, the Pillar column, the continuity brake, the toolbar, the server filter fields, the filter strip groups and all of the preview tabs are as explained on the Event Logs page. On this screen a column is added to the table, a group to the filter strip, a field to the server filter and a field to the advanced filter; all of them are explained below. The rest of the page deals only with the behavior specific to the device-wide working.
What Is It For?
When there is only a request identity at hand The most frequent use
When a user or an application team applies saying "my request was blocked", most of the time there is only the request identity at hand. When this identity is entered into the Request Unique ID field in the server filter, the record is reached directly without knowing which vService is affected.
Monitoring an actor across the device Investigation
Whether a source address, a network type or a country tries only a single application or wanders in all the services is seen on a single screen with the Client IP, Country and Network Type groups. If the distribution comes out wide, the address is taken into the device-wide blacklist instead of the exemption list of a single vService.
Measuring the real effect of a rule Configuration maintenance
What a configuration that has been left in the monitoring mode will do on all the vServices is read from the Action and Rule groups. Whether a threshold produces a false positive only in a single application or whether it is a device-wide problem is understood from here. Since the numbers in the groups are calculated over the rows fetched, in a search that the row limit cuts they are not the period total but the sample number.
Producing a breakdown after an event Reporting
After an attack wave, a device-wide breakdown is produced with the Triggered Factors, Bot Class and IP Reputation groups and the table is exported as Excel, CSV or PDF. The export contains by default not the page seen but the whole of the filtered and sorted records.
How to Access?
- The Configuration Menu is opened by clicking the TR7 logo at the bottom left.
- The Bot/DDoS → Global Event Log steps are followed.
The screen is not shown to the users that do not have Load Balancer permission. On the users whose permission is limited to certain vServices, on the other hand, it is not displayed in the menu at all and the server side rejects the requests of these users with a scope check. To look at the events of a single vService, the own Event Logs tab of that vService is used.
The permission condition is different from the vService screen
On the Event Logs tab of a single vService, fetching the logs requires change permission in the Load Balancer area. On this screen, on the other hand, monitoring permission is enough; on the other hand the vService scope of the account must be unrestricted. That is, an account that is locked to certain vServices cannot open this screen at all; it can see the logs of its own vServices one by one only if it also has change permission.
The Log Listing Screen
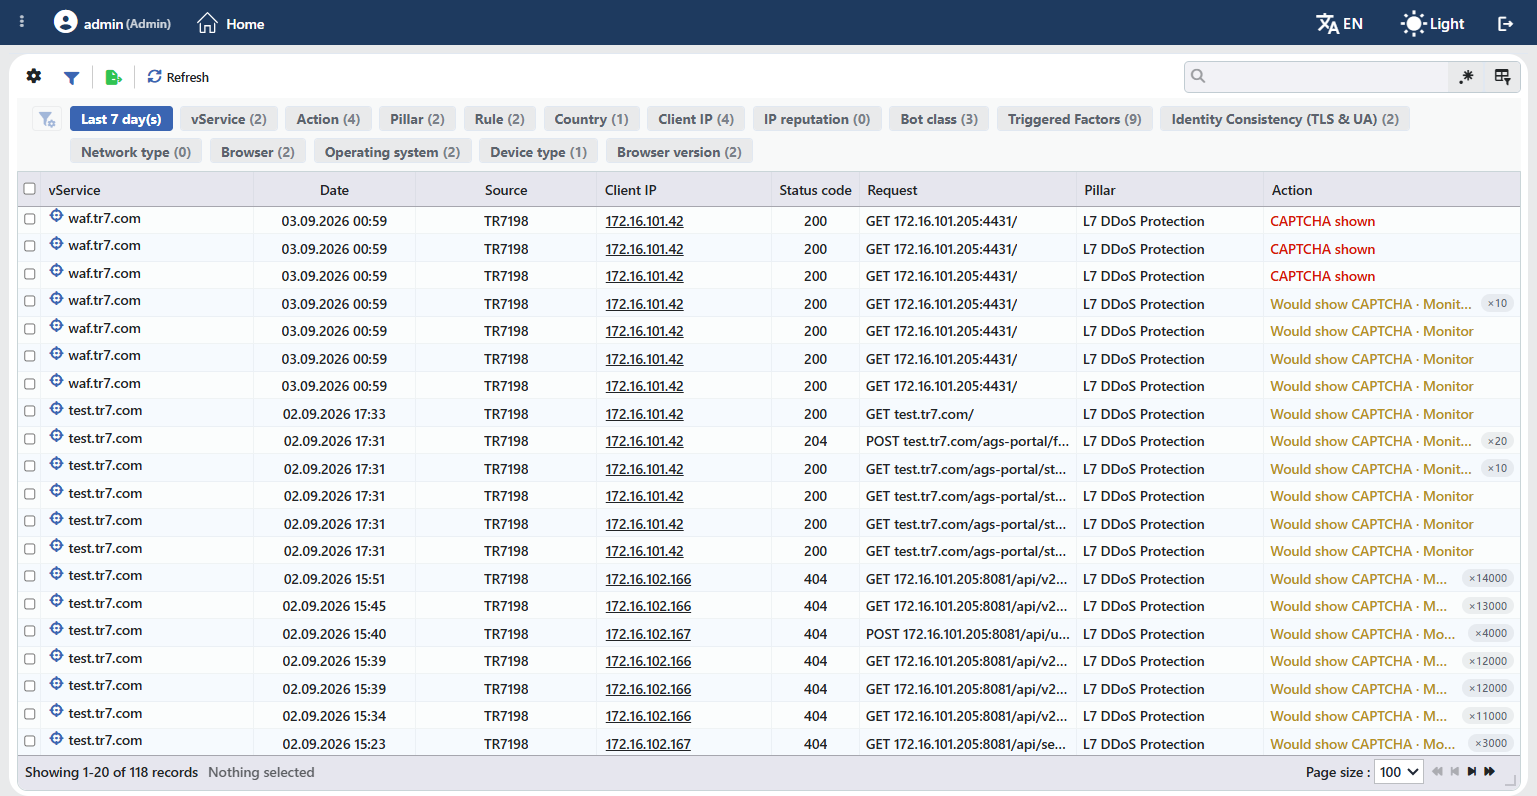 Global Event Log - The Listing Screen
The screen is opened not inside the management screen of a vService but on its own; for this reason there is no tab bar above it that carries the Dashboard, Bot/DDoS Management, Event Logs and Live Stats tabs.
In the table there are three differences from the screen specific to a vService:
- The vService column is added to the beginning of the list. The name in the column is a button: when it is clicked, the preview of the row does not open, and it is passed to the Bot/DDoS Dashboard screen of that vService. The search and the sorting work over the name of the vService.
- The vService tab comes to the beginning of the filter strip, right after the fixed server filter tab. This tab narrows the rows fetched according to the vService and there is a search box inside it.
- The selection boxes are added to the beginning of the rows. While the table cannot be selected at all on the vService screen, here it can be selected; however the selection has no correspondence (the detail is below).
The remaining columns and the preview window are the same as the ones on the vService screen. The strip above the toolbar, on the other hand, is present only on the vService screen: the log source picker and the warnings specific to that screen are not located here.
The checkboxes have no correspondence
At the beginning of the table there are row selection boxes and the number of selected rows is displayed below; on the other hand on this screen there is no bulk operation bound to the selection. The export also exports not the selected rows but the filtered data or the page seen. The selection only makes the counter work.
The row limit in a cluster installation
On the vService screen, after the logs of the two devices have been combined, they are clipped to a fixed upper limit. On this screen, on the other hand, the combined result is clipped to the row limit; therefore the number of rows listed does not exceed the Line Limit value but can go up to that value.
Determining the Scan Scope
The scope is determined from the server filter tab explained on the Event Logs page. On this screen the tab differs at two points:
INFO
Line Limit Default: 5,000
Since many more files are scanned across the device, the default value is higher than the one on the vService screen; the upper limit of the field is also 50,000 on this screen.
On this screen the row limit does not only cut the result, it is the stopping condition of the scan: when the buffer is full, the scan ends. Enlarging the limit means more rounds and more file reading.
INFO
vService Default: All vServices
On which vServices the scan will be made is determined. In the default state all the vServices whose Bot/DDoS protection is enabled are scanned; the list is narrowed by selecting Pick vServices.
This field is different from the vService tab on the filter strip: the tab only filters the rows fetched, and this field narrows the scan itself. When a selection is made, the log files of the other vServices are not opened at all and the whole of the row limit is spent on the selected ones.
While the selection is active, a summary chip that shows how many vServices are selected is displayed on the filter strip; the chip is cleared with a single click.
A field is also added in the advanced filter: the vService field that filters the vService to which the event belongs comes to the Request group. The field offers four operators: equals, does not equal, list membership and list exclusion.
The vService condition in the advanced filter can also narrow the scan, like the picker in the server filter: if the condition has to be valid for every row, the files of the vServices that stay outside are not opened at all. When the condition is set up with "or" or when a request identity is used in the search, this narrowing does not come into play; the result is still correct, only the scan takes longer.
The Working of the Scan
The screen of a single vService reads only the hourly files of that vService. The global screen, on the other hand, spreads the query to all the vServices and, by dividing the time range into slices, proceeds from the newest to the oldest. Every round scans all the vService files of one slice.
The first slice is one hour; at every round the slice width grows by doubling and goes up to at most twenty-four hours. Since the slice is positioned according to the newest file waiting to be scanned, the time ranges in which there is no record are passed in a single round.
When the row limit is full, the scan stops, because at that point it has become certain that the rows in the list are the newest rows across the device.
The scan has a time budget: the interface grants two minutes to every request, and the server uses five seconds less than this (115 seconds) as the budget. When the budget is full, the rounds completed up to that moment enter the result; when the period expires, the rows read of the round that has stayed half-finished are also added to the list. How far it has been reached is reported in addition.
According to the situation, an information strip is displayed above the screen:
| Situation | What is written on the strip | Meaning |
|---|---|---|
| The time budget is full | Results are complete back to <date> — narrow the range to go deeper | The scan could not reach the whole of the range in the period given. The list is complete up to the date written; the older part has not been scanned completely (rows may have come from that range partially). |
| A source error | <number> source(s) could not be scanned fully | The files of some vServices or regions could not be read completely. |
| The writing budget is full | Event logging was rate-capped in <number> hour slice(s) — those hours may be thinner than reality | In those hours the hourly writing budget on the source side has been full; after the ceiling has been reached, no event row belonging to that hour has been written. |
| The scan is busy | Another global scan is running right now — please try again shortly | The number of global scans that can run at the same time is full. |
| A scan error | The global log scan failed — try refreshing | The scan could not be completed. |
A partial result is different from an empty result
When the scope warning is displayed, "not found" and "not scanned" are not the same thing. The record looked for can be in an older slice that the scan could not reach. In such a case the search is deepened by narrowing the time range.
The row limit being full naturally does not produce this warning: in that case the list contains the newest rows of the range completely.
The simultaneous scan limit
At most two global scans can run at the same time. The quota is applied per process that carries out the scan; the busy response is returned only while all the legs are full and the request is not taken into a queue.
This quota is common with the other surfaces that make a device-wide scan: Global WAF Event Log and Global WAF Report also pass through the same gate. For this reason the busy response may not be caused only by this screen being open on another administrator.
Operations
The preview window is the same as the one on the vService screen and works in the context of the vService to which the row belongs:
- The Edit Corresponding Setting pencil opens the setting that sets up the reason of that row on the own vService of the row.
- The identity selected from the exemption menu is also written to the whitelist list of the own vService of the row.
- The What happened sentence in the preview is also produced from the configuration of that vService; two rows that belong to different vServices can write different limits for the same measurement.
- The Actions menu in the Client IP row, on the other hand, offers the device-wide black and white list operations.
Clearing a chip on the filter strip also starts a new scan; on this screen the strip does not only filter the rows fetched, the clearing operation repeats the fetch.
The screen settings are kept separately from the ones on the vService screen: the column layout, the filter strip tabs, the time range, the row limit and the vService scope selection are stored separately per user for this screen. The selections on the filter strip are also stored; for this reason the screen can come with the previous narrowing at the next opening.
Operational Best Practices
- The search must be started with a narrow time range. The scan processes the range with slices from the newest to the oldest and it has a time budget. A wide range leads to the budget being full and the list staying partial.
- The conclusion "there is no record" must not be reached without the scope warning being read. If there is a strip above the list that reports how far the scan has reached, the record looked for can be in a slice that has not been scanned.
- If the affected vService is known, the scan must be narrowed in advance. When a selection is made with the vService field in the server filter, the files of the other services are not opened at all. The vService tab on the strip does not do this job; it only filters the rows fetched.
- The search with the request identity must be made not from the filter strip but from the server filter. The Request Unique ID field runs the search on the server side and reaches the record that carries the identity directly.
- The row limit must not be enlarged unnecessarily. On this screen the limit is also the stopping condition of the scan; enlarging it increases the risk of the time budget being full. To go deeper, not the limit but the time range or the filter must be narrowed.
- The exemption decision must be given by looking at the distribution. If an actor tries a single application, the exemption list of that vService is enough; if it appears on more than one vService, the device-wide white list is more suitable.
- When the writing budget warning is seen, the numbers must not be counted as the total. In those hours the rows have not been written at the source at all; what is missing is not only the repetitions, the repeat information that the rows carry is also missing. For the real volume, Live Stats and Dashboard must be used.
- A refresh response must be expected in the busy hours. Since at most two global scans can run at the same time, while the screen is being used by more than one administrator, the refresh request can receive a busy response.
- This screen must not be used for continuous monitoring. The list does not refresh by itself; for instantaneous tracking the Live Stats screen of the related vService is used.
Scope and Limits
INFO
- The permission. The screen is open to the accounts that have monitoring permission in the Load Balancer area and whose vService scope is not restricted. On an account whose scope is limited, the menu entry is not seen at all; even if the screen is gone to directly, the scan is rejected on the server.
- The screen does not refresh by itself. The list is refreshed only when the screen is opened, with the Refresh button and when the server filter is saved. Saving the server filter while a scan is in progress does not refresh the list immediately: the setting is saved, but the table stays with the old scope. To apply the new scope, Refresh is used after the scan ends.
- The log production depends on the vService settings. This screen reads only the events that have been written. On a vService on which a protection is off, since the rows of that protection are not produced at all, they do not appear here either; the score signal rows also depend on the Event Log Score Floor value of the related vService.
- The logs of the vServices that have stopped are also listed. The scan looks not at a live table but at the files on the disk. For this reason the past events of a vService that is not running at that moment also enter the results.
- The server filter is permanent. The time range, the row limit, the request identity, the advanced filter and the vService scope selection are stored per user. At the next opening the screen automatically runs a query with this scope.
- The storage period. The event files are kept per vService and per hour and are preserved up to the storage limits in the Disk Management settings. This screen does not have its own storage setting.
