
Smarter by Design.Simpler for Business
Report
What Is Report?
Report is the report screen that gathers the traffic of a vService in the selected period into a single document. While Dashboard shows metrics as time series and Logs & Tracking shows individual requests, the report summarizes an entire period: how many requests came, where visitors connected from, which pages were requested, which response codes were produced and how the load was distributed among the Backend Services.
The report is produced in three formats. The html report opens interactively on the screen and is for examination; pdf produces a document with a cover and a table of contents to be presented to management; xlsx, on the other hand, writes each breakdown to a separate sheet and makes the data processable with other tools.
The real value of the screen is that it turns the raw data on the monitoring screens into a document that management can read. The answer to questions such as "how many requests came to this service last month, which countries did visitors connect from, which pages were requested the most, what was the error rate" is given with a single document, without collecting screenshots and without merging tables manually. With its cover carrying the organization logo, the PDF output enters audit and reporting processes as is.
The report is not configured separately: from the moment a Reports profile is assigned to an HTTP vService, the traffic engine starts keeping the report record, and the breakdowns in the document are produced from this record.
3
Output formats
html on screen, pdf for management, xlsx for data
8
HTML views
Overview, Traffic, Pages, Client, Visitors, Backend, TLS & Content, Activity; if a custom table is defined, a ninth view is added
Instant
No queue
The report is produced together with the request; there is no waiting for it to be ready
31
Report breakdowns
Country, page, response code, browser, Backend Service and TLS breakdowns can be selected individually
With Cover
Corporate PDF
Organization logo, table of contents and sections per breakdown
Cluster
Single document
The records of the two devices are combined to produce a single report
Profile
Requires a report profile
The tab is displayed only if a Reports profile is assigned to the vService
E-mail
Direct sending
pdf and xlsx outputs can be sent directly by e-mail instead of being downloaded
Reports are not stored on the device
The generated report is not archived, and no list of past reports is kept. The HTML report lives only while the tab is open; when another tab is selected or the page is refreshed, the screen returns to the empty initial state and the report must be generated again. PDF and XLSX outputs are downloaded to the browser.
If a report sent by e-mail at regular intervals is desired, the e-mail report settings in the Reports profile are used.
Reporting is part of the product's load balancing capabilities: basic L7 reporting comes with the ADC license; the L7 Reporting add-on extends reporting to more vServices.
With the ADC License
Basic Reporting Included
Basic L7 reporting comes with the ADC license; the L7 Reporting add-on extends reporting to more vServices
No Additional Permission
Monitoring permission is sufficient
The screen is bound to the same monitoring permission as the rest of the vService management screen; no report-specific permission is defined, and a user with only monitoring permission can also generate reports
No Quota
No count limit
There is no limit, daily allowance or queuing on how many reports are generated; since reports are not stored, nothing accumulates on the device
No Time Limit
The range is freely selected
Preset ranges are offered up to three months; a custom duration in hours, days, weeks, months and years or an absolute date range can also be entered
The only real limit is the age of the record
A report can be produced retroactively only as far back as the report record extends. The record is opened the moment a Reports profile is assigned to the vService; a report requested for the period before this date comes back empty. The record itself is not automatically shortened by a retention period and cannot be deleted from the file management screen either.
How to Access?
- Left Monitor Panel is opened.
- Load Balancer vServices is selected from the category tabs at the top left.
- The vServices defined on TR7 are listed.
- The vService to be monitored is clicked; the screen opens with the Dashboard tab that carries the vService's name.
- On the screen that opens, the Report tab is clicked.
Whether the tab is present depends on the vService's configuration:
| Situation | Behavior |
|---|---|
| At least one Reports profile is assigned to an HTTP or L7 TCP vService | There is a permanent Report tab in the tab bar that cannot be closed. In an HTTP vService, the report is produced with all its breakdowns; in an L7 TCP vService, the breakdowns come back empty (details in the warning below). |
| A Reports profile is assigned to an L7 TCP vService | The tab is still displayed and the report is produced; however, since no report record is kept at all in this type, the document consists only of time series graphs, and the breakdown tables stay empty. |
| Network vService | Although the report profile selector is listed in the form, the profile is not saved in this type; the Report tab is not displayed under any condition. |
| No Reports profile assigned at all | The tab is not displayed. No report can be produced for this vService; reporting starts with the assignment of the profile. |
The For Detailed Analysis shortcut that opens the report on the WAF dashboard has no equivalent on this dashboard; the only entry to the report is the Report tab.
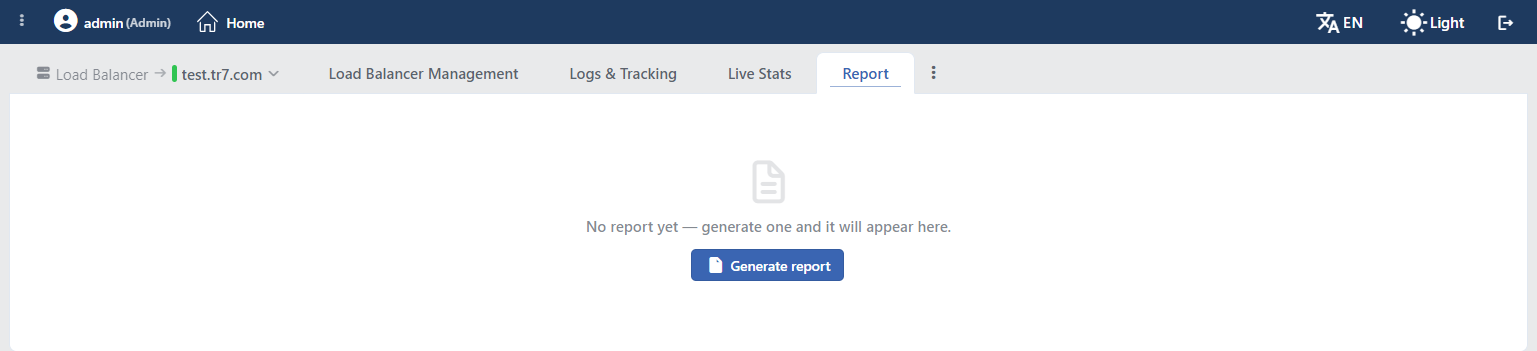 Report Tab
When the tab is opened for the first time, there is no report yet; a document icon, below it the notice No report yet — generate one and it will appear here. and the Generate report button are displayed in the middle of the screen.
If e-mail sending is defined in at least one of the vService's Reports profiles, there is a second menu next to the button. The Resend Daily reports, Resend Weekly reports, Resend Monthly reports and Resend Annual reports entries in the menu resend that period's e-mail report to the addresses in the profile. An entry is listed only if that frequency is defined in one of the vService's report profiles.
Generate Report Screen
When the Generate report button is clicked, the form titled vService report opens.
On first opening, the form comes filled with the values of the main Reports profile assigned to the vService; whatever breakdowns, graph selections and row limits the profile carries, the form opens with them. The Report Type, Report Language, PDF Graphs and Send as E-mail fields are outside this inheritance and always come with their own initial values. The HTML Max. Table Rows field has no counterpart in the Reports profile; it too always opens with 100.
When confirmed, the selections made in the form are stored per user, and in later openings these selections come instead of the profile values. Storage is not per vService but per user: a selection made in one vService affects the form of all vService reports opened by the same user. For this reason, the defaults in the field boxes apply only to the first opening.
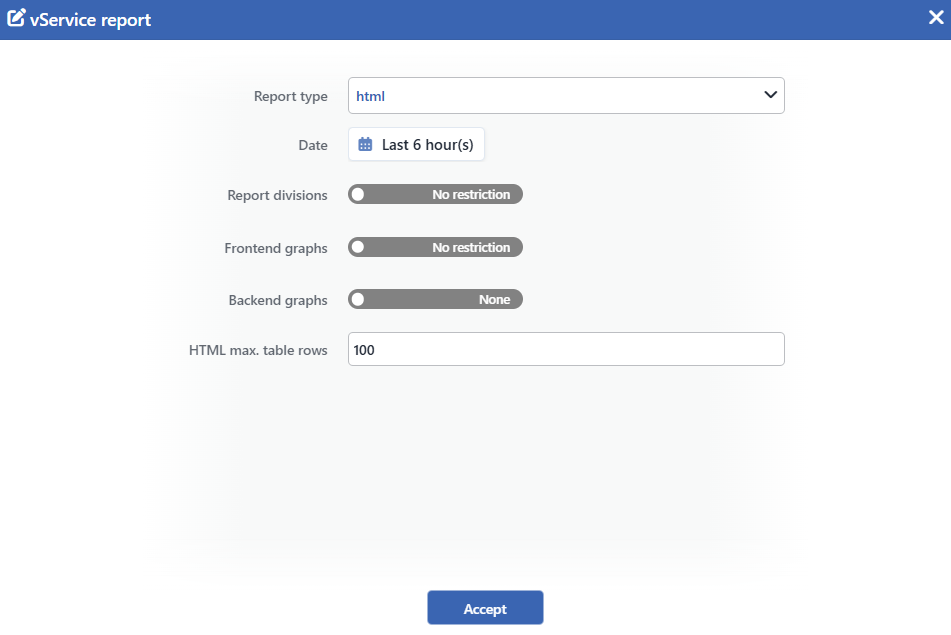 Generate Report Form
INFO
Report Type Default: html
The format of the report is selected: html, xlsx or pdf.
When html is selected, the report is displayed interactively inside the tab. With the pdf and xlsx selections, the report is produced as a file and downloaded to the browser.
The selection also determines the rest of the form: of the row limit fields, only the one belonging to the selected format is displayed; PDF Graphs is added only with the pdf selection, and Report Language and Send as E-mail only with the xlsx and pdf selections.
INFO
Date Default: 6 hours
The time range the report will cover is selected. Preset ranges are offered from one hour to three months: 1 hour, 12 hours, 1 day, 3 days, 1 week, 2 weeks, 1 month and 3 months. In addition, a custom duration in hours, days, weeks, months and years or an absolute date range can be entered.
INFO
Report Language Only xlsx and pdf
The language of the report is selected. The field is displayed only when xlsx or pdf is selected as the Report Type; since the html report always uses the interface language, it is not shown for that type.
When Default is selected, the report is produced in the interface language of the user making the request.
INFO
Report Divisions Default: No Restriction
Which breakdowns the report will include is determined. While the switch at the beginning of the field is off, No Restriction is written on it and the report carries all breakdowns; when the switch is turned on, the text becomes Select and the list comes with all breakdowns checked.
| Breakdown | Content |
|---|---|
| Day by Day | Request and visitor counts day by day. |
| Hour by Hour | Request and visitor counts hour by hour. |
| Country | The distribution of requests across source countries. |
| Host | The requested domain names. |
| Pages | The requested paths. |
| 404 Pages | The paths that produced a 404 response. |
| Referer | The addresses that referred the request. |
| Backend Service | The Backend Services the request was forwarded to. |
| Response from | Who produced the response: the name of the responding Backend Service, or TR7 for the device itself. |
| IP | Client addresses. |
| IP Provider | The network providers that client addresses belong to. |
| Operating System | Client operating systems. |
| Browser | Client browsers. |
| Status Code | Response codes. |
| Method | HTTP methods. |
| HTTP Version | The HTTP versions of requests. |
| Request Content Type | The content types of request bodies. |
| Response Content Type | The content types of response bodies. |
| Request SSL | The TLS version and cipher suite of the client connection, counted over request records. |
| Response SSL | The same client connection information, counted over response records. |
| User Agent | Client identification strings. |
| City | The source cities of requests. |
| Continent | The source continents of requests. |
| Hour | The distribution of requests across the 0-23 hour slots of the day. |
| Static Pages | Static content requests. |
| 1xx Pages | The paths that produced a 1xx response. |
| 2xx Pages | The paths that produced a 2xx response. |
| 3xx Pages | The paths that produced a 3xx response. |
| 4xx Pages(except 404) | The paths that produced a 4xx response other than 404. |
| 5xx Pages | The paths that produced a 5xx response. |
| Frontend IP & Port | The frontend address and port pairs on which the request was received. |
If a custom table is defined in the Reports profile, these tables are also added to the end of the list with their own titles and can be selected individually.
INFO
Frontend Graphs Default: No Restriction
Which time series graphs the report will carry on the frontend side is determined. While the switch is off, No Restriction is written on it and all frontend graphs enter the report; when it is turned on, it becomes Select and the list comes with all options checked.
| Graph | Content |
|---|---|
| Requests per Second | The number of requests per second. |
| Connection | The connection rate. |
| TCP Sessions | The number of concurrent sessions. |
| RX Bandwidth | The incoming data rate. |
| TX Bandwidth | The outgoing data rate. |
| Backend Service Response Time | The response time. In this version, it brings no series to the report even if selected. |
INFO
Backend Graphs Default: None
Which time series graphs the report will carry on the Backend Service side is determined. This field works differently from the other two switches: while it is off, None is written on it and no Backend Service graph enters the report. When the switch is turned on, the list comes with all options checked; unwanted ones are removed one by one.
| Graph | Content |
|---|---|
| Connection | The Backend Service connection rate. In this version, it brings no series to the report even if selected. |
| TCP Sessions | The number of concurrent sessions on the Backend Service. |
| Backend Requests | The number of requests forwarded to the Backend Service. |
| Backend Service Response Time | The response time of the Backend Service. In this version, it brings no series to the report even if selected. |
| Health Check Result | The health check result. |
| Health Check Time | The duration of the health check. |
Graphs are drawn separately for each Backend Service; in a vService carrying many Backend Services, selecting all graphs noticeably lengthens the document. This is why the default is None.
INFO
HTML Max. Table Rows Default: 100
At most how many values each breakdown in the HTML report will carry is determined. The field is displayed only when html is selected as the Report Type.
At least 5 can be entered, and the field opens filled with the value 100. If the content of the field is deleted and left empty, no breakdown values are calculated and the report is produced empty except for Overview; for this reason, the field must always contain a value.
INFO
XLSX Max. Table Rows
At most how many rows each sheet in the XLSX output will carry is determined. The value also limits how many values are calculated per breakdown. The field is displayed only when xlsx is selected as the Report Type.
At least 5 can be entered. When the field is left empty, 200 values are calculated per breakdown and all of them are written to the sheet.
INFO
PDF Graphs Default: Hit and Visitor
The measure according to which each breakdown in the PDF document will be drawn is determined. The field is displayed only when pdf is selected as the Report Type.
| Option | Meaning |
|---|---|
| Hit | Breakdowns are drawn according to the number of requests. |
| Visitor | Breakdowns are drawn according to the number of visitors. |
The two options can be checked together; in this case, two separate graphs are printed for each breakdown. On the first opening of the form, both come checked. If both are removed, no graph is printed in the document, and the world map in the summary section is not created either.
In PDF graphs, at most nine values are drawn regardless of the graph type.
INFO
PDF Max. Table Rows
At most how many rows each table in the PDF document will carry is determined. The value also limits how many values are calculated per breakdown. The field is displayed only when pdf is selected as the Report Type.
At least 5 can be entered, and the field opens filled with the value in the Reports profile assigned to the vService. If the content of the field is deleted and left empty, no table is printed in the PDF document; the document consists only of the cover, the summary and the graphs. In this case, the value in the profile is not used as a fallback.
INFO
Send as E-mail Only xlsx and pdf
The addresses to which the report will be sent by e-mail are entered. The field is displayed only when xlsx or pdf is selected as the Report Type; when the switch is turned on, address rows are added.
When an address is entered, the document is not downloaded to the browser: the produced file is attached to the e-mail and sent, and an alert reporting that the sending was successful is displayed on the screen.
INFO
Accept
Report generation is started by clicking the Accept button. The form closes with this click; generation continues not in the background but in the same request. The wait is shown by the Generate report button: during generation, it turns into a spinning icon and stays inactive.
Report Generation
The report is produced at the same time as the request: it is not placed in a background job queue, and there is no waiting for it to be ready. During generation, the Generate report button stays inactive and shows a spinning icon.
The waiting time of the request varies by format: the interface waits five minutes for the HTML report and thirty minutes for PDF and XLSX.
In cluster setups, the records of both members are combined to produce a single report. If the peer device cannot be reached, the report is produced only with the data of the local device, and this situation is not stated separately in the document.
PDF and XLSX outputs are downloaded to the browser, named with the REPORT_<vService name>_<start> - <end>.pdf and .xlsx pattern; the dates are written in the DD.MM.YYYY_HH.mm format.
Source of the data
The breakdowns of the report are produced from a separate record that the traffic engine keeps only for reporting. This record is opened when a Reports profile is assigned to an HTTP vService; breakdowns for the period before the profile was assigned cannot be produced. The record is independent of the HTTP log on the Logs & Tracking screen: the report record is kept even if no log profile is defined.
Reading is done per hour file: if a pre-prepared summary exists for an hour, it is read; otherwise, the raw record of the hour is scanned; compressed old hours are also opened in the same flow.
Hourly summaries are prepared in advance not while the report is being produced but by a separate maintenance job that runs every hour: a summary is written for every hour older than two hours, and the raw record is deleted at this stage. For this reason, raw scanning is done only for the last hours, and producing the same report a second time does not shorten the duration.
In the hours read raw, the incomplete hours at the beginning and end of the time range are scanned by filtering out the records outside the range; the complete hours in between are added as is.
Breakdowns are produced only in an HTTP vService
The component that writes the report record runs only in the traffic engine of HTTP vServices. In L7 TCP vServices, a Reports profile can be assigned and the Report tab is displayed; however, since the record is never created, all breakdowns such as country, page and response code come back empty, and only the Activity view opens in the HTML report.
The only data the report carries in L7 TCP is the Frontend Graphs and Backend Graphs time series selected in the form; these graphs are read not from the breakdown record but from the Dashboard archive.
In Network vServices, the report profile is not saved; in this type, the Report tab does not open and no report is produced.
HTML Report
The HTML report is presented inside the tab with view tabs. Eight views is an upper limit; which ones open depends on the data in the period.
Overview is always displayed; if there is no data, its indicators come with empty values. The six views in between (Traffic, Pages, Client, Visitors, Backend, TLS & Content) open only if at least one of the breakdowns in them carries data in the period. Activity, on the other hand, depends not on breakdowns but on whether the hourly or daily time series or the selected frontend/backend graphs carry data.
| View | Content |
|---|---|
| Overview | The card strip carrying the report range and the summary indicators (Total Hits, Total Visitors, Total Unique Visitors if any, Success (2xx), Errors (4xx/5xx), Top Country if any), together with the country map and the response code and method distributions. |
| Traffic | HTTP version, requested paths, distribution by hour of the day and referring addresses. The hour distribution is not a timeline; it shows the 0-23 hour slots and is presented only as a graph. |
| Pages | Page lists separated by response class: 2xx, 3xx, 4xx, 5xx, 404 and static content. |
| Client | Browser, operating system, continent, city and network provider breakdowns. |
| Visitors | Client identification strings and client addresses. |
| Backend | Backend Service, response source and requested domain name breakdowns. |
| TLS & Content | TLS information on the request and response sides, content types and frontend address/port pairs. |
| Activity | The time series of request and visitor counts, together with the Frontend Graphs and Backend Graphs graphs selected in the form. |
If a custom table is defined in any of the Reports profiles bound to the vService and the table carries data in the period, an additional view named Custom is created for them and placed right before the Activity view.
Each breakdown is presented in its own section; most sections come with a graph and a table. Next to the section heading, the number of distinct values the breakdown carries and its total are written.
Only the highest values are drawn in graphs: up to nine values in pie charts and up to fourteen in bar charts. Those outside this limit and the values whose share is 2% or less are summed in a single Others item; this item is drawn in addition to the limit. The table is not limited by the graph and lists all calculated values of the breakdown.
Tables start with the #, Hits and Visitors columns; if the breakdown carries identity data, a Unique column is also added after these. These are followed by the breakdown's own columns. In the HTML report, the row number is written in the #001 format.
Path, referring address, client identification string, client address and all page lists in the Pages view are presented only as tables, without drawing graphs. The distribution by hour of the day, conversely, is given only as a graph. The country breakdown comes with a world map next to its table.
PDF and XLSX Outputs
INFO
PDF
The document consists of the following sections:
- Cover: the organization logo in the Localization settings, the report title, the vService name and the report range.
- Table of Contents
- Summary: the country map, the total indicator boxes (Total Hits, Total Visitors, Total Unique Visitors if any) and one top table each per request and per visitor. These tables show together the top-ranked values of the country, client address, domain name, browser, operating system, path and 404 path breakdowns. The entire section is not added to the document if there is no data at all in the period.
- Frontend Graphs and Backend Graphs: the time series graphs selected in the form.
- Breakdown sections: a graph and a table for each selected breakdown. In graphs, values whose share stays below 2% are summed in a single Others item.
INFO
XLSX
Each breakdown is written to a separate sheet, and the sheet carries the breakdown's own name. Next to the breakdown sheets, there is one more sheet each for the day-by-day and hour-by-hour distributions; these two sheets carry no row number column and are not affected by the row limit.
The column layout is the same as in the HTML report; the only difference is that the row number is written as a plain number instead of #001. The XLSX output does not contain a cover, logo or summary sheet.
Scope and Limits
INFO
- The report scope is a single vService. This screen reports only the data of the open vService. There is no version that gathers all vServices on the device into a single document; the Global WAF Report screen on the WAF side has no load balancing equivalent.
- Relationship with scheduled reports. The e-mail report in the Reports profile is produced from the same template, but it does not use the format and breakdown selections made on this screen; it is produced with the profile's own settings. The report language also comes from the language setting in the profile; if the field is empty, the device's default interface language is used. The
Resendoperation performed from the menu on this screen also works with the profile's settings. - The report does not stay in the tab. The Report tab is permanent and cannot be closed; however, the report it produces is bound to the tab. When another tab is selected, the report drops from memory, and when returning to the tab, the screen opens again in the empty initial state. When the same report is needed again, it is generated again.
- There is no report filter. A condition filter that isolates a specific source or path, as in the WAF report, does not exist on this screen. The report is narrowed only by the time range and the breakdown selection; the trace of a single request is followed through Logs & Tracking.
