
Smarter by Design.Simpler for Business
L7 DDoS & Threat Protection
What Is L7 DDoS & Threat Protection?
L7 DDoS & Threat Protection is the view tab that gathers the application layer threat picture of all the vServices on the device on a single screen on the TR7 home page. The tab consists of fourteen panels: the threat state table per vService, the distribution and the classes of the bot score, the detection factors that produce the score, the outcome distributions that show how the protections conclude the requests, the DDoS trigger breakdown and bandwidth limiting, the matching IP reputation categories, the challenge lifecycle and who fills the penalty box.
Thirteen of the panels are the device-wide equivalent of the panels on the Dashboard screen of a single vService. Above the title of these panels, All vServices is written and the value is the total of all the vServices that produce data. The first panel of the tab, DDoS & Threat State, on the other hand, is a table that has vService Distribution written above its title: it lists the same metric as one row per vService and is found only on the home page.
The scope of the tab is the HTTP and L7 TCP vServices; since the protection can be turned on only on these two types, the traffic of the Network (Layer 4) vServices does not contribute to any panel. The packet level protection in the route tables works on a separate data plane and is not represented on any tab of the home page. For the tab to be displayed, a protected vService being present on the device is not required; if the protection is not used at all, the tab opens but the panels stay empty.
14
Panels
The tab does not have a subtab; only the first of the panels is bound to a condition
Load Balancer
Required Permission
The tab and all fourteen panels are bound to the same permission area
HTTP · L7 TCP
Total Scope
The Network (Layer 4) vServices do not enter any panel
Per vService
State Table
DDoS & Threat State is listed in a separate row for every vService whose protection is on
Access to the L7 DDoS & Threat Protection Tab
- The Home shortcut on the left of the Header Bar is clicked.
- L7 DDoS & Threat Protection is selected from the view tabs.
The tab does not have a subtab, so the second row of the tab bar is not displayed. For the Header Bar shortcuts, see Header Bar.
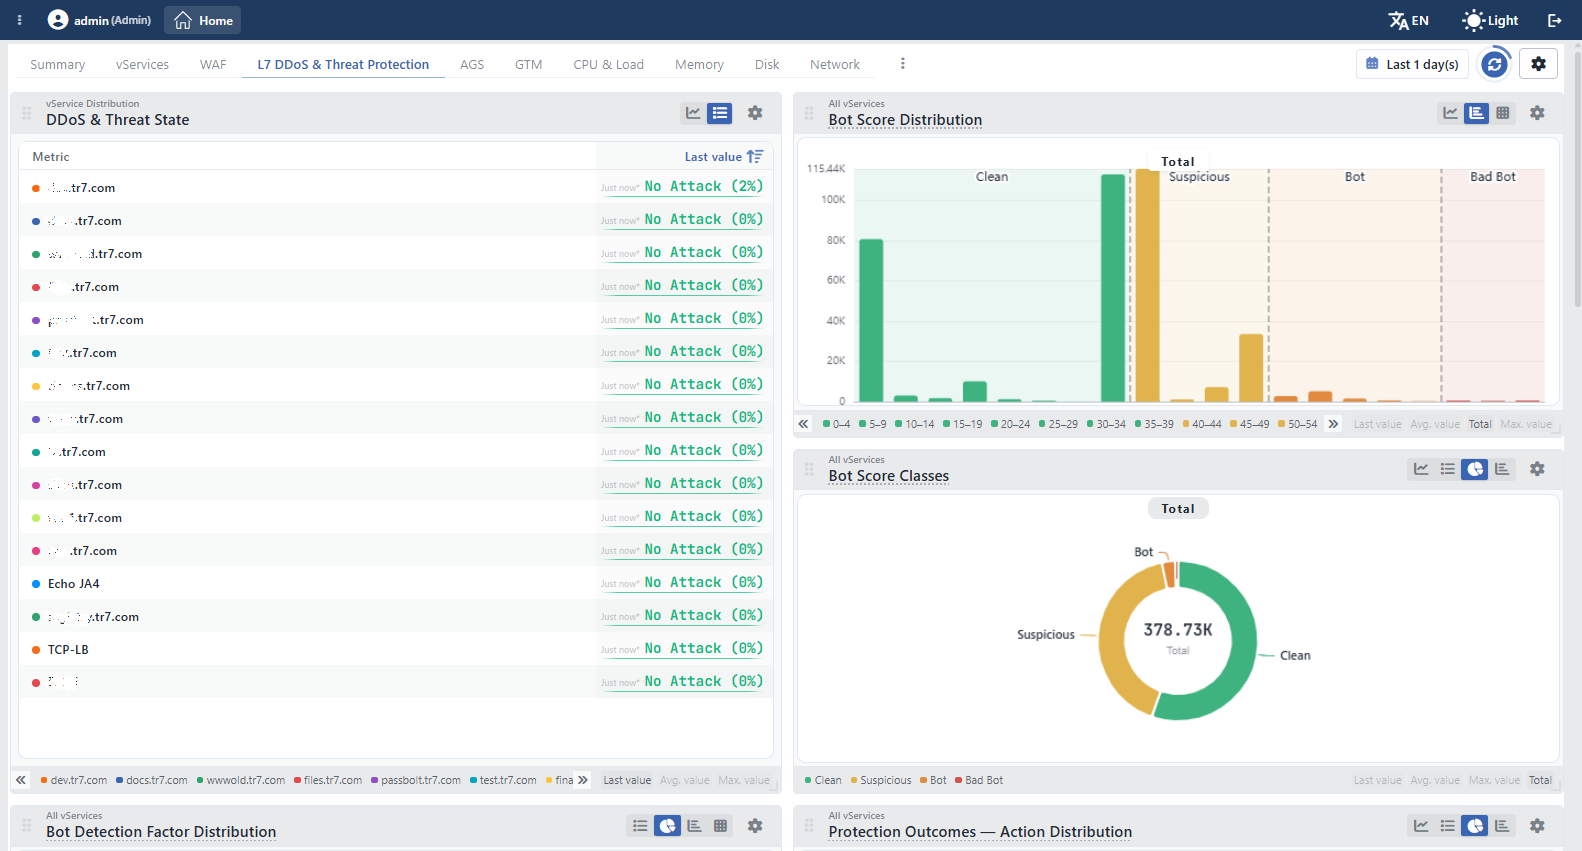 The L7 DDoS & Threat Protection Tab
The screen controls are common to all the tabs
The time range selector, the refresh, the settings, the template menu and the arrangement of the panels are the same in all the view tabs of the home page; for the detail, see Screen Controls.
Panels
There are 14 panels in the L7 DDoS & Threat Protection tab. The tab and all the panels are bound to the Load Balancer permission; in a user who does not have this permission, including the users who have only the WAF permission, the tab does not take place among the view tabs at all.
The only conditional panel in the tab is the DDoS & Threat State table: without the threat state band definitions coming from the device, the panel is not created at all and the tab opens with thirteen panels. The other thirteen panels are laid out regardless of whether there is a protected vService on the device.
The DDoS & Threat State table has been placed at the beginning of the tab and grows up to two cards high as the content lengthens; the other panels are one card in size. The card width changes according to the screen width: as many columns as the number of cards that fit side by side are opened and the cards fill the column.
The Add Visualization menu offers the same fourteen panels on this tab; there is no other threat panel that can be added to the tab. A panel selected from the menu can be added a second time even if it is already present in the layout.
Some of the panels on the single vService dashboard are not found on the home page: the single-valued DDoS & Threat State indicator, Threat Pressure Breakdown, the six DDoS limit comparison panels, the two Waiting Room panels and Protection Modes. These panels read the observed value according to that vService's own limit, capacity or mode; since a limit or a capacity gathered across the vServices does not carry a meaning, their total equivalents are not produced at all. For all of these, the vService's own Dashboard screen is used.
DDoS & Threat State
Written vService Distribution above its title, this table lists every vService whose L7 DDoS & Threat Protection is on in a separate row; the row name is the name of the vService. The vServices whose protection has not been turned on do not take place in the table. The value is the combined threat state of that vService between 0 and 1 and is written together with the name of the band it belongs to in the form No Attack (2%); the value takes the color of its band.
In the table only the Last value column comes open and the table opens sorted from the largest to the smallest according to this column; Avg. value and Max. value are opened from the strip under the panel. Since the threat state is an instantaneous reading, the average and the highest value are closed by default.
| Band | Value range | Meaning |
|---|---|---|
| No Attack | 0 – 0.2 | There is no notable pressure on the measured axes. |
| Low Activity | 0.2 – 0.4 | There is activity; this is not a finding but a reading. |
| Possible Attack | 0.4 – 0.6 | The pressure is approaching the attack limit. |
| Attack Detected | 0.6 – 0.8 | More than one axis has risen at the same time. |
| Active Attack | 0.8 – 1 | An ongoing attack. |
In the panel, the Stat Table and Line Chart views are offered; in the line view every vService is a separate series and the band limits are shown as horizontal reference lines, each of which carries the name and the color of the band it belongs to. When the title is hovered over, an explanation tooltip does not appear. In cluster setups, for every vService the values of the two devices are not summed, the larger one is taken. For how the value is calculated and the meaning of the bands, see DDoS & Threat State.
The panel is displayed only after the band definitions come from the device
The band names, their limits and their colors are read from the definition set coming from the device; a backup copy is not kept in the interface. If the definition set has not been transferred yet, the panel is not created at all and the tab opens with thirteen panels. After the device restarts, the threat state values are not written until the second slow collection round is completed.
Bot Score Distribution
Written All vServices above its title, this panel shows the distribution of the bot scores given to the requests on all the HTTP and L7 TCP vServices. The score is between 0 and 100 and is divided into 20 buckets of five points each (the last bucket covers between 95 and 100): 0–4, 5–9, 10–14 … 90–94, 95–100. The buckets take the color of the class they belong to; in the bar view the bucket range that every class covers is named in a separate row above the chart.
| Class | Score range | Meaning |
|---|---|---|
| Clean | 0 – 39 | There is no sign of automation. |
| Suspicious | 40 – 59 | There is suspicious behavior but it is not certain. |
| Bot | 60 – 84 | Most probably an automatic client. |
| Bad Bot | 85 – 100 | Malicious automation. |
As a summary, only Total comes open; Last value, Avg. value and Max. value are opened from the strip under the panel. The buckets are not folded or reordered in any view; the order itself is meaningful. In the panel, the Bar Chart, Line Chart and Heatmap views are offered. For the information read from the shape of the distribution, see Bot Score Distribution.
Bot Score Classes
Shows the distribution of the same requests into the four bot score classes: Clean, Suspicious, Bot and Bad Bot. The classification is made on the device, while the data is being collected; the interface does not recalculate the score buckets. In the middle of the pie, the total of the period is written with the Total label and the slice percentages are shown.
As a summary, only Total comes open. The series are always listed in the class order, they are not sorted according to the value. In the panel, the Pie Chart, Line Chart, Stat Table and Bar Chart views are offered. For a single vService, see Bot Score Classes.
Bot Detection Factor Distribution
Shows which detection factor is triggered how often, that is, what produces the bot scores. The series are at the leaf factor level and are labeled in the form sub factor (parent factor); the colors are given according to the parent factor. The panel carries 46 factor series and opens sorted from the largest to the smallest according to the Total value; the factors that have never been triggered remain at the end of the list.
As a summary, only Total comes open. In the panel, the Pie Chart, Stat Table, Bar Chart and Heatmap views are offered; in the heatmap only the 15 most intense factors are listed and the series that do not produce any value are hidden. For the full list of the factors and their weights, see Bot Protection.
The factor list does not narrow according to the vService type
On the single vService dashboard, on the L7 TCP vServices the factors that cannot be triggered on that protocol drop from the list. In the total on the home page such an elimination is not made: even if there is only an L7 TCP vService on the device, all 46 factors take place as a series and the ones bound to HTTP remain at zero value.
Protection Outcomes — Action Distribution
Shows how every request has concluded when all the protections are evaluated together. The panel is a combined view: the decision of the winning protection is counted only once per request, therefore the total of the series is equal to the volume of traffic evaluated.
| Series | Meaning |
|---|---|
| Clean | It passed without any intervention. |
| Whitelisted | It passed because it is explicitly on the trusted list. |
| Trusted Bot | It was recognized as a verified good bot. |
| Silent Drop | It was dropped without a response being given. |
| Blocked | It was blocked. |
| Tarpit | It was slowed down and kept waiting. |
| Redirected | It was redirected to another address. |
| Show Content | Alternative content was shown. |
| CAPTCHA | The challenge was shown. |
| Quarantined | It was taken into the penalty box. |
| Monitored | In the monitor mode an intervention was going to be made; the request was let through. |
As a summary, only Total comes open; the series are sorted from the largest to the smallest according to the Total value. In the panel, the Pie Chart, Line Chart, Stat Table and Bar Chart views are offered. Since bandwidth limiting does not conclude the request, it is not a part of this distribution; it is shown on a separate panel. For the detail, see Protection Outcomes — Action Distribution.
The series do not narrow according to the vService type on the home page
On the single vService dashboard, the outcomes that can never be produced on that vService's protocol are dropped from the list: on an L7 TCP vService, Blocked, Tarpit, Redirected, Show Content and CAPTCHA do not appear. In the total on the home page this elimination is not made; all eleven series are always listed and the series whose equivalent is not produced on the device remain at zero value.
Bot Protection Outcomes
Shows the distribution of the decisions made only by Bot Protection. The series are the same as the ones in the Protection Outcomes — Action Distribution table; since the bot protection can produce all eleven outcomes, eleven series are listed on this panel as well. While on the combined panel the decision of a request is written to the winning protection, on this panel it is looked at only from the bot lens; a request can appear in more than one lens, for this reason the lens panels are not summed with each other.
On this panel, as a summary, Avg. value and Total come open together; on the other three outcome panels in the same family only Total comes open. In the panel, the Pie Chart, Line Chart, Stat Table and Bar Chart views are offered. For a single vService, see Bot Protection Outcomes.
IP Reputation Outcomes
Shows the distribution of the decisions made only by IP Reputation Protection. The panel carries ten series: of the outcomes in the Protection Outcomes — Action Distribution table, Trusted Bot is not found on this panel, because in the reputation protection an escape path is not defined for a verified bot.
The summary, the sorting and the views are the same as the Protection Outcomes — Action Distribution panel. For a single vService, see IP Reputation Outcomes.
DDoS Protection Outcomes
Shows the distribution of the decisions made only by L7 DDoS Protection; the panel lists all eleven series. The summary, the sorting and the views are the same as the Protection Outcomes — Action Distribution panel. Bandwidth limiting does not take place on this panel either; for the separate panel, see DDoS Bandwidth Limiting. For a single vService, see DDoS Protection Outcomes.
DDoS Bandwidth Limiting
Shows the total of the requests limited by the bandwidth rule as a single series: Bandwidth limited. These requests are not blocked, they continue on their way; for this reason it is not a slice of the outcome distribution but a separate overlapping layer. The bandwidth limiting action can be defined only in the country and network type rules.
In the panel, all four summary columns come open: Last value, Avg. value, Total and Max. value. As a view, Stat Table, Line Chart, Bar Chart and Mini Chart are offered; since it carries a single series, the small card view also takes place in the list. For a single vService, see DDoS Bandwidth Limiting.
DDoS Trigger Attribution
Shows by which sub-protection the DDoS decision was made. For every blocking only the winning trigger is counted.
| Series | Its equivalent |
|---|---|
| Source IP request rate | The request rate protection per source address. |
| Source IP connection rate | The connection rate protection per source address. |
| Source IP error rate | The error rate protection per source address. |
| Total request rate | The total request rate protection across the vService. |
| Total connection rate | The total connection rate protection across the vService. |
| Active source count | The active source address count protection. |
| Country rules | The country rules. |
| Network type rules | The network type group rules. |
| Hard ceiling (requests) | The total request hard ceiling. |
| Hard ceiling (connections) | The total connection hard ceiling. |
The country and network type rules are gathered in a single row; for the breakdown on a rule basis, the Event Logs screen is used. All four summary columns come open and the table opens sorted from the largest to the smallest according to the Total value. In the panel, the Stat Table, Line Chart, Pie Chart and Bar Chart views are offered. For the definition of the blocks, see L7 DDoS Protection.
IP Reputation — Detected Category Distribution
Shows the distribution of the matching IP reputation categories. For a request the first matching category is counted, therefore every request falls into a single category and the total of the series is equal to the number of matching requests.
The categories consist of twenty-five headings, including the operator's own list and the external feed: User blacklist, External, DNS Compromise, DNS Poisoning, Fraud Orders, DDoS Attack, FTP Brute-Force, Ping of Death, Phishing, Fraud VoIP, Open Proxy, Web Spam, Email Spam, Blog Spam, VPN IP, Port Scan, Hacking, SQL Injection, Spoofing, Brute-Force, Bad Web Bot, Exploited Host, Web App Attack, SSH and IoT Targeted.
The rows of the heatmap are the categories and its columns are the time slices; the cell color carries the intensity in that slice. In this view only the 15 most intense categories are listed, the categories that do not produce any value are hidden and the summary boxes are not shown. The Stat Table, Pie Chart and Bar Chart views list all of the categories sorted according to the Total value. For the rule equivalents of the categories, see IP Reputation Protection.
CAPTCHA Lifecycle
Shows the challenges shown and what the visitors did with them side by side: Shown, Solved and Failed. The Shown series is read from the CAPTCHA bucket of the outcome distribution; the requests of the challenge infrastructure itself do not enter the count. All four summary columns come open and the table opens sorted according to the Total value.
In the panel, the Stat Table, Line Chart and Bar Chart views are offered. Since the challenge can be applied only on HTTP vServices, the L7 TCP vServices do not enter the total. For the settings, see Captcha.
These three series are not a division
The number shown can exceed the total of solved and failed; the difference between them is the visitors that see the challenge and give up. For this reason the stacked line and pie views are consciously not offered on the panel.
Action Source
Shows from which protection every intervention applied comes. There are four series: L7 DDoS Protection, IP Reputation Protection, Bot Protection and Quarantine. A request has a single action owner; for this reason the series do not overlap and their total directly gives the number of requests stopped by the module. The penalty box is counted as a source on its own.
As a summary, only Total comes open and the series are sorted according to the Total value. In the panel, the Pie Chart, Line Chart, Stat Table and Bar Chart views are offered. For the priority order between the protections and the detail, see Action Source.
Who Sends to Quarantine
Shows who sends the actors to the shared penalty box. There are four series: L7 DDoS Protection, IP Reputation Protection, Bot Protection and Captcha. It must be noted that the fourth series is different from the one on the Action Source panel: there the box itself is an action source, while here the challenge is among the ones that fill the box.
As a summary, only Total comes open. In the panel, the Bar Chart, Line Chart, Stat Table and Pie Chart views are offered. For the penalty box itself, see Quarantine.
Scope and Limits
INFO
- The tab is displayed only with the Load Balancer permission. All fourteen panels are bound to the same permission; in a user who does not have this permission, the tab does not take place among the view tabs at all.
- Only the HTTP and L7 TCP vServices enter the totals. The protection can be turned on on these two types; the traffic of the Network (Layer 4) vServices does not contribute to any panel. Only the HTTP vServices enter the CAPTCHA Lifecycle panel.
- The panels do not wait for the protection to be on. Even if there is no vService whose L7 DDoS & Threat Protection is on on the device, thirteen panels are laid out and stay empty; only the DDoS & Threat State table opens without a row when there is no vService whose protection is on.
- The panels being empty does not mean that the protection does not work. Every panel family fills only if the related protection produces data: DDoS Trigger Attribution fills only while the DDoS protection is active, and CAPTCHA Lifecycle only if the action of a protection working in the active mode directs to a challenge.
- The combining in the cluster changes according to the panel. In the DDoS & Threat State table, for every vService the values of the two devices are not summed, the larger one is taken; on the other thirteen panels the values of the two devices are summed and a single series is shown.
- The data of the distribution panels comes from the slow collection round. The bot score, the outcome distributions, the trigger breakdown, the reputation categories and the challenge counters are read not in every collection round but at most once in three rounds; in the rounds in which they are not read, a gap is left in the chart instead of a stale value being written. The round interval widens together with the number of vServices on the device: on a small number of vServices the counters are read once in three seconds, and on crowded devices once in twenty seconds. The DDoS & Threat State table is outside this constraint; its value is written in every collection round. The breaks on the panels are therefore normal.
- The fine resolution history is short. On the All vServices panels of the tab, the counters are kept only for the last one minute at the second resolution, for one day at the minute resolution and for one week at the five-minute resolution. The archive of the DDoS & Threat State table is broader: it goes back one minute at the second resolution, 24 hours at the five-second resolution, three days at the fifteen-second resolution, 14 days at the minute resolution and 60 days at the five-minute resolution. In both families, the older ranges are stored with a coarsening resolution for up to ten years.
- The limit, capacity and mode panels at the vService level are not found on this tab. The single-valued indicator of the threat state, the pressure breakdown, the six DDoS limit comparison panels, the two waiting room panels and Protection Modes are found only on the vService dashboard.
- The L4 DDoS protection is not represented on the home page at all. The packet protection at the route table level passes through a separate data plane; its panels do not take place on any tab of the home page nor in the Add Visualization menu. For these, the L4 DDoS Protection section is used.
- The vService scope does not narrow through the tab. The panels read the device-wide total; for the values of a specific vService, the DDoS & Threat State table or the vService's own Dashboard screen is used.
- There is no passing to another screen from the cards. When a vService row in the DDoS & Threat State table is clicked, the dashboard of that vService is not passed to; clicking on the row only hides or shows that series.
