
Smarter by Design.Simpler for Business
Provide Prometheus Service
What Is the Provide Prometheus Service Action?
The Provide Prometheus Service action serves metric data in Prometheus format over the vService. This action creates a metric endpoint at the specified URL path, making it possible for Prometheus or compatible monitoring systems to collect the TR7 metrics.
This action works only at the request stage and responds directly to the requests arriving at the specified path (it does not forward them to the Backend Service).
1 · Prometheus periodic scrape (every 30 sec)
GET /metrics HTTP/1.1Host: tr7-vservice
↓
2 · TR7 vService response (Prometheus format)
tr7_front_current_sessions 42tr7_front_http_requests_total 15823
tr7_back_active_servers 3
…
↓
3 · Visualized with Grafana
Dashboard · graph · alertingThe Importance of the Provide Prometheus Service Action
Prometheus is the most widely used monitoring and alerting system in cloud-native environments. Thanks to the Prometheus integration of TR7, the vService performance and status can be monitored in real time.
The Provide Prometheus Service action;
- provides a data source for Grafana dashboards,
- offers detailed metrics on a vService basis,
- monitors connection counts, request rates and resource usage,
- provides metric data for alerting rules,
- provides integration with Kubernetes and cloud-native environments.
For this reason, the Provide Prometheus Service action is a critical component for modern monitoring infrastructures.
Metrics Provided
This action produces metrics in Prometheus format over the vService on which it is defined. The metrics can be observed at the levels of the TR7 traffic processing layer, the vService (frontend), the Backend Service list and the Backend Service server.
Traffic Manager (TR7 TM) Metrics (tr7_tm_*)
General Metrics
| Metric | Type | Description |
|---|---|---|
tr7_tm_uptime_seconds | gauge | Uptime of the worker process (seconds) |
tr7_tm_pool_failures_total | counter | Number of failed pool allocations since the worker started |
tr7_tm_current_connections | gauge | Current number of connections on the worker |
tr7_tm_connections_total | counter | Total number of connections since the worker started |
tr7_tm_requests_total | counter | Total number of requests since the worker started |
tr7_tm_start_time_seconds | gauge | Worker start time (epoch seconds) |
tr7_tm_stopping | gauge | 1 if the worker is in the shutdown process, 0 otherwise |
Resource Limits
| Metric | Type | Description |
|---|---|---|
tr7_tm_max_fds | gauge | Maximum file descriptor limit per process |
tr7_tm_max_sockets | gauge | Maximum socket limit per process |
tr7_tm_max_connections | gauge | Connection limit per process (via config or ulimit-n) |
tr7_tm_hard_max_connections | gauge | "Hard" connection limit per process (via Memmax_MB or ulimit-n) |
tr7_tm_max_ssl_connections | gauge | SSL endpoint limit per process (front+back), 0=unlimited |
tr7_tm_max_pipes | gauge | Pipe limit for splice, 0=unlimited |
tr7_tm_max_memory_bytes | gauge | Process memory hard limit (command line -m), 0=undefined |
SSL Metrics
| Metric | Type | Description |
|---|---|---|
tr7_tm_current_ssl_connections | gauge | Current number of SSL endpoints (front+back) |
tr7_tm_ssl_connections_total | counter | Total number of SSL endpoints since the worker started (front+back) |
tr7_tm_current_ssl_rate | gauge | SSL connection rate created in the last 1 second (SslRate) |
tr7_tm_limit_ssl_rate | gauge | SSL connection rate limit (global.maxsslrate) |
tr7_tm_max_ssl_rate | gauge | Highest SSL connection rate seen throughout the worker (SslRate) |
tr7_tm_current_frontend_ssl_key_rate | gauge | Number of SSL keys generated on the frontend side in the last 1 second |
tr7_tm_max_frontend_ssl_key_rate | gauge | Highest frontend SSL key generation rate seen throughout the worker |
tr7_tm_frontend_ssl_reuse | gauge | Ratio of frontend SSL connections that do not require a new key (%) |
tr7_tm_current_backend_ssl_key_rate | gauge | Number of SSL keys generated on the Backend Service side in the last 1 second |
tr7_tm_max_backend_ssl_key_rate | gauge | Highest Backend Service SSL key generation rate seen throughout the worker |
tr7_tm_ssl_cache_lookups_total | counter | Total SSL session cache lookups |
tr7_tm_ssl_cache_misses_total | counter | Total SSL session cache misses |
Pipe / Splice Metrics
| Metric | Type | Description |
|---|---|---|
tr7_tm_pipes_used_total | counter | Number of pipes currently in use |
tr7_tm_pipes_free_total | counter | Number of pipes currently allocated and available |
tr7_tm_spliced_bytes_out_total | counter | Total bytes sent via kernel pipe (splice) |
Connection and Session Rate Metrics (Rate/Limit/Max)
| Metric | Type | Description |
|---|---|---|
tr7_tm_current_connection_rate | gauge | Frontend connection rate in the last 1 second (ConnRate) |
tr7_tm_limit_connection_rate | gauge | ConnRate limit (global.maxconnrate) |
tr7_tm_max_connection_rate | gauge | Highest ConnRate seen throughout the worker |
tr7_tm_current_session_rate | gauge | Session rate in the last 1 second (SessRate) |
tr7_tm_limit_session_rate | gauge | SessRate limit (global.maxsessrate) |
tr7_tm_max_session_rate | gauge | Highest SessRate seen throughout the worker |
HTTP Compression and Zlib
| Metric | Type | Description |
|---|---|---|
tr7_tm_http_comp_bytes_in_total | counter | Bytes entering the HTTP compressor in the last 1 second |
tr7_tm_http_comp_bytes_out_total | counter | Bytes leaving the HTTP compressor in the last 1 second |
tr7_tm_limit_http_comp | gauge | Compression auto-disable threshold (CompressBpsOut) |
tr7_tm_current_zlib_memory | gauge | Current zlib memory usage (bytes) |
tr7_tm_max_zlib_memory | gauge | Zlib memory limit (global.maxzlibmem) |
Task / Queue / Listener Status
| Metric | Type | Description |
|---|---|---|
tr7_tm_current_tasks | gauge | Total number of tasks (active + sleeping) |
tr7_tm_current_run_queue | gauge | Number of active tasks + tasklets |
tr7_tm_idle_time_percent | gauge | Time spent idle in the last 1 second (%) |
tr7_tm_jobs | gauge | Number of active jobs (frontend/master/listener) |
tr7_tm_unstoppable_jobs | gauge | Number of unstoppable jobs (master connections) |
tr7_tm_listeners | gauge | Number of active listeners |
tr7_tm_active_peers | gauge | Number of verified active peer connections |
tr7_tm_connected_peers | gauge | Number of peers that have passed the connection step |
Log / DNS / Busy Polling
| Metric | Type | Description |
|---|---|---|
tr7_tm_dropped_logs_total | counter | Number of logs dropped throughout the worker |
tr7_tm_failed_resolutions | counter | Number of failed DNS resolutions throughout the worker |
tr7_tm_busy_polling_enabled | gauge | 1 if busy-polling is enabled, 0 otherwise |
Traffic Byte Metrics
| Metric | Type | Description |
|---|---|---|
tr7_tm_bytes_out_total | counter | Total bytes sent throughout the worker |
tr7_tm_bytes_out_rate | gauge | Outgoing byte rate in the last 1 second |
Memory (Pool) Usage
| Metric | Type | Description |
|---|---|---|
tr7_tm_pool_allocated_bytes | gauge | Amount of memory allocated in pools (bytes) |
tr7_tm_pool_used_bytes | gauge | Amount of memory used in pools (bytes) |
vService (Frontend) Metrics (tr7_front_*)
| Metric | Type | Description |
|---|---|---|
tr7_front_current_sessions | gauge | Current number of sessions on the vService |
tr7_front_max_sessions | gauge | Highest concurrent session count seen throughout the worker |
tr7_front_limit_sessions | gauge | Session limit (maxconn/fullconn) |
tr7_front_sessions_total | counter | Total sessions since the worker started |
tr7_front_bytes_in_total | counter | Total request bytes |
tr7_front_bytes_out_total | counter | Total response bytes |
tr7_front_requests_denied_total | counter | Number of denied requests |
tr7_front_responses_denied_total | counter | Number of denied responses |
tr7_front_request_errors_total | counter | Number of invalid requests |
tr7_front_status | gauge | vService status (state="UP/DOWN") |
tr7_front_limit_session_rate | gauge | Session acceptance limit per second |
tr7_front_max_session_rate | gauge | Highest sessions/s seen throughout the worker |
tr7_front_http_responses_total | counter | HTTP response counts (1xx/2xx/3xx/4xx/5xx/other) |
tr7_front_http_requests_rate_max | gauge | Highest HTTP requests/s seen throughout the worker |
tr7_front_http_requests_total | counter | Total HTTP requests |
tr7_front_http_comp_bytes_in_total | counter | Total bytes entering the compressor |
tr7_front_http_comp_bytes_out_total | counter | Total bytes leaving the compressor |
tr7_front_http_comp_bytes_bypassed_total | counter | Bytes bypassing compression (limit/CPU/memory) |
tr7_front_http_comp_responses_total | counter | Number of compressed HTTP responses |
tr7_front_connections_rate_max | gauge | Highest connections/s seen throughout the worker |
tr7_front_connections_total | counter | Total new connections (accepted) |
tr7_front_intercepted_requests_total | counter | Intercepted requests (redirect/stats/service) |
tr7_front_denied_connections_total | counter | Connections blocked by a TCP rule |
tr7_front_denied_sessions_total | counter | Sessions blocked by a TCP rule |
tr7_front_failed_header_rewriting_total | counter | Number of failed HTTP header rewrites |
tr7_front_http_cache_lookups_total | counter | Number of HTTP cache lookups |
tr7_front_http_cache_hits_total | counter | HTTP cache hit/miss counter (named according to output) |
tr7_front_internal_errors_total | counter | Number of internal errors |
Backend Service Metrics (tr7_back_*)
| Metric | Type | Description |
|---|---|---|
tr7_back_current_queue | gauge | Current number of connections in the queue |
tr7_back_max_queue | gauge | Highest queue length seen throughout the worker |
tr7_back_current_sessions | gauge | Current number of sessions |
tr7_back_max_sessions | gauge | Highest concurrent session count seen throughout the worker |
tr7_back_limit_sessions | gauge | Session limit (Backend Service fullconn etc.) |
tr7_back_sessions_total | counter | Total sessions |
tr7_back_bytes_in_total | counter | Total request bytes |
tr7_back_bytes_out_total | counter | Total response bytes |
tr7_back_requests_denied_total | counter | Number of denied requests |
tr7_back_responses_denied_total | counter | Number of denied responses |
tr7_back_connection_errors_total | counter | Backend->server connection errors |
tr7_back_response_errors_total | counter | Invalid response errors |
tr7_back_retry_warnings_total | counter | Number of retries |
tr7_back_redispatch_warnings_total | counter | Number of redispatches |
tr7_back_status | gauge | Backend status (state="UP/DOWN") |
tr7_back_weight | gauge | Backend effective weight |
tr7_back_active_servers | gauge | Number of active (UP, weight>0) servers |
tr7_back_backup_servers | gauge | Number of backup servers |
tr7_back_check_up_down_total | counter | Number of check-triggered UP<->DOWN transitions |
tr7_back_check_last_change_seconds | gauge | Time elapsed since the last status change |
tr7_back_downtime_seconds_total | counter | Total time spent in DOWN state |
tr7_back_loadbalanced_total | counter | Number of requests routed via load balancing |
tr7_back_max_session_rate | gauge | Highest sessions/s seen throughout the worker |
tr7_back_http_responses_total | counter | HTTP response counts (1xx/2xx/3xx/4xx/5xx/other) |
tr7_back_http_requests_total | counter | Total HTTP requests |
tr7_back_client_aborts_total | counter | Number of client aborts |
tr7_back_server_aborts_total | counter | Number of server aborts |
tr7_back_http_comp_bytes_in_total | counter | Total bytes entering the compressor |
tr7_back_http_comp_bytes_out_total | counter | Total bytes leaving the compressor |
tr7_back_http_comp_bytes_bypassed_total | counter | Bytes bypassing compression |
tr7_back_http_comp_responses_total | counter | Number of compressed HTTP responses |
tr7_back_last_session_seconds | gauge | Time since traffic was last seen (seconds) |
tr7_back_queue_time_average_seconds | gauge | Average queue time (last 1024 connections) |
tr7_back_connect_time_average_seconds | gauge | Average connect time (last 1024 connections) |
tr7_back_response_time_average_seconds | gauge | Average response time (last 1024 connections) |
tr7_back_total_time_average_seconds | gauge | Average total time (last 1024 connections) |
tr7_back_failed_header_rewriting_total | counter | Number of failed HTTP header rewrites |
tr7_back_connection_attempts_total | counter | Total outbound connection attempts |
tr7_back_connection_reuses_total | counter | Number of reused connections |
tr7_back_http_cache_lookups_total | counter | Number of HTTP cache lookups |
tr7_back_http_cache_hits_total | counter | HTTP cache hit/miss counter (named according to output) |
tr7_back_max_queue_time_seconds | gauge | Highest queue time seen |
tr7_back_max_connect_time_seconds | gauge | Highest connect time seen |
tr7_back_max_response_time_seconds | gauge | Highest response time seen |
tr7_back_max_total_time_seconds | gauge | Highest total time seen |
tr7_back_internal_errors_total | counter | Number of internal errors |
tr7_back_uweight | gauge | Backend user weight |
tr7_back_agg_server_status | gauge | Aggregation of server statuses on the backend |
tr7_back_agg_server_check_status | gauge | (Deprecated) Aggregate server status metric |
tr7_back_agg_check_status | gauge | Check status aggregation (L4/L6/L7 etc. labels) |
Backend Server Metrics (tr7_backsrv_*)
| Metric | Type | Description |
|---|---|---|
tr7_backsrv_current_queue | gauge | Current queue on the server |
tr7_backsrv_max_queue | gauge | Highest queue length seen throughout the worker |
tr7_backsrv_current_sessions | gauge | Current sessions on the server |
tr7_backsrv_max_sessions | gauge | Highest concurrent session count seen throughout the worker |
tr7_backsrv_limit_sessions | gauge | Server session limit (NaN if not defined) |
tr7_backsrv_sessions_total | counter | Total sessions on the server |
tr7_backsrv_bytes_in_total | counter | Total request bytes on the server |
tr7_backsrv_bytes_out_total | counter | Total response bytes on the server |
tr7_backsrv_responses_denied_total | counter | Denied responses per server |
tr7_backsrv_connection_errors_total | counter | Server connection errors |
tr7_backsrv_response_errors_total | counter | Invalid response errors |
tr7_backsrv_retry_warnings_total | counter | Number of retries |
tr7_backsrv_redispatch_warnings_total | counter | Number of redispatches |
tr7_backsrv_status | gauge | Server status (state="UP/DOWN/MAINT/DRAIN/NOLB") |
tr7_backsrv_weight | gauge | Server effective weight |
tr7_backsrv_active | gauge | Whether the server is active (UP and weight>0) |
tr7_backsrv_backup | gauge | Whether the server is a backup |
tr7_backsrv_check_failures_total | counter | Number of check failures (NaN if no check) |
tr7_backsrv_check_up_down_total | counter | Number of check-triggered UP<->DOWN transitions |
tr7_backsrv_check_last_change_seconds | gauge | Time elapsed since the last status change |
tr7_backsrv_downtime_seconds_total | counter | Total time spent in DOWN state |
tr7_backsrv_queue_limit | gauge | Queue limit (maxqueue), NaN if none |
tr7_backsrv_current_throttle | gauge | Slowstart throttle ratio (0-100), NaN if none |
tr7_backsrv_loadbalanced_total | counter | Number of requests routed to the server |
tr7_backsrv_max_session_rate | gauge | Highest sessions/s seen throughout the worker |
tr7_backsrv_http_responses_total | counter | HTTP response counts (1xx..5xx..other) |
tr7_backsrv_client_aborts_total | counter | Number of client aborts |
tr7_backsrv_server_aborts_total | counter | Number of server aborts |
tr7_backsrv_last_session_seconds | gauge | Time since traffic was last seen (seconds) |
tr7_backsrv_queue_time_average_seconds | gauge | Average queue time |
tr7_backsrv_connect_time_average_seconds | gauge | Average connect time |
tr7_backsrv_response_time_average_seconds | gauge | Average response time |
tr7_backsrv_total_time_average_seconds | gauge | Average total time |
tr7_backsrv_failed_header_rewriting_total | counter | Number of failed HTTP header rewrites |
tr7_backsrv_connection_attempts_total | counter | Total outbound connection attempts |
tr7_backsrv_connection_reuses_total | counter | Number of reused connections |
tr7_backsrv_idle_connections_current | gauge | Number of idle connections ready for reuse |
tr7_backsrv_idle_connections_limit | gauge | Idle connection limit (pool_max_conn), NaN if none |
tr7_backsrv_max_queue_time_seconds | gauge | Highest queue time seen |
tr7_backsrv_max_connect_time_seconds | gauge | Highest connect time seen |
tr7_backsrv_max_response_time_seconds | gauge | Highest response time seen |
tr7_backsrv_max_total_time_seconds | gauge | Highest total time seen |
tr7_backsrv_internal_errors_total | counter | Number of internal errors |
tr7_backsrv_unsafe_idle_connections_current | gauge | Number of unsafe idle connections |
tr7_backsrv_safe_idle_connections_current | gauge | Number of safe idle connections |
tr7_backsrv_used_connections_current | gauge | Number of connections in use |
tr7_backsrv_need_connections_current | gauge | Estimated number of connections needed |
tr7_backsrv_uweight | gauge | Server user weight |
TIP
These metrics can be visualized with Grafana and comprehensive monitoring dashboards can be created. TR7 also provides ready-made Grafana dashboard templates.
Supported vService Types
HTTP
L7 TCP
Network
Execution Timing
On Request
On Response
How to Add?
A new Provide Prometheus Service Action can be added through the TR7 web management interface by following the steps below:
- The Configuration Menu is opened by clicking the TR7 logo at the bottom left.
- The Load Balancer → Actions → Add steps are followed.
- A unique and descriptive name is entered for the action.
- Provide Prometheus Service is selected as Action Type.
- The related configurations of the action are made.
- In the Conditions tab, the condition/conditions under which the action takes effect are determined.
- The action is added by clicking the
Addbutton.
Provide Prometheus Service Action Add Form
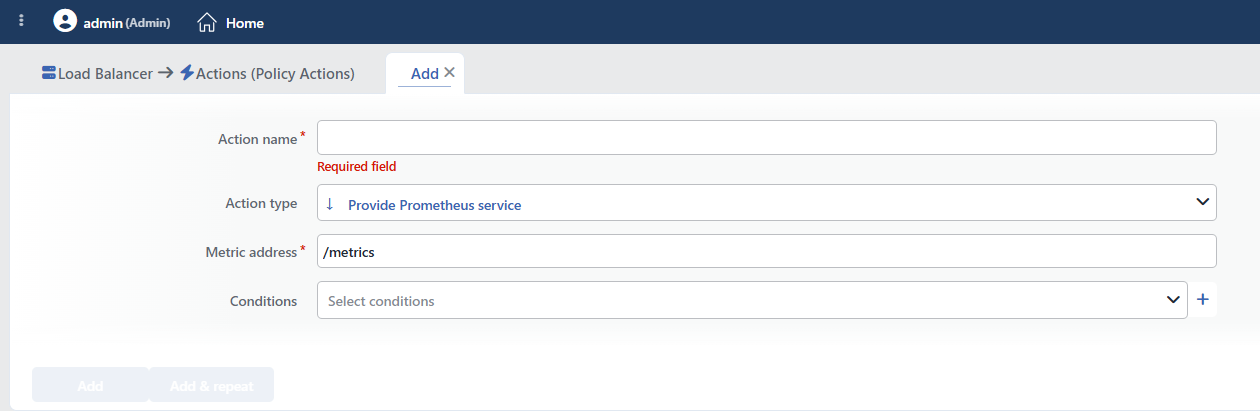 Provide Prometheus Service Action Add Form
INFO
Action Type
Provide Prometheus service is selected as the action type.
Since the action works only at the request stage, the Execution Level and Rule Protocol fields are not located in the form; since a counter is not supported either, the Hit Counter and Set Variable on Hit fields are not present. More than one metric endpoint can be defined on the same vService with different addresses.
INFO
Metric Address Required Default: /metrics
It is the URL path on which the Prometheus metrics will be served. The requests arriving at this address return metric output in Prometheus format. When the action is added, the field comes with the /metrics value by default.
The address must match exactly
The match is made exactly and it is case sensitive: while /metrics is defined, the /metrics/ or /Metrics addresses do not match. The address must start with /; if it does not, the action is saved but never runs.
Only the path is checked; the request method (GET, POST, etc.) is not taken into account and the parameters at the end of the address do not affect the match.
TIP
Sample values:
/metrics: The standard Prometheus path/prometheus: An alternative path/monitoring/metrics: A nested path
INFO
Conditions
In this field, it is defined under which condition or conditions the related action takes effect.
By adding one or more conditions, the behavior can be applied in a targeted and controlled way with the and/or structure.
Detailed information about conditions is on the Conditions page.
WARNING
If no condition is defined in this field, the related action runs unconditionally (Always). In this case, the action is applied to all traffic coming to the related vService.
In live environments, using an action without defining a condition can lead to unexpected situations (service outages). For this reason, it is recommended that at least one condition always be defined when an action is created.
WARNING
The Prometheus endpoint can contain sensitive information. In a production environment, it is recommended to restrict access with IP-based or authentication-based conditions.
INFO
Form Buttons
Add
The action adding process is completed by clicking the Add button.
Add & Repeat
With the Add & Repeat button, the action adding process is completed, and another new action can be added with different configurations without leaving the related window.
 Action Added
Metric Output in Prometheus Format
The GET request made to the specified path returns output in the following format:
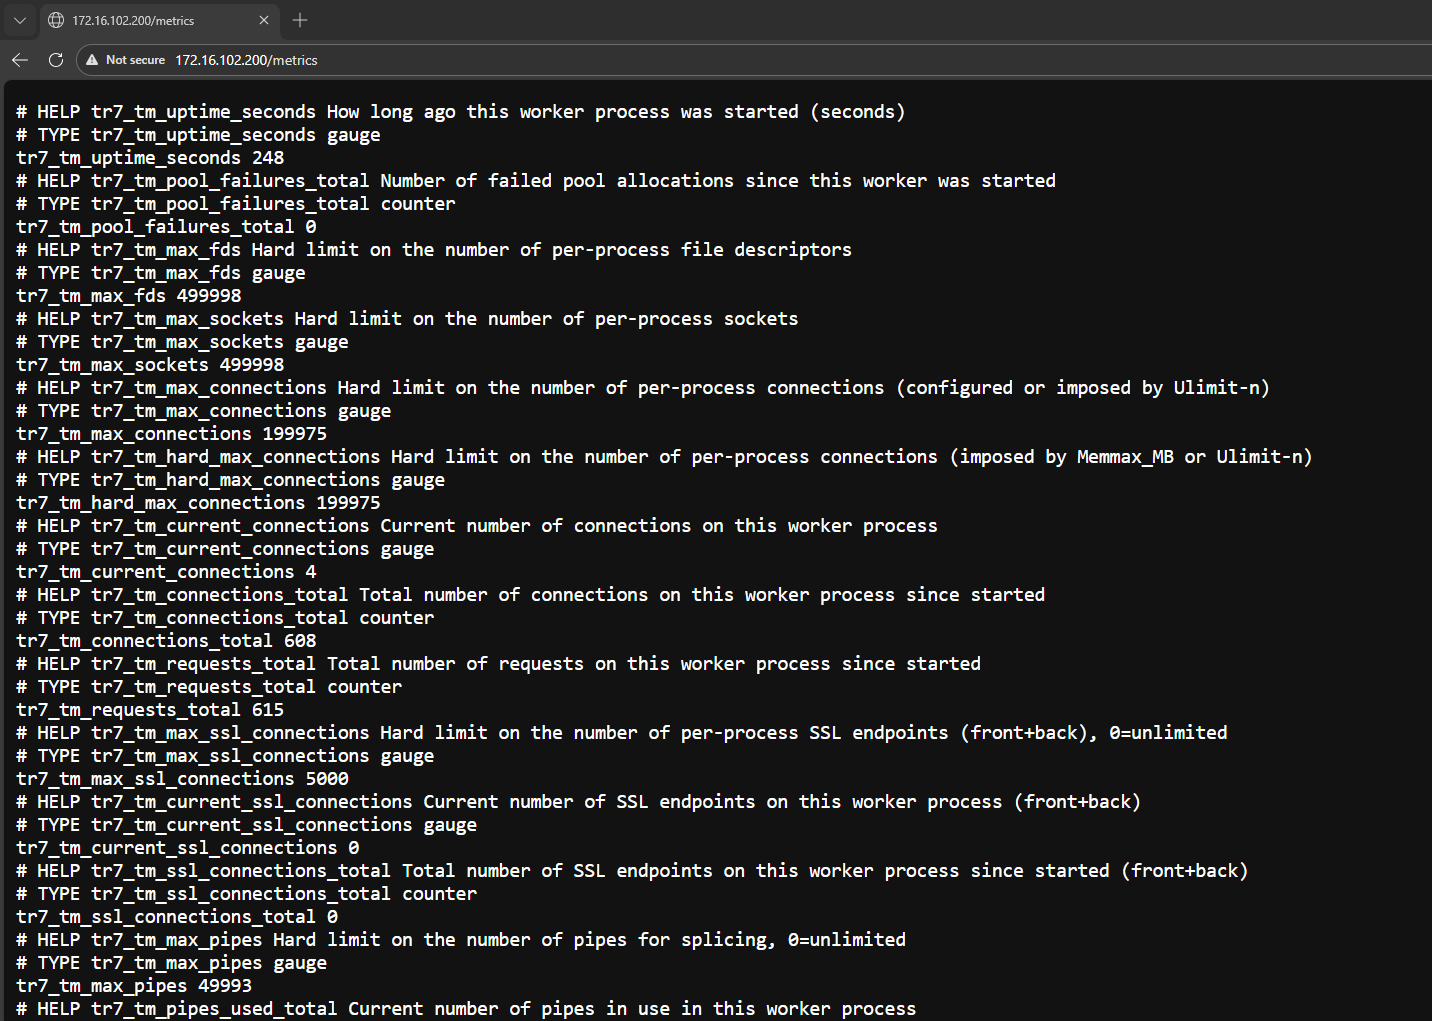 Prometheus Metric Output Example
Prometheus Configuration Example
yaml
# A scrape configuration containing exactly one endpoint to scrape:
# Here it's Prometheus itself.
scrape_configs:
# The job name is added as a label `job=<job_name>` to any timeseries scraped from this config.
- job_name: "prometheus"

    # metrics_path defaults to '/metrics'
    # scheme defaults to 'http'.

    static_configs:
    - targets: ["localhost:9090"]

- job_name: "TR7 vService Dashboard"
    static_configs:
    - targets: ['172.16.102.200:80']
There is no authentication on the metric endpoint
The action responds to the requests arriving at the defined address without looking for authentication. The only way to limit access is the Conditions field; if no condition is defined, the metrics are open to everyone who can access the vService.
Since the metric output contains infrastructure information such as the vService names, the Backend Service counts, the connection and error statistics, access must be limited to the monitoring servers at least with a Source IP condition.
Operational and Safe Usage Recommendations
- The endpoint is protected. The Prometheus endpoint contains system information; access is restricted with an IP whitelist or authentication. By using the Conditions field, only the monitoring systems are allowed to access it.
- A standard path is used. The
/metricspath is standard in the Prometheus ecosystem; when a different path is selected, the Prometheus scrape configuration is arranged accordingly. - The scrape interval is set. The Prometheus scrape interval is determined according to the need; scraping too frequently (< 10 seconds) creates unnecessary load. The typical value is 15-30 seconds.
- Integrate with Grafana. Comprehensive monitoring is provided by visualizing the TR7 metrics in Grafana dashboards.
- Alerting rules are created. With the Prometheus alerting rules, threshold values are determined on metrics such as the connection count and the error rate, and preventive monitoring is performed.
Common Usage Scenarios in Live Environments
The examples below show how the related action is applied in the most frequently encountered use cases in real systems. These scenarios are based on practices that are widely preferred in live environments and rest on experience gained in the field.
Scenario 1: A Secure Prometheus Endpoint with an IP Whitelist
Problem: Prometheus metrics need to be served from the TR7 vServices, but if the metric endpoint is open to everyone, system information (the connection count, the Backend Service status, the resource usage) can leak. Only the monitoring servers should have access.
Solution: The Prometheus metrics are served on the standard /metrics path and, with a Source IP condition, only the monitoring servers are allowed to access them.
Configuration:
- Metric Address:
/metrics - Conditions: Source IP 10.0.1.50 (Prometheus server IP)
Result:
- ✅ Secure access → Only the Prometheus server (10.0.1.50) can access the metrics.
- ✅ Information leakage is prevented → External users cannot access system information.
- ✅ Standard path → Prometheus uses the default
/metricspath, no extra config is required. - ✅ Automatic discovery → Prometheus scrapes the metrics from the
http://tr7-vservice/metricsaddress. - ❌ Other requests → The
/metricsrequests coming from IPs other than the Prometheus server do not receive metric output; these requests are forwarded to the Backend Service like normal traffic.
Prometheus scrape config:
yaml
scrape_configs:
  - job_name: 'tr7-production'
    static_configs:
      - targets: ['172.16.102.200:80']
    metrics_path: '/metrics'
    scrape_interval: 30s