
Smarter by Design.Simpler for Business
Dashboard
What Is Dashboard?
Dashboard is the tab that shows the query, response, traffic, forwarder and system metrics of a DNS service on a multi-panel monitoring screen whose time interval can be selected. When the screen of a DNS service is opened, the Dashboard tab (with the name of the service) comes first.
The screen collects data such as the query rate coming to the service, the distribution of the response codes, the breakdown of the queries according to the record type, the country, the domain name and the record, the cache hits, the answer bandwidth, the latency, the queries forwarded to the forwarder and the own resource usage of the service in different panels. Every panel can be displayed in the map, chart, heat map, table or counter form; it is updated automatically according to the selected time interval. A query wave or an error increase is noticed instantly: from which country it comes, which domain name and record it targets and how the response codes shift are seen on a single screen.
All the monitoring capabilities are a built-in part of TR7: the DNS measurements are collected on the device every five seconds and are kept in archives of up to 10 years; without the need to install an external analytics or SIEM tool, besides the instant monitoring, the trends of years ago can also be examined retrospectively. The archiving is tiered: the finest resolution is kept only for the near past, and as the data get older they are stored by being summarized with wider steps.
5 s
DNS data collection
The DNS measurements are read every five seconds; the panels are updated automatically according to the selected interval
10 Years
Historical data
Statistics are stored in archives of up to 10 years; the time range picker offers preset ranges of up to 5 years
Built-in
No external tool required
All data is collected on the device; no separate analytics/SIEM installation is required
7
View Tab
Six of them unconditional; the Forwarder tab opens if a forwarder is assigned to the service
14
Preset Time Ranges
Preset ranges from 5 minutes to 5 years; also free duration and date range input
~250
Country Breakdown
The queries are monitored on the world map according to the source country
17
Record Type Panel
A separate query panel for every record type from A to LOC
32
Panels per tab
At most 32 panels per view tab, at most 16 custom templates per user
Personal
Customizable layout
Templates, adding/moving panels and resizing are stored per user
Accessing Dashboard
- Left Monitor Panel is opened.
- GTM is selected from the category tabs at the top left.
- The DNS services defined on TR7 are listed.
- The service to be monitored is clicked; the screen opens with the Dashboard tab that carries the name of the service.
The same screen also opens with the service name under the GTM Services card in the GTM tab in the Configuration Menu and with the Dashboard button of the service preview in the Service Management list. When it is come to from the Left Monitor Panel, the time interval selected in the panel is applied to the dashboard.
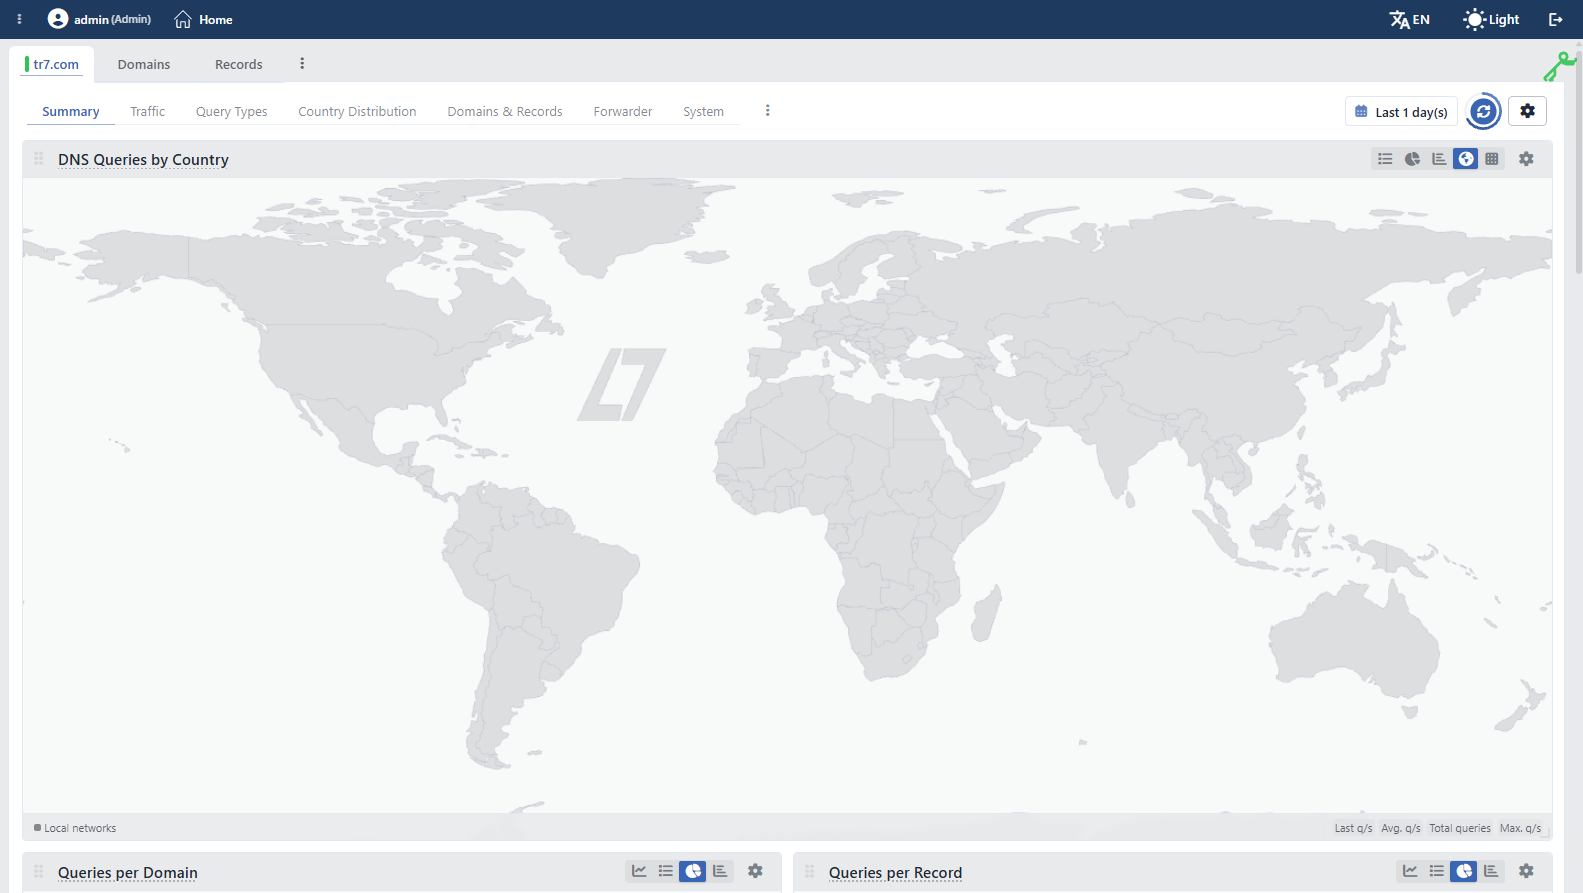 GTM Dashboard
Tab Bar
The label of the first tab is not Dashboard but the name of the service; in front of the label there is a strip that carries the status color of the service. Next to it, the Domains and Records tabs take place on the same screen. In the ⋮ menu at the right end of the tab bar there is a single operation: Edit; it opens the editing form of the service on the same screen as a closable additional tab.
The Service Preview Panel
While the Dashboard tab is open, the preview panel of the service is on the right of the screen. The panel is displayed only on this tab; when it is passed to the Domains and Records tabs, it closes.
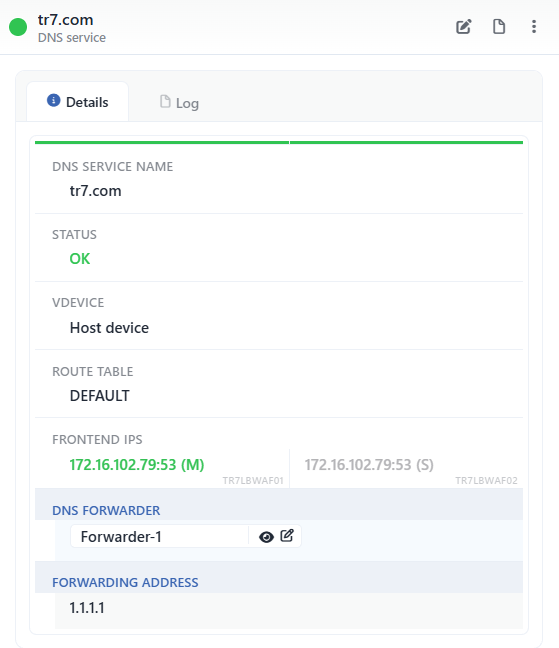 The Service Preview Panel
In the title there are the status circle (in a cluster one circle for every device), the name of the service and the DNS Service subtitle. The operations at the top right:
| Operation | What it does |
|---|---|
| Edit | Opens the editing form of the service in the Edit tab. |
| Log | Opens the GTM event records and the user operations that belong to the service in a window, without leaving the page. |
| Restart Service | It is the only operation in the menu; it restarts the service only on this device without asking for confirmation. |
The Details and Log tabs of the panel and its rows are the same as the preview in the Service Management list; the Dashboard button is not present on this panel.
View Levels (Drill-Down)
The DNS monitoring view is offered at four levels:
| Level | Scope |
|---|---|
| All the DNS Services | The GTM tab on the Home screen of the device; it shows the collective panels (with the All DNS Services - prefix) that cover all the DNS services. See Home Dashboard: GTM. |
| Service | The Dashboard of a single selected DNS service (the screen explained on this page). |
| Domain Name | The own dashboard of a domain name. See Domains. |
| Record | The own dashboard of a DNS record. See Records. |
This page explains the Dashboard at the Service level; the panels on this screen show only the data of the selected service and the collective panels with the All DNS Services - prefix do not take place here. The domain name and record dashboards are not gone down into by clicking the panels; these dashboards are opened from the related screens.
When a time interval is selected by dragging horizontally over the panels, the whole dashboard is locked to that interval. Since this selection produces an absolute start/end interval, it also stops the automatic refresh; in order to return to a relative interval, a ready interval is selected from the time interval selector.
Screen Controls
Above the panels there is a full-width toolbar that controls all panels together. On the left of the bar are the view tabs and the template menu; on the right are the time range picker, the refresh button and the settings. In the top right corner of each panel, there are view icons specific to that panel.
 The Screen Controls
INFO
Menu
The menu at the end of the view tabs contains the operations for the Dashboard tab layouts (templates). When a view tab is double-clicked, that template is returned to its default state; the operation again requires confirmation.
Create New Template
A new empty template (tab layout) is created. In the window that opens, the template is given a name, and the template opens as soon as it is created.
Duplicate Current
A copy of the current template is created; the copy is given a new name. The option is enabled only while a template is open.
Edit Template
The name of the current template is edited. The option is enabled only for templates created by the user; it is inactive for preset templates. The layout is not changed from this window; panels are edited by dragging and resizing them directly.
Reset to Default
The current template is returned to its default state after confirmation is obtained. The option is enabled only for templates on which changes have been made.
Remove Template
The current template is deleted after confirmation is obtained. The option is enabled only for templates created by the user; preset templates cannot be deleted.
Reset All to Defaults
After confirmation is obtained, the dashboard is returned entirely to its default state: the templates created by the user are deleted, the panel changes in preset templates are undone, and the toolbar preferences (time range, automatic refresh, resolution, source, height, theme) return to their default values.
INFO
Last 1 day(s) Time Range
The time period whose data the panels show is selected; the default range is Last 1 day(s). There are fourteen preset ranges, extending from 5 minutes (Last 5 minute(s)) to 5 years (Last 5 year(s)): 5 minutes, 15 minutes, 30 minutes, 1 hour, 3 hours, 12 hours, 1 day, 3 days, 7 days, 1 month, 3 months, 6 months, 1 year and 5 years. Alongside the preset ranges, a free duration (minutes, hours, days, weeks, months, years) is entered with Custom Duration. All panels are updated according to the selected range. The selection made is stored per user and preserved in later sessions.
An absolute range can also be selected by entering a start and end date in the Custom Date Range section.
An absolute range stops automatic refresh
In ranges selected by entering a start/end date, the panels do not refresh by themselves; the data is refreshed only with the refresh button. In addition, an absolute range is not stored as a user preference; when the screen is reopened, it returns to the relative range.
INFO
Refresh
Reloads the data in the panels instantly; the button becomes inactive while loading is in progress. Automatic refresh is enabled by default and the panels update by themselves every 10 seconds; the remaining time is shown with the progress ring around the button. On refresh, the cache is bypassed and the panels are loaded in sequence in groups of twenty.
INFO
Settings
The Dashboard general view and the display settings of the panels are accessed. The window is divided into three sections: Data (resolution and automatic refresh), Clustering (source selection; only while the cluster is enabled) and Visual (height and theme).
Chart Resolution
The resolution of the charts (data point density) is selected: High Resolution (1,440 points), Standard Resolution (720 points, default) or Low Resolution (360 points). High resolution provides a more detailed display, and low resolution a more performant one.
Auto-Refresh
The automatic refresh interval of the panels is set: Disabled, 5s, 10s, 30s and 60s. The default value is 10 seconds.
Source
In cluster setups, which member's data is shown is selected. The options are this device's name, the peer device's name and Both Devices; the default is Both Devices. This section is displayed only while the cluster is enabled.
Height
The height of the panels on the screen is set.
Theme
The display theme (color scheme) of the charts is selected: Professional (default), Corporate, High Contrast, Monochrome Blue and Colorblind Safe.
INFO
Panel View Icons
With the icons in the top right corner of every panel, the display form of the data is changed. The icons are displayed only if more than one view is offered on the panel; on a panel only the views suitable for that data are enabled. For example the map is offered only for the country distribution panel.
| Icon | View | What does it do? |
|---|---|---|
| Map | It shows the country distribution on the world map; the intensity is colored on a country basis. | |
| Line Chart | Shows the metric's change over time (its trend); in multi-series panels it can be drawn stacked. | |
| Bar Chart | Compares the values between series with side-by-side bars. | |
| Pie Chart | Shows the proportional share of the series within the total. | |
| Heatmap | Shows the series as color bands on the time axis; as density increases, the band "heats up". | |
| Stat Table | Lists the series in a sorted table with their summary values (last/average/highest/total); clicking a column header sorts by that column. | |
| 7:10 | Digital | It highlights the summary values with large figures. A separate section is shown for every summary that is open and a separate line for every series. |
| Mini Chart | Shows the metric as a compact trend curve (summary card). |
The Mini Chart view is added by itself to every panel that is single-series and offers a line view.
In the icon of the panel there are two operations: Edit (the settings of the panel) and Remove (removing the panel from the dashboard). The panels are moved by being dragged from the handle in their title and are resized from their bottom right corner; with the Add Visualization card at the end of the layout, a new panel is added to the tab. All the layout changes that are made are stored specifically for the user.
INFO
Panel Metric Columns
Below each panel, the summary statistics of that metric are listed in columns for each series shown:
| Column | Meaning |
|---|---|
| Last value | The last (most recent) value in the selected range |
| Avg. value | The average value over the range |
| Max. value | The highest value in the range |
| Total | The total accumulated over the range |
The unit suffix in the column header changes according to the metric: it is displayed as Last q/s, Avg. q/s, Max. q/s and Total queries on the query panels, as data/s and Total data on the answer bandwidth panels, and as evt/s and Total events on the event panels (DNS Errors, DNS Cache, DNS Traffic Events). On the instant value panels (DNS Latency, DNS Memory, DNS Uptime, DNS TCP Connections) value is written instead of the unit and, since a total is not meaningful, Total is not present.
Which of the existing summaries come open by default changes according to the view and the type of the metric:
- The Stat Table view lists all of the existing columns.
- The line view shows only Total on the rate metrics and only Avg. value on the instant metrics.
- In the pie and bar views, only Total comes open on the distribution panels.
- In the Map view, all summaries are enabled.
- In the Digital view, DNS Uptime shows only Last value, and DNS Memory shows Avg. value and Max. value.
Disabled summaries are enabled by clicking them in the strip below the panel. By clicking the series names in the same strip, individual series are also hidden and shown.
The summary strip does not appear in the line view of multi-series panels
The summary boxes open in the line view (and in the heat map and mini chart views derived from it) only if there are at most six series on the panel. For this reason, on the country distribution, the record type distribution and on the services that have many domain names or records, the summary is not shown in the line view of the Queries per Domain / Queries per Record panels. The bar, pie, table and map views are not affected by this threshold; the summaries are read from these views.
View Tabs
The Dashboard contains upper tabs that group the panels according to their subjects. The Summary tab comes open by default; if another tab has been selected before within the same navigation, that tab is remembered.
 The View Tabs
| Tab | Visibility Condition | Content |
|---|---|---|
| Summary | Always | The basic panels that summarize the general status of the service. |
| Traffic | Always | The query rate, the protocol distribution, the traffic events and the answer bandwidth panels. |
| Query Types | Always | The record type distribution and a separate query panel for each of the 17 record types. |
| Country Distribution | Always | The country distribution of the queries; with the map, pie and table views. |
| Domains & Records | Always | The query tables on a domain name and record basis. |
| Forwarder | If a DNS Forwarder profile is assigned to the service | The panels of the queries forwarded to the forwarder, the bandwidth, the cache and the latency. |
| System | Always | The error, TCP connection, memory, uptime and recursion panels. |
A tab being visible does not mean that data is produced
A view tab can be displayed even if none of the panels in it produce data for that service. If the service does not have a domain name or a record yet, only the Add Visualization card remains on the Domains & Records tab. If the forwarder profile assigned to the service has been deleted from the DNS Forwarder Profiles screen, the Forwarder tab continues to be visible, but its panels are not created. When the condition of a panel is not met, the panel is not shown empty, it is not created at all.
The same panel can be located in more than one tab; below, each panel is described in detail only in the tab where it first appears, and its repetitions are linked to the related description.
Summary Tab
The Summary tab collects thirteen panels that summarize the general status of the service. DNS Query Rate takes place twice on this tab: one as a line chart and the other as a digital value. If the service does not have a domain name or a record yet, the Queries per Domain and Queries per Record panels are not created.
DNS Queries by Country
It shows the country distribution of the DNS queries on the world map according to the geographic location of the client. Every series corresponds to one country; the queries coming from the local and private networks are collected in the Local networks series and this series is always shown even if its value is zero. The countries that have not produced a query in that period are not listed; in the heat map view the 15 most intensive countries are shown. It can be switched between the map, heat map, table, bar and pie (with percentages) views.
Queries per Domain
It shows the query rate coming to every domain name that belongs to the service as a separate series. It can be switched between the pie, stacked line, table and bar views. On the Traffic and Domains & Records tabs the same panel takes place as a full-width table sorted descending according to the total.
Queries per Record
It shows the query rate coming to every DNS record in the service as a separate series; the series are labeled in the record name / record type form. The records that are not bound to a domain name do not take place on the panel. Its views and the table layout on the other tabs are the same as Queries per Domain.
DNS Uptime
It shows the uninterrupted working time of the service (the Uptime series). As a summary only Last value is printed; the value is shown in a readable form such as 3d 5h 50m 31s. The period being reset means that the service has been restarted. The digital value, line, mini chart and table views are offered.
DNS Response Codes
It shows the distribution of the DNS answers according to the response code. The series are NOERROR, NXDOMAIN, SERVFAIL, REFUSED and NOTIMP; the codes other than these are collected in the Other series and this series is hidden by default. The pie, table, bar and stacked line views are offered. The NXDOMAIN or SERVFAIL band growing shows that the queries towards non-existing names or the resolution errors have increased.
DNS Query Rate
It shows the total DNS query rate that reaches the service (the Total Queries series; the total of the UDP and TCP queries). On the Summary tab the same panel takes place once as a line chart and once as a digital value. The digital value, line, mini chart and table views are offered.
DNS Errors
It shows the erroneous and failed DNS events in four series:
| Series | Meaning |
|---|---|
| Corrupt Packets | The corrupt DNS packets that cannot be parsed. |
| Timed Out | The queries that time out. |
| Server Failures | The queries that result in a server error. |
| Unauthorized | The queries that are not answered because they are unauthorized. |
DNS Cache
It shows the hit (Cache Hits) and miss (Cache Misses) rates of the packet cache as a stacked line chart; the table and pie views are also offered. The hit share rising shows that the repeating queries are answered from the cache. The panel is always displayed independently of the Cache setting of the service; on a service whose cache is off, the series remain zero.
DNS Answer Bandwidth
It shows the bandwidth of the answer traffic that the service produces (the Total Answer Bytes series; the total of the UDP and TCP answer bytes). On the Summary tab it is placed as a digital value and on the Traffic tab as a line chart; among the view icons of the panel there are the line, mini chart and table.
DNS Query Protocol Distribution
It shows the distribution of the queries according to the transport protocol: UDP Queries and TCP Queries. The table, pie, bar and stacked line views are offered. The TCP share increasing markedly shows that the large answers or the zone transfers have intensified.
DNS Latency
It shows the average query processing latency (the Latency series). The value is measured in terms of microseconds (µs) and is scaled automatically as µs → ms → s according to the magnitude; as a summary Avg. value comes open. In cluster installations the value of the two devices is not summed, their average is taken.
DNS Query Type Distribution
It shows the distribution of the answered queries according to the DNS record type. By default only the A, AAAA, CNAME, MX and TXT series are visible; the other twelve record types and the Other group are hidden and are opened from the strip under the panel. The table, pie, bar, stacked line and heat map views are offered.
Traffic Tab
The Traffic tab collects the DNS traffic volume, protocol distribution and answer bandwidth panels. The panels take place on the screen in this order: DNS Query Rate, DNS Query Protocol Distribution, DNS Traffic Events, DNS Answer Bandwidth, DNS Bandwidth Protocol Distribution, Queries per Domain and Queries per Record.
DNS Traffic Events
It shows two traffic events: Overload Drops (the queries dropped because of an excessive load) and Notifications (the incoming zone-transfer NOTIFY notifications). The line and table views are offered.
DNS Bandwidth Protocol Distribution
It shows the distribution of the answer bandwidth according to the transport protocol: UDP Answer Bytes and TCP Answer Bytes.
The repeated panels located in this tab (their descriptions are in the Summary tab):
- DNS Query Rate: See DNS Query Rate.
- DNS Query Protocol Distribution: See DNS Query Protocol Distribution.
- DNS Answer Bandwidth: it is placed here as a line chart. See DNS Answer Bandwidth.
- Queries per Domain and Queries per Record: they are placed here as a full-width table sorted descending according to the total. See Queries per Domain.
Query Types Tab
The Query Types tab breaks the answered queries down according to the DNS record type. The tab opens with the general distribution panel (DNS Query Type Distribution); afterwards a separate panel comes for every record type.
The Record Type Based Query Panels
Each of the panels below shows the rate of the answered queries towards the related record type as a single series. The panels take place on the screen in this order:
| Panel | Record Type |
|---|---|
| A Queries | A |
| AAAA Queries | AAAA |
| CNAME Queries | CNAME |
| MX Queries | MX |
| TXT Queries | TXT |
| SOA Queries | SOA |
| NS Queries | NS |
| SRV Queries | SRV |
| PTR Queries | PTR |
| ANY Queries | ANY |
| CAA Queries | CAA |
| DNSKEY Queries | DNSKEY |
| DS Queries | DS |
| HTTPS Queries | HTTPS |
| SVCB Queries | SVCB |
| NAPTR Queries | NAPTR |
| LOC Queries | LOC |
All of the panels are produced in the same form; the line, mini chart, table and digital value views are offered. There is no behavior difference between the panels other than the record type.
Country Distribution Tab
The Country Distribution tab shows the geographic source of the queries in three panels. All three present the same data with a different view: the map (in double size), the pie and the table sorted descending according to the total. For the description of the panel see DNS Queries by Country.
Domains & Records Tab
The Domains & Records tab shows the queries in two tables on a domain name and record basis; both are full width and sorted descending according to the total. If the service does not have a domain name or a record, the panels are not created and only the Add Visualization card remains on the tab. For the descriptions see Queries per Domain and Queries per Record.
Forwarder Tab
The Forwarder tab is visible if a DNS Forwarder Profiles profile is assigned to the service and lets the flow of the queries for which the service is not authoritative be monitored on the forwarder side. The data of the panels are produced only as long as the assigned profile is defined.
Forwarder Query Rate
It shows the rate of the queries that the forwarder forwards to the external servers (the Queries series).
Forwarder Bandwidth
It shows the bandwidth of the answer traffic that the forwarder produces (the Answer Bytes series).
Forwarder Cache
It shows the hit (Cache Hits) and miss (Cache Misses) rates of the forwarder cache as a stacked line chart; the table and pie views are also offered.
Forwarder Latency
It shows the average query latency of the forwarder (the Latency series). The value is measured in terms of µs and is scaled automatically; as a summary Avg. value comes open.
System Tab
The System tab shows the own error, connection and resource metrics of the service. The panels take place on the screen in this order: DNS Errors, DNS TCP Connections, DNS Memory, DNS Uptime and DNS Recursion. The values on this tab belong not to the whole of the device but only to that service; for the device-wide values the Home Dashboard is used.
DNS TCP Connections
It shows the number of TCP connections open to the service at that moment (the TCP Connections series). The value is not a counter but the number of connections at that moment.
DNS Memory
It shows the memory that the service process uses. As a summary Avg. value and Max. value come open. In cluster installations the value of the two devices is not combined, it is shown separately per device.
DNS Recursion
It shows the recursion activity in two series: Questions (the recursed queries) and Answers (the recursed answers).
The repeated panels located in this tab (their descriptions are in the Summary tab):
- DNS Errors: See DNS Errors.
- DNS Uptime: See DNS Uptime.
Scope and Limits
INFO
- The screen requires a GTM license and full GTM authorization. If there is no GTM module in the license, the Not covered by your license card is displayed, and on the users who do not have full authorization in the GTM area, the You don't have access to this page card is displayed.
- The collective panels do not take place on this screen. The panels with the
All DNS Services -prefix are only on the Home Dashboard: GTM tab; the panels on this screen show only the data of the selected service. - The layout settings are not separated per service. Panel adding, moving, resizing, the templates and the toolbar preferences are stored in a single place on a user basis; an arrangement made on one DNS service appears on all the DNS service dashboards.
- The panel that is not in the default tabs. The DNS Cache Entries panel that shows the number of records in the cache does not take place on any ready tab; it is added to the Summary, Country Distribution or Domains & Records tab with the Add Visualization card.
- At most 32 panels per tab and at most 16 custom templates per user can be created. When the limit is reached, a warning is displayed.
- Reset and delete operations require confirmation. Each of the template reset, template delete and full dashboard reset operations shows a separate confirmation window.
- The data collection and storage. The DNS measurements are read every five seconds. The five-second resolution is kept for 24 hours and the minute resolution for 14 days; in the country breakdown the five-second resolution is stored only for 60 seconds. The older intervals are stored with a coarsening resolution for up to ten years.
