
Smarter by Design.Simpler for Business
Audit Logs
What Is Audit Logs?
Audit Logs is the tab where the audit events the AGS engine writes in a vService with the AGS access control enabled are listed. Every important step the user takes in the access flow is recorded as an event: the authentication attempt and its result, the start of the OAuth flow and its return, the sending and the verification of the MFA code, the lockout policy warnings, the taking of the form information, the access permission and the errors that occur in the flow.
Every row represents an event and shows the time of the event, its severity level, the event code, the session identity, the IP address and the browser of the client, the username and the event message. The context of the event (in which flow step and in which worker process it is produced) and the additional data specific to the event are examined as JSON in the preview panel.
The screen answers the questions "why could this user not log in?" or "which steps did this session pass through?". While the Sessions and Lockout tabs show the instant state, Audit Logs keeps the record looking back: the events are written to the record store of the device hour by hour and are read according to the selected time range.
Persistent
Historical Record
The events are written to the disk on an hourly basis; they are within the scope of the Disk Management cleaning
Last 24 Hour(s)
Default Range
Ready-made ranges, a custom duration or a date range are selected
500
Line Limit
The maximum number of events read from every device; in a cluster separately per device
4 Levels
Level
The error · warn · success · info levels are distinguished by color
12 Cards
Filter Strip
Filtering on the basis of the event, the session, the user, the IP, the tag, the browser and the country
JSON
Context · Data
The context and the additional data of the event in full in the preview
Cluster
A Single Combined List
The events of the two devices in a single list, ordered by time
Syslog
The Same Source
The events transmitted to the Log Forwarding destinations are these records
Accessing Audit Logs
- Left Monitor Panel is opened.
- AGS-Enabled vServices is selected from the category tabs at the top left.
- The vServices defined on TR7 with AGS access control enabled are listed.
- The vService to be monitored is clicked; the screen opens with the Dashboard tab that carries the vService's name.
- On the screen that opens, the Audit Logs tab is clicked.
The tab is displayed unconditionally to the users who have monitoring authorization in the Load Balancer area; the events are listed with the Load Balancer view authorization. The screen is read-only and does not contain an operation that makes a change on the record.
Audit Logs Listing Screen
When the Audit Logs tab is opened, the audit events in the selected time range are listed in the form of a table. The list is fetched once when the screen is opened and is not refreshed by itself.
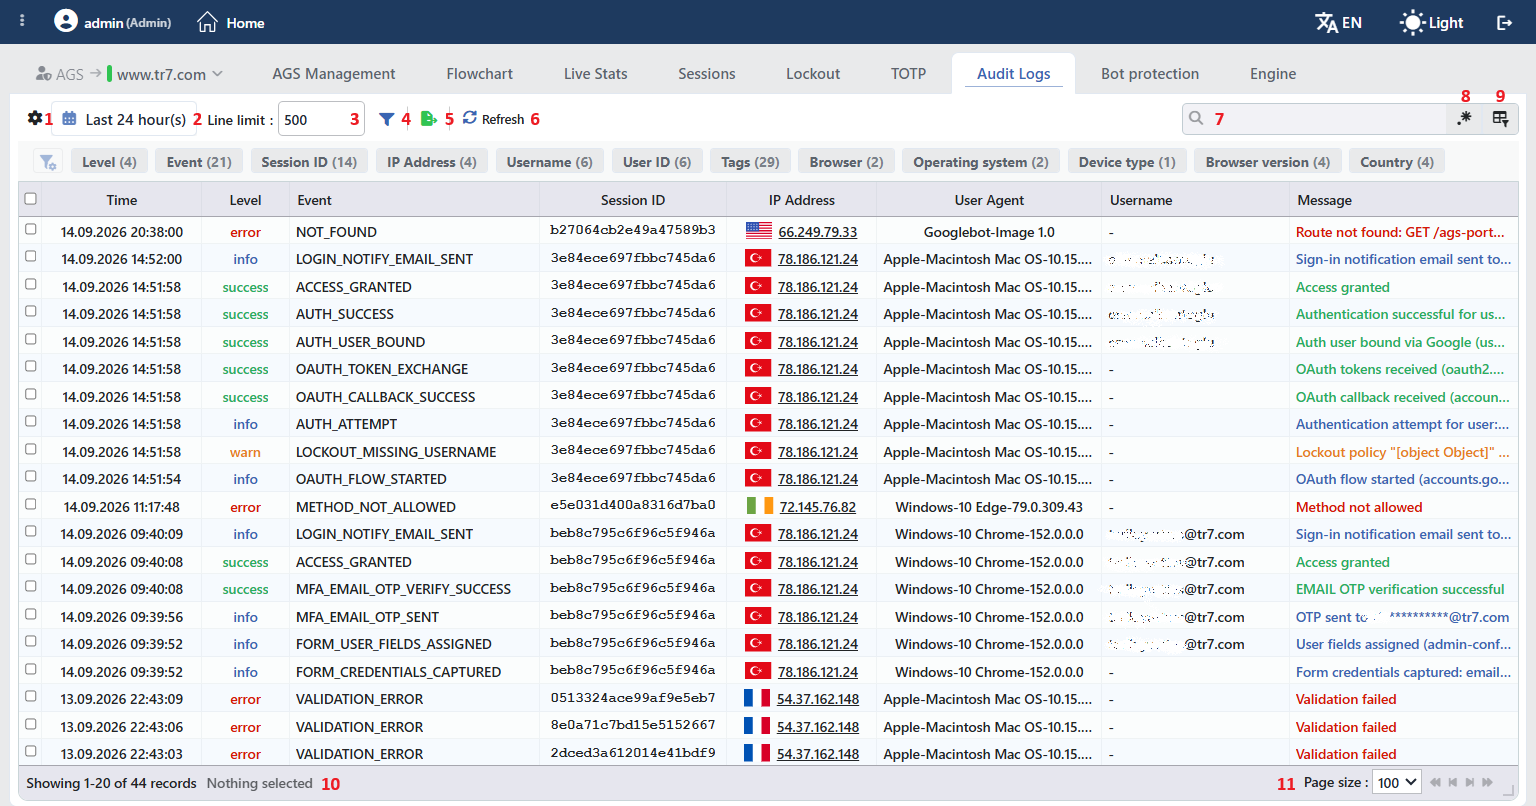 Audit Logs Listing Screen
The table opens with the following columns by default:
| Column | Description |
|---|---|
| Source | The name of the device that records the event. (Only in a cluster setup) |
| Time | The date and time of the event. |
| Level | The severity level of the event, in color (the table below). |
| Event | The event code of the AGS engine (e.g. AUTH_SUCCESS). |
| Session ID | The identity of the session the event belongs to. |
| IP Address | The IP address of the client, with the country flag. When it is hovered over the reputation summary of the address is displayed, and when it is clicked the IP information window titled <ip> details is opened; if there is no address -. |
| User Agent | The browser information of the client, abbreviated in the Vendor-Model OS-Version Browser-Version form (e.g. Windows-10 Chrome-152.0.0.0). In the clients that are not recognized the tool or the bot name (e.g. Googlebot-Image 1.0) or the raw text is written; when it is hovered over the raw User Agent text is displayed. |
| Username | The username known at the moment of the event; if it is not known yet -. |
| Message | The event message of the AGS engine, in the level color of the event. When it is hovered over the whole of the message is displayed. |
The following columns are hidden by default and are added from the column selector:
| Column | Description |
|---|---|
| User ID | The identity the authentication provider gives to the user (e.g. the value with the goog_ prefix in the Google accounts); if there is none -. |
| Tags | The tags of the event, separated by commas (e.g. access, granted, success); if there are none -. |
The rows are listed so that the newest event is at the top according to the time.
Level
| Level | Appearance | Meaning |
|---|---|---|
| error | Red, bold | The error that occurs in the flow (e.g. an address that is not found, a method that is not allowed, a request that cannot be validated). |
| warn | Orange | The situation that does not stop the flow but requires attention (e.g. the step in which the lockout policy cannot be evaluated). |
| success | Green | The step that is completed successfully (e.g. the authentication, the OTP verification, the access permission). |
| info | Blue | The step for information purposes (e.g. the start of the attempt, the sending of the code, the notification email). |
A level that has no color definition in the table is displayed without color.
Event
The Event column shows the event code of the AGS engine. Most of the codes begin with a prefix that states the area the event belongs to; the table below consists of examples compiled from the events in the screenshot and is not the full list of the event codes.
| Area | Example events | Meaning |
|---|---|---|
| Authentication | AUTH_ATTEMPT, AUTH_SUCCESS, AUTH_USER_BOUND | The authentication attempt, the successful verification and the binding of the verified user to the session over the provider (e.g. Google). |
| OAuth | OAUTH_FLOW_STARTED, OAUTH_CALLBACK_SUCCESS, OAUTH_TOKEN_EXCHANGE | The redirection to the provider, the return from the provider and the taking of the tokens. |
| MFA | MFA_EMAIL_OTP_SENT, MFA_EMAIL_OTP_VERIFY_SUCCESS | The sending of the one-time code by email and the verification of the code. |
| Lockout | LOCKOUT_MISSING_USERNAME | The fact that a username-scoped lockout policy cannot be evaluated in a step in which the username is not known yet. |
| Form | FORM_CREDENTIALS_CAPTURED, FORM_USER_FIELDS_ASSIGNED | The taking of the information from the login form and the assignment of the user fields. |
| Access | ACCESS_GRANTED | The granting of the access permission to the user. |
| Notification | LOGIN_NOTIFY_EMAIL_SENT | The sending of the login notification email. |
| Request errors | NOT_FOUND, METHOD_NOT_ALLOWED, VALIDATION_ERROR | The requests coming to the AGS pages with an address that is not found, a method that is not allowed or that cannot be validated. |
The items in the toolbar are arranged from left to right in the following order; the last two items (Page Information and Page Size) are located in the information strip below the table.
Columns
Which columns are shown in the table is selected. In the same panel, columns are reordered by dragging and alignment is selected per column; the row height is fitted to the page with the Fit rows to the page button, and the column layout is reset to default with the Reset button. The layout is stored per user.
Time Range
The time range in which the events will be read is selected; the default is Last 24 Hour(s). The preset range and the Custom Duration selection are stored per user. In the window that opens there are the preset ranges: Last 5 Minutes, Last 15 Minutes, Last 30 Minutes, Last 1 Hour, Last 3 Hours, Last 12 Hours, Last 1 Day, Last 3 Days, Last 7 Days, Last 1 Month and Last 3 Months. With Custom Duration a custom duration in terms of minutes, hours, days, weeks or months; when Custom Date Range is selected the range is filled from 00:00 of yesterday to 00:00 of today; the date and time are written in the Start and End fields in the DD.MM.YYYY HH:mm form or are selected from the calendar that opens with the calendar icon next to the field, and the calendar view is closed with the Done button. The range resolution is one minute.
When an invalid range is entered, the Invalid range warning is displayed in the window and the Refresh button stays passive. When the range is changed the list is not refreshed by itself; the new range is applied with Refresh.
Line Limit
The maximum number of events to be read from the record store of every device is entered; the default is 500; when the field is left empty 500 is used. In a cluster setup the limit is applied to every device separately; in the list up to twice the limit of events is displayed. When the limit is full the reading stops: the hours are read from the newest to the oldest, and the events of every hour from the beginning of that hour. For this reason the last events of the hour in which the limit becomes full and the older hours do not take place in the list; in order for all of the events in the range to be listed, the Line Limit value is kept greater than the number of events in the range. The value is stored per user and is applied with the next Refresh.
Filter
Opens and closes the filter panel; the panel comes open by default. The filters are listed above the table in the form of a card strip and the number next to the card is the number of different values found for that criterion. The order of the cards is changed by being dragged and the selections made are stored. The filter criteria that can be used:
| Filter | Description |
|---|---|
| Level | The severity level of the event, with its colors in the table. |
| Event | The event code. |
| Session ID | The session identity; a search is made within the card. It is used in order to see all of the steps a session passes through in order. |
| IP Address | The IP address of the client, with the country flag; a search is made within the card. |
| Username | The username; a search is made within the card. |
| User ID | The user identity; even if the column is hidden the card is found. |
| Tags | The event tags; every tag of an event is counted separately. Even if the column is hidden the card is found. |
| Browser | The browser name extracted from the User Agent text. |
| Operating System | The operating system extracted from the User Agent text. |
| Device Type | The device type extracted from the User Agent text (Desktop, Mobile, Tablet, Console, Smart TV, Wearable, Embedded). |
| Browser Version | The main version of the browser. |
| Country | The country of the client IP address. In the private and local addresses the country information is not found. |
| IP Tags | The IP Tags that match the client address; untagged addresses are collected under the No Tags option. |
In a cluster setup the Source card that shows the device that records the event is added to these cards.
Export
The table is exported as Excel, CSV or PDF by clicking the Export button. In the window that opens, the Filename, Format and Data Source, together with the Columns to be exported, are determined; the remaining fields are displayed according to the format: CSV Separator for CSV, Excel Sheet Name for Excel, and Page Orientation and Page Size for PDF.
Refresh
By clicking the Refresh button the events are fetched again from the record store with the selected Time Range and Line Limit values; the list fetched takes the place of the previous one. While the fetching continues the button stays passive and shows a turning icon.
Search
Used to search all information in the table.
RegExp Search
Used to search all information in the table with a regular expression (RegExp).
Column Based Search
Used to perform a column-based search on the information in the table.
Page Information
Contains information about the number of events remaining after the filter and the search and about the range of rows displayed on the screen: Showing N-M of T records and the number of selected rows (N selected, Nothing selected while there is no selection). The total is not the number of all of the events in the record store but the number of those that match the filters from among the events fetched with Time Range and Line Limit. The rows can be selected but there is no operation on this screen that works with the selection.
Page Size
The maximum number of events to be displayed on the page is selected. The default is 100; the options are 50, 100, 250, 500 and All. The selection is not stored.
There is no right-click menu
A right-click menu specific to the rows is not defined in the Audit Logs table; the records are only examined and exported.
Preview of the Selected Event
When a row in the list is clicked, the preview of the event opens on the right of the screen. In the title there are the icon that shows the level of the event (a red cross for error, an orange warning triangle for warn, a green check for success, a blue information icon for info) and the event code, and below it the time of the event together with the username (if there is none the user identity). The icon next to the subtitle copies the Session ID value of the event to the clipboard; in the events that have no session identity the in-list identity of the row is copied. There is no operation button in the title.
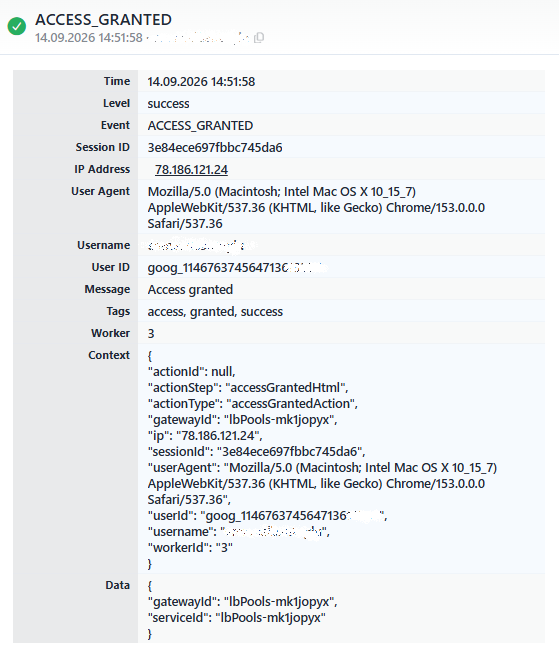 Preview of the Selected Event
The information rows in the panel are as follows in order:
| Row | Description | Visibility condition |
|---|---|---|
| Source | The name of the device that records the event. | A cluster setup |
| Time | The date and time of the event. | Always |
| Level | The severity level. | Always |
| Event | The event code. | Always |
| Session ID | The session identity; if there is none -. | Always |
| IP Address | The IP address of the client; when it is clicked the IP information window is opened. | If there is IP information |
| User Agent | The unabbreviated User Agent text of the client; if there is none -. | Always |
| Username | The username; if there is none -. | Always |
| User ID | The user identity; if there is none -. | Always |
| Message | The event message. | Always |
| Tags | The event tags; if there are none -. | Always |
| Action | The name of the flow step that produces the event; the icon next to it shows the settings of the step without an edit button. | If the event is produced in a flow step |
| References | The list of the records the event is related to (e.g. a policy or a provider), each of them with its name and the icon. | If there is a related record |
| Worker | The number of the AGS engine worker process that handles the event. | Always |
| Context | The context of the event, as JSON (e.g. the flow step actionId, actionStep, actionType; the vService identity gatewayId; the client ip, userAgent; the session sessionId; the user userId, username; the worker process workerId). The fields change according to the event type. | Always |
| Data | The additional data specific to the event, as JSON (e.g. gatewayId, serviceId). The content changes according to the event code. | Always |
Scope and Limits
INFO
- The records are kept per device. Every device writes the events of its own AGS engine to its own record store on an hourly basis; in a cluster setup the screen combines the events of the two devices in a single list and separates them with the Source column. When the other device in the cluster does not respond, the list is fetched only with the events of the device that responds.
- The storage is within the scope of the disk management. The audit records are within the scope of the automatic disk cleaning on the Disk Management screen (the default 90% and 12 months) and are deleted by hand on a monthly basis with the AGS Audit Logs type in the File Management list.
- Only the events of the engine are listed. The operations made in the TR7 management interface (e.g. Revoke Session(s), Clear Lockouts, Reset TOTP, Restart Engine) are written not to this screen but to the User Logs screen.
- The list is fetched with the range and the limit. The time range and Line Limit changes are applied with Refresh; in a vService with heavy traffic the limit is raised according to the number of events in the range.
- The hours that have no record file are skipped. If there has been no access to the vService at all or if no event has been produced in the selected range, the list comes empty.
- The SIEM transmission uses the same records. The events transmitted to the Log Forwarding destinations selected as Audit Log Forwarders in the AGS settings of the vService are these records; the events that exceed the transmission limit also continue to appear on this screen. The events at the success level are transmitted to the destination at the information level.
- What the screen does not show. The annotated catalog of the event codes, changing the level of the events and deleting a record do not take place on this screen; the Session ID value does not carry a link to the Sessions tab.
