
Smarter by Design.Simpler for Business
Notifications
What Is Notifications?
Notifications are the informing the operator settings of the Bot/DDoS protection of a vService. Unlike the other cards on the strip, it does not apply any enforcement to the traffic: it only determines which events will give rise to a notification and through which channels these notifications will be transmitted.
The setting does not belong to any one of the three protections. The notification block is at the module level: it stands above L7 DDoS Protection, Bot Protection and IP Reputation Protection and evaluates the results produced by the three together. For this reason the card is located not among the protection columns but among the cards in the body of the strip.
There are three separate trigger sources: the threat state band of the vService, the pending recommendations of the learning assistant and the advanced notification triggers that the operator defines itself. The notifications produced by the three are transmitted through the same four channels and are written to the same notification log.
3
Trigger Sources
The threat state band, the pending recommendations of the learning assistant and the advanced notification triggers
4
Notification Channels
E-mail, SMS, SNMP Notification and UI Notification; each one is enabled independently
UI Notification
Channel On By Default
Of the four channels only this one comes on; the notification becomes visible even without a defined address
3
Selectable State Bands
Possible Attack, Attack Detected and Active Attack; the lower two bands cannot be selected as a trigger
6
Advanced Trigger Limit
At most six advanced notification triggers are defined on a vService
8
Trigger Scopes
Global, source IP, network block, country, ASN, network type group, network type category and host
4
Count Types
Action taken, detection, request and connection; the first two count decisions and the last two raw volume
Automatic
Repeat Notification
An ongoing alarm is repeated once every six times the window; it is clipped to between 30 minutes and 2 hours
In Every Type
HTTP and L7 TCP
The card is present on both vService types; on L7 TCP some trigger scopes do not work
The three trigger sources that the card manages are as follows:
| Trigger | What it monitors | When it notifies |
|---|---|---|
| State Band Notification | The general threat state axis of the vService | When the state rises to the selected band or above it; when it falls back below the threshold, a normalization notification is also sent |
| Recommendation summary | The number of pending recommendations of the learning assistant | When the number of pending recommendations is greater than zero and at every increase; it is muted with Mute Suggestion Notifications |
| Advanced Notifications | The scope and window counters that the operator defines | When the counter exceeds the threshold in the defined window; on the return to normal, the closing notification is sent only if the alarm has exceeded one repeat cycle |
Scope
The settings are kept per vService and are not device-wide. The card is present on the vServices of both the HTTP and the L7 TCP type: unlike the Captcha and Waiting Room cards, this card is listed on L7 TCP as well. However, a part of the advanced triggers does not work on this type: the triggers of the Requests count type and the triggers in the Host Header scope are kept in the record, their counters are not created in the data plane.
The display of the screen requires monitoring permission in the Load Balancer area; the pencil icon that opens the edit window is displayed only on the users that have change permission in the Load Balancer area. The editing of the fields is written to the user log.
Muting the recommendation notifications also stops the learning
When Mute Suggestion Notifications is checked, not only the notification is muted: the periodic run of the learning assistant is skipped completely for this vService and the pending recommendation summary is turned off. That is, the recommendations are not produced and accumulated silently, they are not produced at all. If it is wanted that the recommendations continue to be produced but that no notification arrives, the notification channels must be turned off instead of this box.
The setting is kept only while the learning mode is Smart Advisor. When the mode is taken to another value and saved, the field is cleared; when the mode is made Smart Advisor again, the muting preference does not come back, it returns to its default value.
The channels are independent of each other
There is no master switch that turns off the four channels together; every channel is turned on and off with its own switch. The E-mail and SMS channels keep their recipient lists in this window: no recipient is taken from the notification contact groups on the Settings screen. The SNMP Notification and UI Notification channels have no additional field; the SNMP target (version, address, port, community) is read from the general SNMP settings on the Settings screen.
If a channel is on but its target is undefined, the notification is silently dropped: an empty recipient list or an undefined SNMP target does not produce a warning on the screen.
The Notifications Card on Bot/DDoS Management
The Notifications card in the body of the Bot/DDoS Protection Mode strip shows two rows. The Channels row writes the names of the open channels separated by commas; the order is fixed and proceeds in the form UI Notification, E-mail, SMS, SNMP Notification. For a channel to be considered open, it is enough that its switch is on or that its address list is not empty. If all four channels are off, Disabled is written in the row.
The State Band Notification row shows the name of the selected band; if no trigger is selected, Disabled is written here as well. If an advanced notification trigger is defined, the card adds a third row and writes the number of the triggers defined with the Advanced Notifications label; if there is no trigger, this row is not present.
If all four channels are off, the whole of the card fades. A faded card can still be edited: the pencil icon continues to work. The Notification Log → link at the bottom right does not go to another page; it opens the notification log as a closable tab on the same screen.
When the pencil icon at the top right of the card is clicked, the edit screen opens.
 Bot/DDoS Protection Mode - The Notifications Card
The Notifications Edit Screen
- The Bot/DDoS Management tab is opened.
- The pencil icon at the top right of the Notifications card in the body of the strip is clicked; the edit window titled Edit - Notifications opens.
- The following fields are edited and confirmed with the
Editbutton.
On the left of the window there is a section list. In the default state two sections are listed: Notifications and Notification Channels. When one of the advanced notification triggers is defined in the Country or Network Type Group scope, the filter section of that scope is also added to the list.
Notifications Section
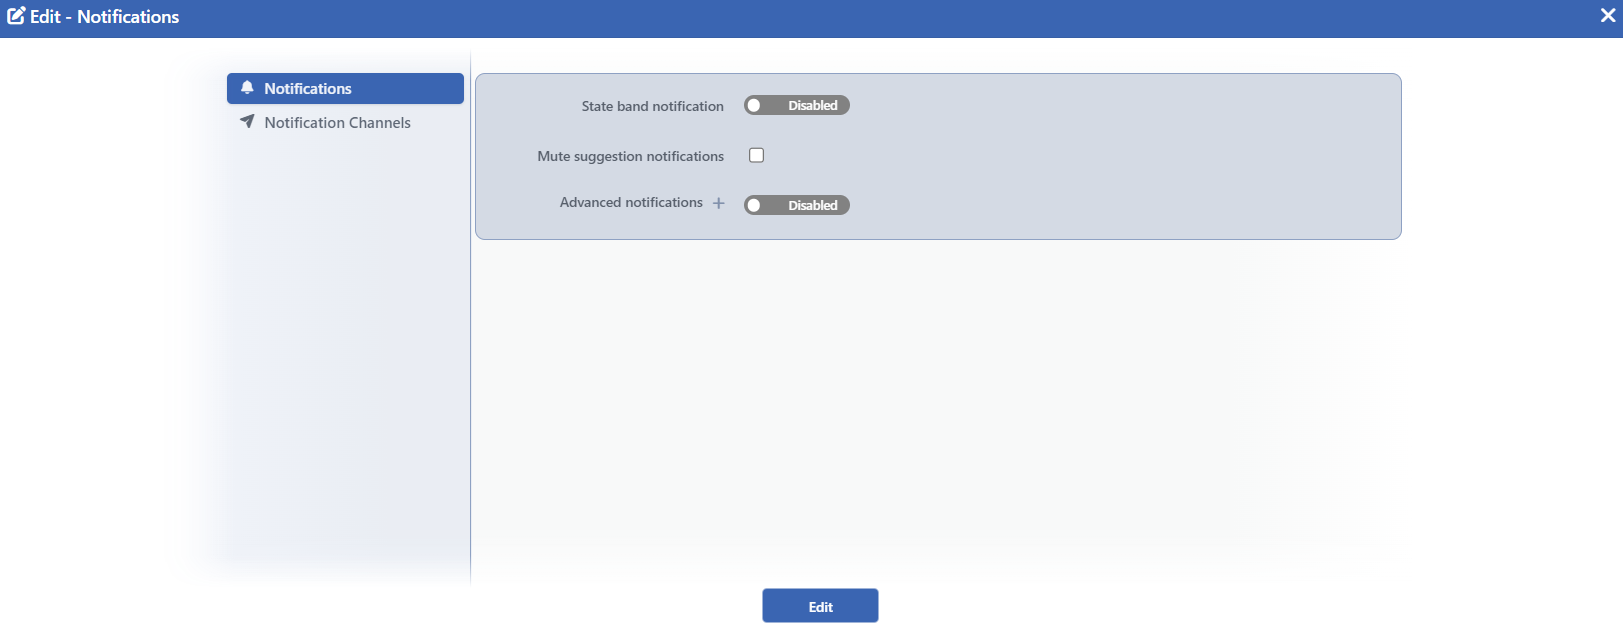 The Notifications Edit Screen
INFO
State Band Notification
The general threat state of the vService is measured on an axis and this axis is divided into bands. The field selects the band that will start the notification. First a Disabled and Enabled switch is displayed; when the switch is turned on, the band picker appears next to it and the Possible Attack band is proposed.
There are three bands that can be selected:
| Band | Meaning |
|---|---|
| Possible Attack | The state axis has passed the first notable threshold |
| Attack Detected | At least two separate measurements have witnessed an attack at the same time |
| Active Attack | Both axes of the measurement have reached the peak value |
The lower two bands (No Attack and Low Activity) cannot be selected as a trigger: the first one is the absence of the state and the second one is for information purposes.
The notification is produced when the state rises to the selected band or to a band above it. Since the state is kept with the name of the band, a climb to an upper band also gives rise to a new notification. When it falls back below the threshold, a normalization notification is sent. A state change must last for two consecutive measurements before it turns into a notification; instantaneous fluctuations do not produce a notification.
While the switch is off, the state tracking is cleared completely and no notification is produced.
INFO
Mute Suggestion Notifications Default: Not checked
Mutes the pending recommendation summary of the learning assistant. It is not checked by default, that is, the recommendation notifications are on.
The field is displayed only while the learning mode is Smart Advisor. That the muting also stops the learning run and that the preference is lost on a mode change is explained in the warning box above.
INFO
Advanced Notifications
They are the counter triggers that the operator defines itself. The field is first displayed as a Disabled and Enabled switch; when the switch is turned on, the first trigger card is created. The + icon (Add Trigger) next to the label adds a new trigger card.
At most six triggers are defined on a vService. The fields and the behavior of the triggers are explained in the Advanced Notifications section below.
Notification Channels Section
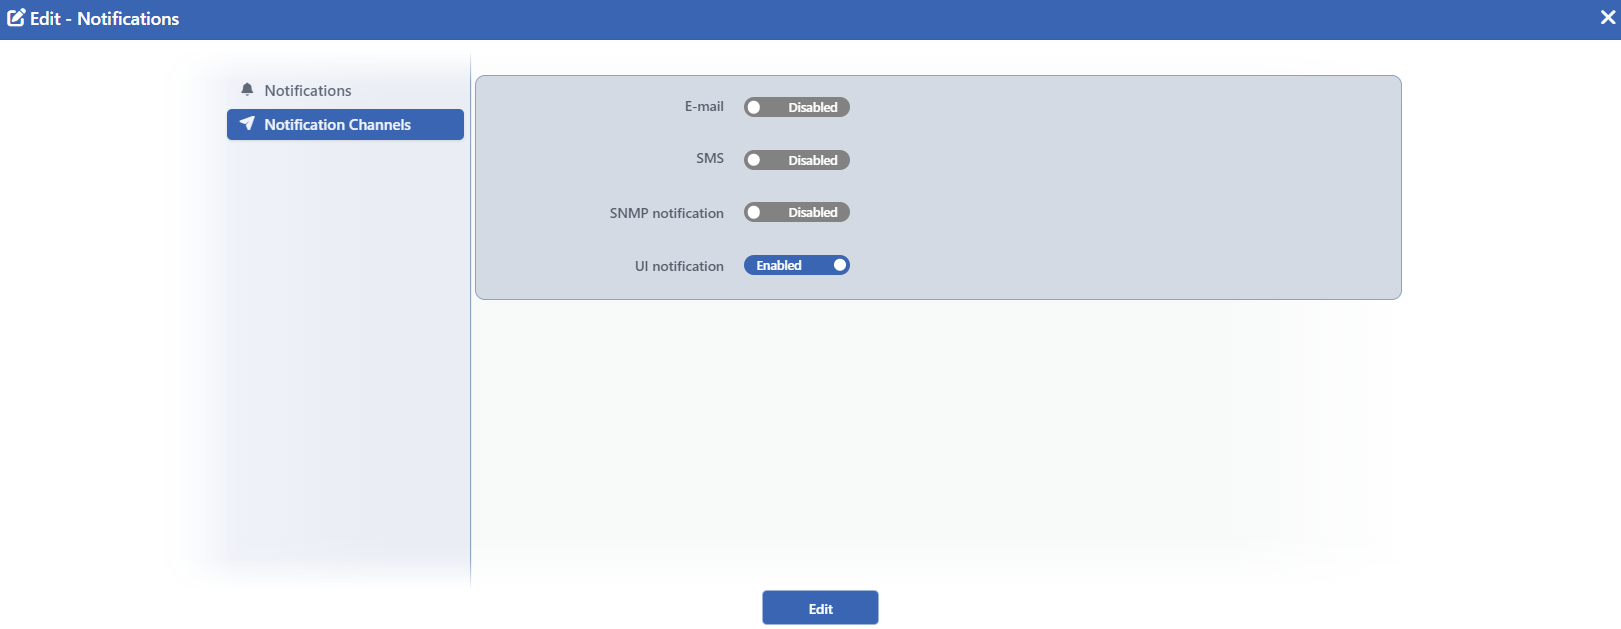 Notification Channels Section
INFO
E-mail
Ensures that the notifications are transmitted by e-mail. When the switch is turned on, the address list is displayed below it and recipients are added row by row. The fields pass through e-mail format validation.
The sending uses the general e-mail settings on the Settings screen: the sender name and address and the common subject prefix come from there. The subject line is completed with the name of the notification, and the name of the device is located in the body. If the list is left empty, no e-mail is sent and no recipient information is created in the notification log.
INFO
SMS
Ensures that the notifications are transmitted by short message. When the switch is turned on, the number list is displayed; the fields pass through phone number format validation.
The message text is stripped of formatting and the name of the device is added to its end. If the night muting is on in the general notification settings on the Settings screen, only the SMS channel is cut between 22:00 and 08:00; the e-mail, SNMP and interface notifications are transmitted at these hours as well.
INFO
SNMP Notification
Ensures that the notifications are sent as an SNMP trap. The switch has no additional field: the version, the target address and port and the community information are read from the general SNMP settings on the Settings screen.
If the target is undefined, the sending fails and this situation is not reported on the screen; the card continues to show the channel as open. The sendings made with SNMP are not displayed in the Notification Contacts column of the notification log either.
INFO
UI Notification Default: On
Ensures that the notifications are displayed in the notification shelf in the TR7 interface. It is on by default and is the only channel among the four that comes on: in this way, even if no address has been defined, a defined trigger produces a visible output. It has no additional field.
INFO
Edit
The changes in the form are saved by clicking the Edit button. There is no additional confirmation window or deployment (deploy) step; the Load Balancer configuration is automatically regenerated and applied.
Advanced Notifications
The advanced notifications are counters that measure the numbers produced by the protection in a certain scope and in a certain time window. When the counter exceeds the threshold in the window, a notification is produced, and when it returns to normal, it closes.
In every trigger card the following fields are present:
| Field | Meaning | Default |
|---|---|---|
| Scope | Per which unit the counter will be kept | Country |
| Count | What will be counted | Actions Taken |
| IPv4 Prefix / IPv6 Prefix | The block width in the network block scope; it is displayed only in the Source Subnet scope | 24 / 64 |
| Window | The measurement window; at least 30 seconds, at most 1 hour | 5m |
| Threshold | The value that is looked for to be exceeded in the window | 100 |
| Event-Log Attachment | The event log slice to be attached to the notification e-mail; it is displayed only on the triggers that count decisions and in the scopes that support it | Empty |
The Scope Values
| Scope | The counter unit | The decision base | The volume base |
|---|---|---|---|
| Global (All Traffic) | The whole of the vService | 100 | 2000 |
| Source IP | A single source address | 10 | 300 |
| Source Subnet | The block in which the source address is located | 20 | 600 |
| Country | The country of the source | 50 | 1000 |
| ASN | The autonomous system of the source | 20 | 1000 |
| Network Type Group | The network type group | 50 | 1000 |
| Network Type Category | The network type category | 100 | 2000 |
| Host Header | The host requested; only HTTP | 20 | 600 |
The base values cannot be gone below. When a threshold below the base is written into the edit window, the form gives the warning Threshold for this scope must be at least <base> and no record is made. A value below the base that comes over REST or CLI, on the other hand, is not rejected: it is silently raised to the base and the raised threshold is written in the notification text. The bases change according to whether the counter counts decisions or raw volume.
The Count Values
| Count | What is counted |
|---|---|
| Actions Taken | Every terminal action applied; the decisions of the three protections and the availability ceilings are counted together |
| Detections (Action + Monitor) | In addition to the actions applied, the decisions that the protections in the monitor mode would apply |
| Requests | The raw request number before the decision; no counter is created on an L7 TCP vService |
| Connections | The raw connection number before the decision |
The first two values count decisions and the last two values count raw volume. The two are kept in separate counters: even if the same scope and the same window have been selected, the decision and the volume triggers work independently of each other. The rows that are only written to the event log but that are not bound to a decision do not enter the decision counters; the raw volume counters count these requests nevertheless.
The Trigger Behavior
- Entering the alarm: a notification is produced when the counter value exceeds the effective threshold; values equal to the threshold do not give rise to a notification.
- The return to normal: the alarm closes when the value falls below 80 percent of the effective threshold. The closing notification is sent only if the alarm has exceeded at least one repeat cycle; short-lived alarms close silently.
- The repeat notification: an ongoing alarm is repeated once every six times the window. This value is limited in such a way that it is at least 30 minutes and at most 2 hours, and it is not an adjustable field. A five-minute window is repeated once every thirty minutes and a one-hour window once every two hours.
- The limit of the keys that are in alarm at the same time: a trigger keeps at most 100 keys in alarm at the same time; at most 10 new alarms are opened in one scan round. The violations that are caught by the round limit are not lost, they are taken into alarm in the following scan rounds. When the ceiling of 100 is full, on the other hand, a separate intensity notification is sent for the remaining violations, and when the ceiling is emptied, this notification closes as well.
- When the scope, the network mask, the window or the count type of the trigger changes, the alarm state is reset. Changing the threshold or the event log attachment does not reset the state.
The Country and Network Type Group Filters
When one of the advanced triggers is defined in the Country scope, the Country Traffic Notification section is added to the edit window, and when it is defined in the Network Type Group scope, the Network Type Group Notification section is added. These sections are not filters applied to a single trigger but filters applied to all the triggers in that scope together.
| Field | Option | Meaning |
|---|---|---|
| Country Scope / Network Type Group Scope | All Countries / All Groups | No filter is applied; every value in the scope can produce a notification |
Selected Only | Only the values written into the list produce a notification | |
All Except Selected | The values written into the list do not produce a notification | |
| Countries / Network Type Groups | List | The filter list; it is displayed only when the first field is taken to a value other than All… |
The filter does not stop the counters: the counters continue to work, only the notification production is filtered.
The Notification Texts
The text of the advanced notifications is produced from the count type and the scope. The texts produced are in the following patterns in English:
"<vService name>": <count type> <scope expression> over the threshold: <counter>/<window> > <threshold>/<window>
"<vService name>": <count type> <scope expression> still over the threshold (notice #<n>): <counter>/<window> > <threshold>/<window>
"<vService name>": <count type> <scope expression> back to normal after <period>: <counter>/<window> < <threshold>/<window>
The count type texts are in the form protection actions taken, threat detections, request rate and connection rate respectively. The scope expression, on the other hand, takes the forms in total, from IP <address>, from network <block>, from <country>, from ASN <number (name)>, from network type <group>, from network category <category> and to host <host>.
The texts of the state band and the recommendation notifications are as follows:
Threat protection state for vService "<vService name>" reached <band>
Threat protection state for vService "<vService name>" is back below the alert level
"<vService name>": <n> Bot/DDoS protection suggestion(s) available for this vService — review them on the Bot/DDoS management screen
The Event Log Attachment
When the Event-Log Attachment field is filled, the event log slice belonging to that trigger is attached to the notification e-mail. PDF or CSV is selected as the format. The attachment can be used only on the triggers that count decisions and in the scopes other than Network Type Category.
The production of the attachment delays the e-mail channel: the interface, SMS and SNMP notifications go instantly, and the e-mail is sent as a single combined message after the attachment has been prepared. The time range of the slice is fixed to the measurement moment of the trigger and goes back as far as the window. The attachment carries at most 2,000 rows; in the PDF format this limit is 500 rows. If the attachment cannot be produced, the e-mail is still sent and in its body it is stated that the event log can be displayed from the vService's own tab.
Notification Log Tab
The Notification Log → link below the card opens the notification log of the vService as a closable tab named Notification Log on the upper strip of the screen. The tab is not permanent: it is opened only with this link and when it is closed, it returns to the Bot/DDoS Management tab. Whether the protection is on or off does not affect the opening of the tab.
The log lists the ones that belong to this vService among the notification records of the device. In a cluster installation the records of the peer device are also fetched and they are distinguished in the Source column; if the cluster is not active, this column is not displayed.
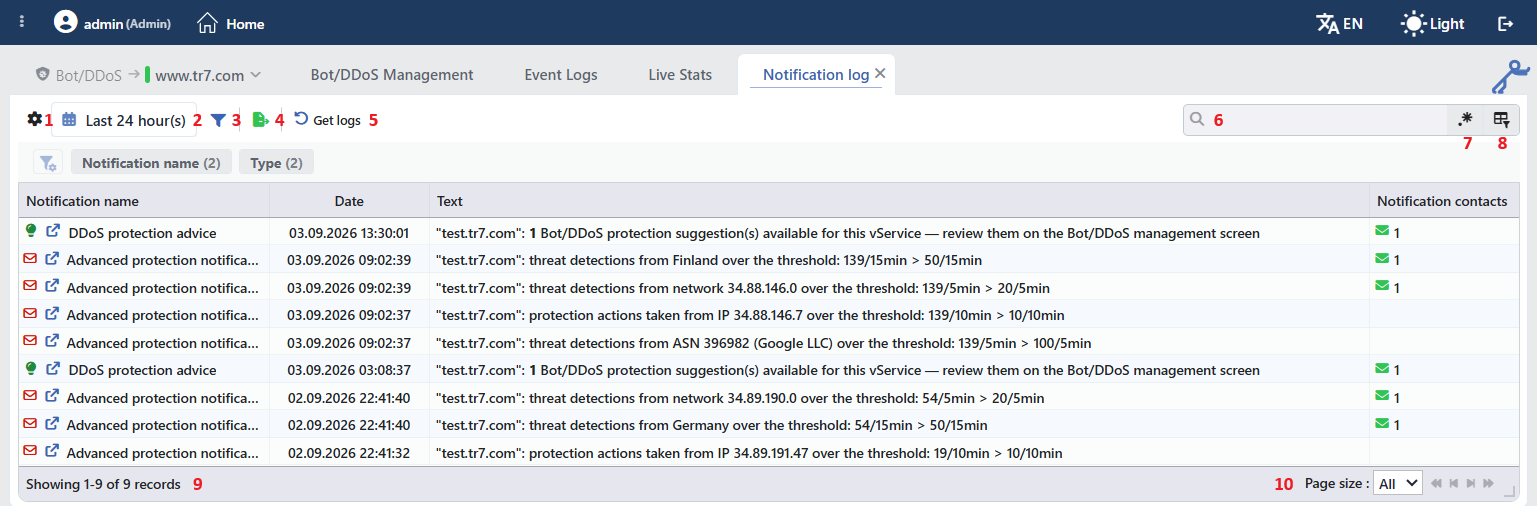 Notification Log Tab
The table opens with the following columns by default:
| Column | Description |
|---|---|
| Notification Name | The type of the notification. The names that can arise from this screen are Threat Protection State, Advanced Protection Notification and DDoS Protection Advice. The column has its own multiple selection filter. |
| Date | The time at which the notification has been produced. |
| Source (only in a cluster) | The name of the TR7 device that produces the record. |
| Text | The text of the notification. The text is kept untranslated in the record and is translated at the moment of display: the same record is displayed to every user in their own interface language. |
| Notification Contacts | The result of the transmission. For every sending an envelope or message icon and the number of recipients are displayed; it is green if the sending is successful and red if it has failed. When it is hovered over, the recipients, the error message if there is one and the text transmitted are displayed. Only the e-mail and SMS channels are located in this column: the SNMP and interface notifications are not displayed here. |
The colored icon at the beginning of the rows shows the type of the notification: red means an alarm, green a return to normal and neutral information. The external link icon next to it is present only if the notification has a resolvable target and leads to the related screen: the state band and the advanced notifications go to the Bot/DDoS dashboard of the vService, and the recommendation notification goes to the Bot/DDoS Management tab.
INFO
This log is the same as the general notification log on the Settings screen and is only its version filtered to this vService. The filtering is done on the interface side: the server returns all the notification records of the device and the vService filter is applied during the listing.
The items in the toolbar are arranged from left to right in the following order; the last two items (Page Information and Page Size) are located in the information strip below the table.
Columns
Which columns are shown in the table is selected. In the same panel, columns are reordered by dragging and alignment is selected per column; the row height is fitted to the page with the Fit rows to the page button, and the column layout is reset to default with the Reset button. The layout is stored per user and is shared with the notification log on the Settings screen.
Date Range
The time range that the query will cover is determined with the date range picker in the toolbar. The default range is the last 24 hours.
Filter
The Filter button is used to filter the list. In the chip strip there are the Notification Name and Type filters; both of them are multiple selection and the number of active selections is written next to the chip. The values of the Type filter are Alarming, Info and OK.
Export
The table is exported as Excel, CSV or PDF by clicking the Export button. In the window that opens, the Filename, Format and Data Source, together with the Columns to be exported, are determined; the remaining fields are displayed according to the format: CSV Separator for CSV, Excel Sheet Name for Excel, and Page Orientation and Page Size for PDF.
Get Logs
The records in the selected date range are brought again by clicking the Get Logs button. While the operation is going on, the icon spins and the button becomes passive.
Search
Used to search all information in the table.
RegExp Search
Used to search all information in the table with a regular expression (RegExp).
Column Based Search
Used to perform a column-based search on the information in the table.
Page Information
Contains information about the total number of fetched records and the range of records displayed in the list: Showing N-M of T records. Since the rows cannot be selected on this screen, the number of selected rows is not shown.
Page Size
The maximum number of records to be displayed on the page is selected: 5, 10, 20, 50, 100, 200, 500 or All, which shows all of them on a single page. The default value is All: all the fetched records are listed on a single page. The selection is not stored.
On this screen the rows cannot be selected; there is no right-click menu and no preview panel for the rows.
Scope and Limits
INFO
- The settings are kept per vService. The notification block stands above the three protections, at the module level; it does not belong to a protection.
- The card is present on both vService types. On L7 TCP the triggers of the Requests count type and the triggers in the Host Header scope are kept in the record, but their counters are not created.
- The number of advanced triggers is limited to six. The limit comes from the counter table budget in the data plane.
- The thresholds do not go below the base value. The edit window does not accept a value below the base; a value below the base that comes over REST or CLI, on the other hand, is raised to the base and the raised threshold is written in the notification text.
- The repeat notification and the normalization threshold cannot be adjusted. The repeat interval is six times the window and is limited to between 30 minutes and 2 hours; the alarm closes when it falls below 80 percent of the threshold.
- The advanced notifications do not enter the alarm strip. These notifications go to the log and to the channels, but they are not gathered in the ongoing alarms strip of the interface and are not included in the daily alarm repeat. The state band notification and the recommendation summary, on the other hand, enter the alarm strip.
- In a cluster installation only the first device produces the notification. When the cluster connection is broken, the second device also starts to produce. The record produced is copied to the peer device; the log screen lists the records of the two devices by combining them.
- A short silence period is applied after the device starts up. No notification is sent throughout this period; the temporary states that occur during the startup are not reflected to the operator.
- There is no row or size ceiling in the notification log. The query is limited only by the date range and a 60-second timeout. A query that times out does not return a partial result: the request results in an error and the records collected up to that moment are not used. A warning indicating this situation is not displayed on the screen either, the table stays empty.
- The pencil icon depends on the permission. The card and the log are displayed with read-only permission; the pencil icon that opens the edit window is displayed only on the users that have change permission.
