
Smarter by Design.Simpler for Business
GTM Logs
What Is GTM Logs?
GTM Logs is the central monitoring screen on which all the system and user events that take place in the TR7 GTM (Global Traffic Manager) infrastructure are recorded chronologically. The health check status changes, the scenario transitions, the DNS record status changes, the trigger actions, the data center access statuses and the user operations can be filtered and examined retrospectively over this screen.
The GTM infrastructure records automatically the decisions that the health check and scenario engine takes, the status transitions that affect the DNS answers and the access changes between the data centers. In this way, whether the disaster recovery (DR) transitions in particular were triggered correctly, which data center went into/out of service and when, and the results of the trigger actions can be monitored retrospectively; the root cause of the DNS-based routing problems can be determined.
01 · InspectionThe health checkThe unhealthy ↔ healthy transition
02 · ScenarioThe scenario is evaluatedInactive → Active
03 · RecordThe DNS record statusOK → DR / Fail-Safe / No Records
04 · TriggerThe trigger action runsThe webhook / API call and its result
05 · RecordIt is written to the GTM logThe events and the user operations
HC & Scenario
Health transitions
The health check and scenario activations
DNS Record
Record status
OK · DR · Fail-Safe · No Records
Data Center
Access status
Internet / WAN / LAN access
Trigger & Action
Action
The trigger actions and the user operations
Forwarding to an external system (SIEM)
The GTM logs can also be forwarded to an external Syslog server or to a SIEM system with Log Forwarding (Log Sources → GTM Logs).
GTM Log Event Types
The event types displayed in the Log Type column in the GTM logs:
| Event Type | Key | When it is recorded |
|---|---|---|
| Health check status | hcStateChange | When the health check status changes (healthy ↔ unhealthy) |
| Health scenario status | hcScenarioChange | On the activation/deactivation transitions of the health scenario |
| Record state | recordState | When the DNS record status changes (OK, DR, Fail-Safe, No Records) |
| Active&Backup domain status | abDomainChange | When the status changes at the domain name level in an Active/Backup structure |
| Active&Backup record status | abRecordChange | When the status changes at the record level in an Active/Backup structure |
| Active&Backup record type status | abRecordTypeChange | When the status changes at the record type level in an Active/Backup structure |
| Domain/record status | dynamicNodeChange | When the status of the dynamic node (domain/record) changes |
| Trigger action | triggerAction | When a trigger action is executed, and its result |
| Internet status | internetStatus | When the internet access status of the data center changes |
| Wan access status | wanAccessStatus | When the WAN access status of the data center changes |
| Lan status | lanAccessStatus | When the LAN access status of the data center changes |
| AXFR action | axfr | When an Express mode Zone Transfer (AXFR) operation takes place |
| User action | userAction | The manual operations performed by the user |
Operational Usage Recommendations
- Filtering should be done by narrowing the time range. In problem analysis the time range should be narrowed as much as possible; the wide ranges return thousands of records and make finding the related event difficult.
- The DR transitions should be verified over the log. In a disaster recovery transition, by following the Health check status → Health scenario status → Record state order in the logs, it should be verified that the transition worked correctly.
- The trigger action results should be checked. Whether the action was successful should be checked from the Trigger action event type; the failed triggers may indicate that the external systems are unreachable.
- The data center access interruptions should be monitored. By checking the Wan access status and Lan status events regularly, the connection problems between the data centers should be detected early.
GTM Logs Listing Screen
By following the path Settings → System Logs → GTM Logs, the GTM logs on the TR7 device are listed. The menu entry appears only on the users who have GTM authorization and the screen requires a GTM license.
The list merges two sources: the GTM event logs and the user operations labeled gtm (with the User action event type) are sorted by date in a single list; Log Limit is applied to the total of the merged list.
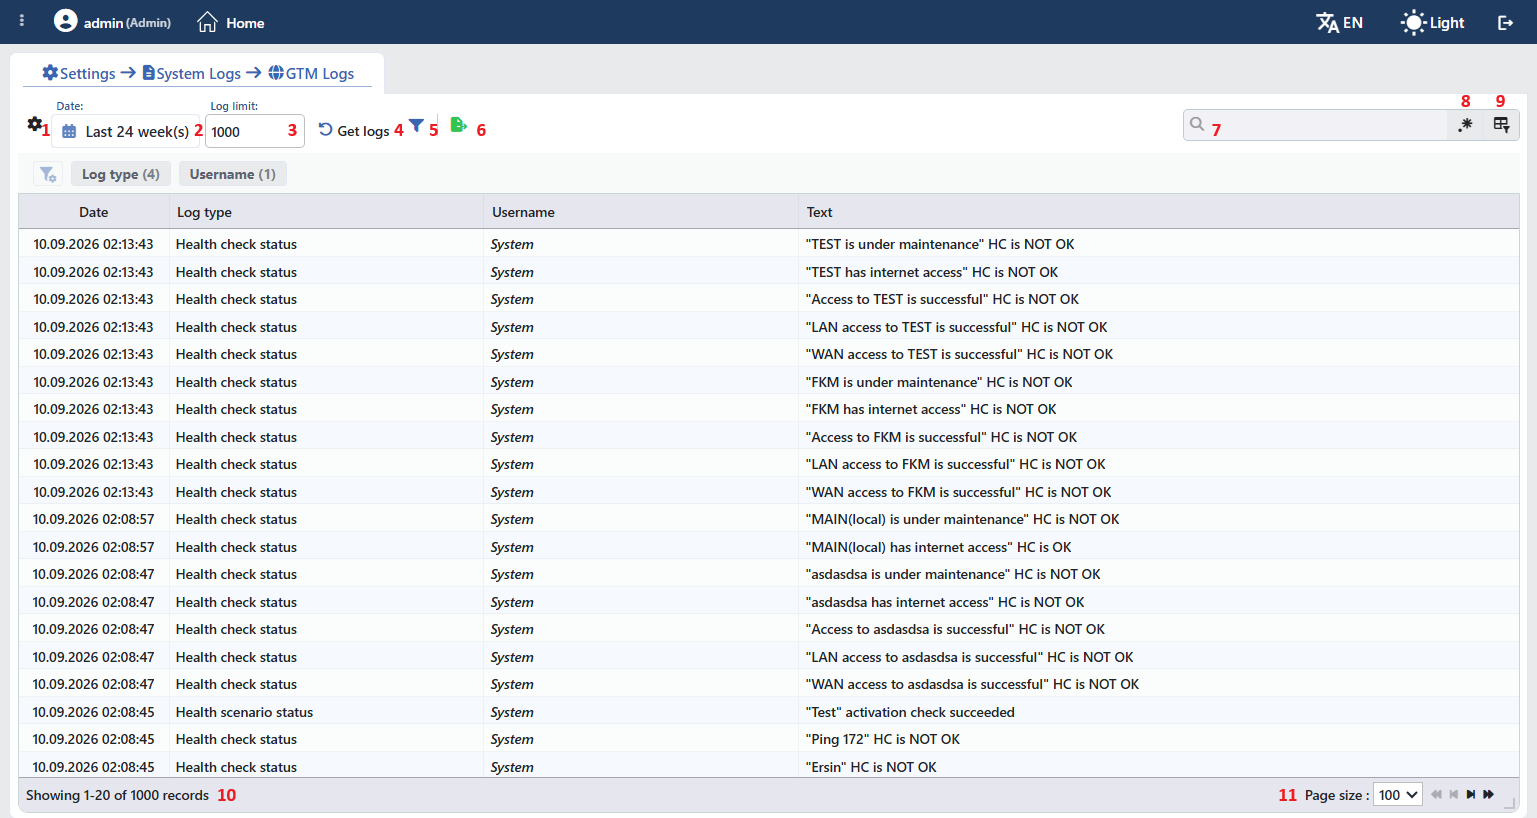 The GTM Logs Listing Screen
The table opens with the following columns by default:
| Column | Description |
|---|---|
| Date | The date and time the event occurred. |
| Log Type | The event type (Health check status, Health scenario status, User action, etc.). |
| Username | The name of the user who performed the operation. On the system-originated events, System is written and the cell comes in italics. |
| Text | The description text of the event; on the health check records the check name is written in quotation marks together with its result (HC is OK / HC is NOT OK). |
The Source column is displayed only in a cluster setup; it shows on which device the event was generated.
The items in the toolbar are arranged from left to right in the following order; the last two items (Page Information and Page Size) are located in the information strip below the table.
Columns
Which columns will be shown in the table is selected. In the same panel the columns are reordered by dragging, the alignment is selected per column, a manually set column width is returned to automatic sizing by clicking, and with the Reset button the column layout is returned to the default. The layout is stored per user.
Time Range
The time range for which the logs will be displayed is selected. The predefined ranges (5 min – 1 month), Custom Duration or Custom Date Range can be used. Default: The last 24 hours; the selection is saved to the user account.
Log Limit
The maximum number of logs to be fetched is entered. Default value: 1000 records; the selection is saved to the user account. The limit is applied to the combined total of the GTM events and the user operations.
Get Logs
It loads the logs from the server according to the selected time range and limit value. By clicking the Get Logs button, the logs are fetched. The logs are not updated automatically; in order to see the new logs, the button must be clicked again.
Filter
The Filter button is used to filter the logs shown in the list according to certain criteria. The criteria offered: Log Type (the event type), Username and (in a cluster) Source. The filtering view can be customized: which filters will be shown can be selected, their order can be changed and the layout is saved to the user account.
Export
By clicking the Export button, the table is exported as Excel, CSV or PDF according to the desired data columns.
Search
Used to search all information in the table.
RegExp Search
Used to search all information in the table with a regular expression (RegExp).
Column Based Search
Used to perform a column-based search on the information in the table.
Page Information
Information about the total number of GTM logs and the range of records displayed in the list takes place.
Page Size
The maximum number of records to be displayed on the page is selected. The arrow icons are used to navigate between the pages.
