
Smarter by Design.Simpler for Business
Load Balancer - ADC Data Flow Panel
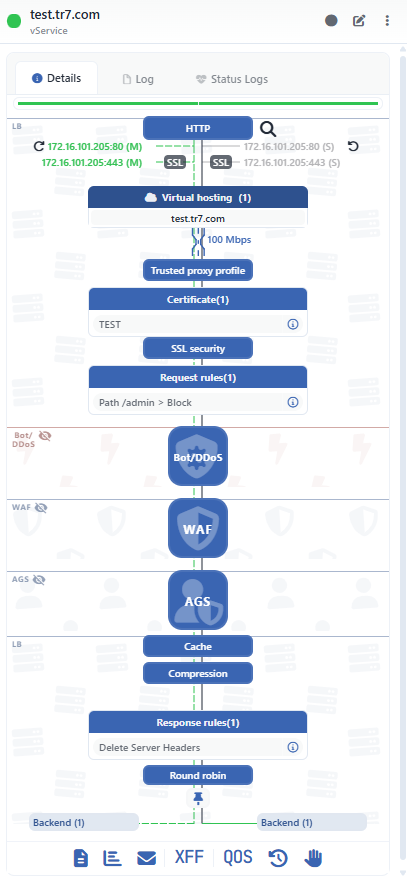
Load Balancer - ADC Data Flow Panel turns the whole configuration of a vService into a single live request flow diagram. The path on which the traffic enters from the listener addresses and reaches the Backend Services by passing through the certificates, the rules, the security modules and the distribution algorithm is read on a single screen and at a single glance, without navigating page by page.
A complex application delivery configuration is no longer a setting list but a readable journey: what is defined, what is running and where the traffic passes are seen in the same picture. In order to change a setting, it is not necessary to leave the screen either; clicking the box in the diagram is enough.
Where is it located?
The panel stays open on the right of the Dashboard and Load Balancer Management tabs on the management screen of a vService. It is collapsed and expanded; its width and its state are remembered per user. For the detailed technical description, see Load Balancer vServices › Dashboard.
One Glance
The end-to-end path
The whole request path from the listener to the Backend Service in a single diagram
Live
Instant configuration
Every element in the diagram reflects the configuration and the working status at that moment
Dynamic
Only what is defined
An element that is not defined is not drawn; the diagram builds itself according to every vService
3 Modules
Security strips
If Bot/DDoS, WAF and AGS are enabled, they appear within the flow with their own strips
One Click
Passing to editing
When the box is clicked, the summary opens; it is edited with the pencil, and its page is reached with Go to Page
Cluster
Two devices side by side
In a cluster, the listeners and the Backend Services are shown separately per device
 Load Balancer - ADC Data Flow Panel
Why Is It Important?
| The classic approach | With the Load Balancer - ADC Data Flow Panel |
|---|---|
| In order to understand what a vService does, the certificate, rule, profile and Backend Service screens are opened one by one. | The whole configuration is read in a single diagram, in the order that the traffic follows. |
| Which feature is really defined is searched for on the setting screens. | The diagram draws only the defined elements; every box that is seen really exists on that vService. |
| At the moment of a failure, whether the listener or the Backend Service is the problem is compared from separate screens. | The listeners and the Backend Services are in the same picture with their status colors; the place of the interruption is seen immediately. |
| In order to correct a setting, it is necessary to navigate in the menu. | The box is clicked, the summary is read, and it is edited with the pencil in the same place. |
What Does the Diagram Describe?
01 · EntryThe type and the listenersThe vService type, the listener addresses, the SSL / HTTP/3 badges, the virtual domain names
02 · The Request PathTrust and rulesThe bandwidth limit, Trusted Proxy, the certificates, TLS security, the request rules
03 · SecurityThe module stripsThe enabled Bot/DDoS, WAF and AGS layers; the summary or the detailed view
04 · Response and DistributionThe algorithm and the conditionsThe cache, the compression, the response rules, the distribution algorithm, persistence, the conditional branches
05 · The TargetThe Backend ServicesThe Backend Services and their groups, the backup services, the TLS connection, the health status
The setting strip under the diagram does not overlook the settings that do not have a box on the traffic path either: the log, report, notification, timeout and vService limits profiles together with the X-Forwarded-For and QOS status are summarized with a single row of icons; a setting that is not defined appears faded.
Highlights
A live path with status colorsThe listener addresses and the Backend Services carry the color of their working statuses; a path that is up is drawn with a flowing line and one that has stopped with a straight line.
A self-building diagramIf a certificate, a cache or a request rule is not defined, that box is not drawn at all; every vService carries its own diagram.
The security layers within the flowThe Bot/DDoS, WAF and AGS strips are placed in the order in which the traffic really passes; it is switched between the summary and the detailed view with the eye icon.
Editing from the diagramFrom the summary window that opens when the box is clicked, it is possible to pass to editing with the pencil and to the record’s own page with Go to Page.
Address copying and fast accessThe listener address is taken to the clipboard with a single click; on the HTTP and HTTPS listeners, the full link form is copied.
Cluster awarenessIn cluster setups, the listeners and the Backend Services of the two devices are shown side by side, with master / slave marks.
The distribution decision is visibleThe algorithm, the persistence method and the conditional Backend Service branches are read in the diagram, together with the condition sentence of the branch.
The status and the history in the same panelThe Log and Status Logs tabs in the panel list who changed what and the status transitions of the vService.
Who Is It For?
The operations team Fast diagnosis
When a vService does not respond, the status of the listener, the security layer or the Backend Service is seen in the same picture; the failure point is found within seconds, not minutes.
Change and audit Verification
After a change, it is verified from the diagram that the certificate, the rule or the profile has really taken its place; who changed what is on the Log tab of the same panel.
Architecture and management An understandable structure
The application delivery structure is explained with a single drawing to non-technical stakeholders as well; behind which security layers which application stands is seen clearly.
The Detailed Technical Description
Dashboard › Load Balancer - ADC Data Flow Panel
Every element in the diagram, its display condition, the panel title, its tabs and the lower setting strip.
→
Load Balancer Management
The second tab that the panel accompanies: the summary of the vService configuration with sentences.
→
vService
The form on which the listener, certificate, profile and distribution settings seen in the diagram are defined.
→
Load Balancer - ADC
The general introduction of the module, its building blocks and the setup flow.
→
