
Smarter by Design.Simpler for Business
WAF - WAAP Data Flow Panel
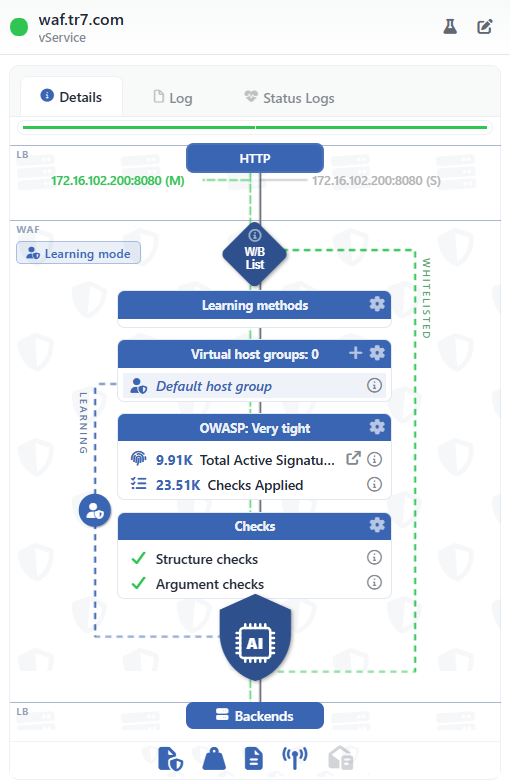
WAF - WAAP Data Flow Panel describes the web application security of a vService in a single live diagram. The path on which the request enters from the whitelist gate and ends at the decision node by passing through the learning methods, the host groups, the OWASP protection level and the checks is seen at a single glance, together with the points at which the blocked, the monitored and the clean traffic separate.
The era of the web application firewall being a "black box" ends: which protection is on, in which mode the WAF works and which path a request will pass through are not searched for on the setting screens but are read from the diagram.
Where is it located?
The panel stays open on the right of the Dashboard and WAF Management tabs on the management screen of a WAF-protected vService. For the detailed technical description, see WAF-Protected vServices › Dashboard.
One Glance
The end-to-end protection path
The whole WAF path from the whitelist gate to the decision node and the Backend Services
3 Modes
Learning · Monitor · Blocking
The WAF mode appears with a colored badge at the beginning of the strip
AI
The decision node
Every request that passes the checks ends at the decision point with the artificial intelligence icon
3 Results
Blocked · Clean · Monitor
The blocked, the clean and the monitored traffic are separated with different strips
2 Paths
Whitelisted · Learning
The separate paths of the exempt traffic and of the traffic within the scope of learning are drawn in the diagram
One Click
Passing to the setting
With the gear icons of the cards, the related WAF setting is reached directly
 WAF - WAAP Data Flow Panel
Why Is It Important?
| The classic approach | With the WAF - WAAP Data Flow Panel |
|---|---|
| In which mode the WAF works and which learning methods are on are collected from separate screens. | The mode badge, the learning methods, the host groups and the protection level stand side by side in a single diagram. |
| It is not known that the traffic caught by the whitelist or in learning skips the checking. | The WHITELISTED and LEARNING paths are drawn separately in the diagram; which traffic does not enter the checking is seen clearly. |
| Whether a request will be blocked or not is guessed. | The result strips under the decision node show which results the configuration can produce. |
| The number of active signatures and the applied checks are searched for on the report screens. | The OWASP card shows the number of active signatures and the number of checks applied to the engine directly. |
What Does the Diagram Describe?
01 · EntryThe listenersThe vService type, the listener addresses and the SSL / HTTP/3 badges
02 · The GateW/B ListThe traffic that matches the whitelist separates to its own path by skipping the checking
03 · The CheckingThe WAF cardsThe learning methods, the host groups, the OWASP level, the basic checks
04 · The DecisionThe AI nodeThe Blocked, Clean and Monitor / Teacher results on separate strips
05 · The TargetBackendsThe clean and the monitored traffic reaches the Backend Services
The setting strip under the diagram also leads with a single click to the WAF settings that do not have a card on the traffic path: the blocking page, the request body limits, the log settings, the SIEM forwarding and the periodic reporting.
Highlights
The mode is visible at all timesIf all the host groups are in the same mode, the badge at the beginning of the strip shows the Learning, Monitor or Blocking mode with its own color.
The traffic that skips the checking is exposedThe traffic that matches the whitelist and the traffic within the scope of learning are drawn with separately colored paths; no blind spot remains.
The signature strength at a glanceThe OWASP card shows the selected protection level, the number of signatures active at this level and the number of checks applied to the engine; the rule list is reached with a single click.
The host groups in a single cardEvery Virtual Host Group is listed with its own mode icon; a new group is added directly from the card.
The learning methods are visibleWhich of Conditional Learning, Teacher and AI Learning are enabled is listed in the card.
A self-building diagramIf a whitelist is not defined, the WHITELISTED path is not drawn; a learning method that is off is not listed; as the mode changes, the result strips change as well.
A single click to the analysisWith the Analyze shortcut in the title of the panel, the analysis of the learned page types opens on the same screen.
A change history specific to the WAFThe Log tab in the panel lists only the changes labeled WAF; Status Logs shows the status transitions.
Who Is It For?
The security team The protection status
In which mode an application is protected, which traffic is kept exempt from the checking and which signature level is applied are verified in a single diagram.
The transition from learning to blocking Putting into service
While passing from the Learning mode to the Blocking mode, how the diagram changes is followed; the moment when the learning path closes and the blocking strip appears is seen.
Audit and compliance Evidence
That the OWASP protection of the application is enabled, which checks are applied and who made a change and when are shown from the same panel.
The Detailed Technical Description
Dashboard › WAF - WAAP Data Flow Panel
Every card in the diagram, the flow paths, the decision node, the panel title and the lower setting strip.
→
WAF Management
The tab on which the mode, the rule set, the checking and the learning settings seen in the diagram are managed.
→
WAF Mode
The behavior of the Learning, Monitor and Blocking modes.
→
WAF - WAAP
The general introduction of the module, the hybrid security model and the protection strength.
→
