
Smarter by Design.Simpler for Business
Live Stats
What Is Live Stats?
Live Stats is the tab that shows the current state of a vService whose Bot/DDoS protection is enabled on a dashboard that refreshes once a second. The health of the traffic engine that carries the vService, the outcome distribution of the three protections, the band distribution of the bot scores, which detection factors and which limit rules are triggered, the load per source address and the countries from which the traffic comes are monitored live on a single screen.
The screen answers the question "what is happening right now?". When an attack wave starts, the rise of the enforcement boxes, which rule is triggered, into which band the scores shift and how many different addresses produce the load are seen at the same time. When the value of a card changes, the card flashes with a short highlight and a direction arrow is put next to the value; an increasing metric is shown with a green arrow and a decreasing one with a red arrow. The arrow disappears by itself after approximately one and a half seconds.
The live monitoring runs on the device itself: the data is read directly from the traffic engine, and no external collector, agent or analytics product is needed. The stream is established only while the screen is open; when another tab is switched to or the session is closed, the subscription is terminated.
1 s
Live Refresh
The data is refreshed once a second; the interval is selected as 1, 5, 10 or 30 seconds
7 Sections
On a Single Screen
The frontend, the protection outcomes, the bot bands, the distribution tables, the quarantine, the source statistics and the live traffic
15
Outcome Cards
Four aggregators, three protection lenses and eight enforcement cards
46 + 25 + 10
Distribution Rows
The detection factors, the reputation categories and the limit rules are listed completely
4 Bands
Bot Score
Clean · Suspicious · Bot · Bad Bot are monitored with per-second rates
10 s
Source IP Window
The number of active addresses, the peak and the percentile values are measured in a ten-second window
Map
Live Traffic
The country distribution of the traffic and the twenty source addresses that produce the most load at that moment
Cluster
A Dashboard Per Device
In a cluster setup, the data of each device is shown in its own column, without being mixed
Built-in
It Does Not Require an Agent
The data is read directly from the traffic engine; an external collector is not needed
Live Stats or Dashboard
The two screens use the same vocabulary but answer different questions. Live Stats shows the instantaneous state: the data is not stored, a time range is not selected, and what is seen on the screen is always "right now". Dashboard, on the other hand, spreads the same metrics over time and archives them: the retrospective trend and comparison are read from there.
Accessing Live Stats
- Left Monitor Panel is opened.
- Bot/DDoS Protected vServices is selected from the category tabs at the top left.
- The vServices defined on TR7 that have the Bot/DDoS protection enabled are listed.
- The vService to be monitored is clicked; the screen opens with the Dashboard tab that carries the vService's name.
- On the screen that opens, the Live Stats tab is clicked.
The tab is displayed to the users that have monitoring permission in the Load Balancer area and is always located there independently of the protection configuration. The moment the screen is opened, the live stream starts and the first data comes without waiting.
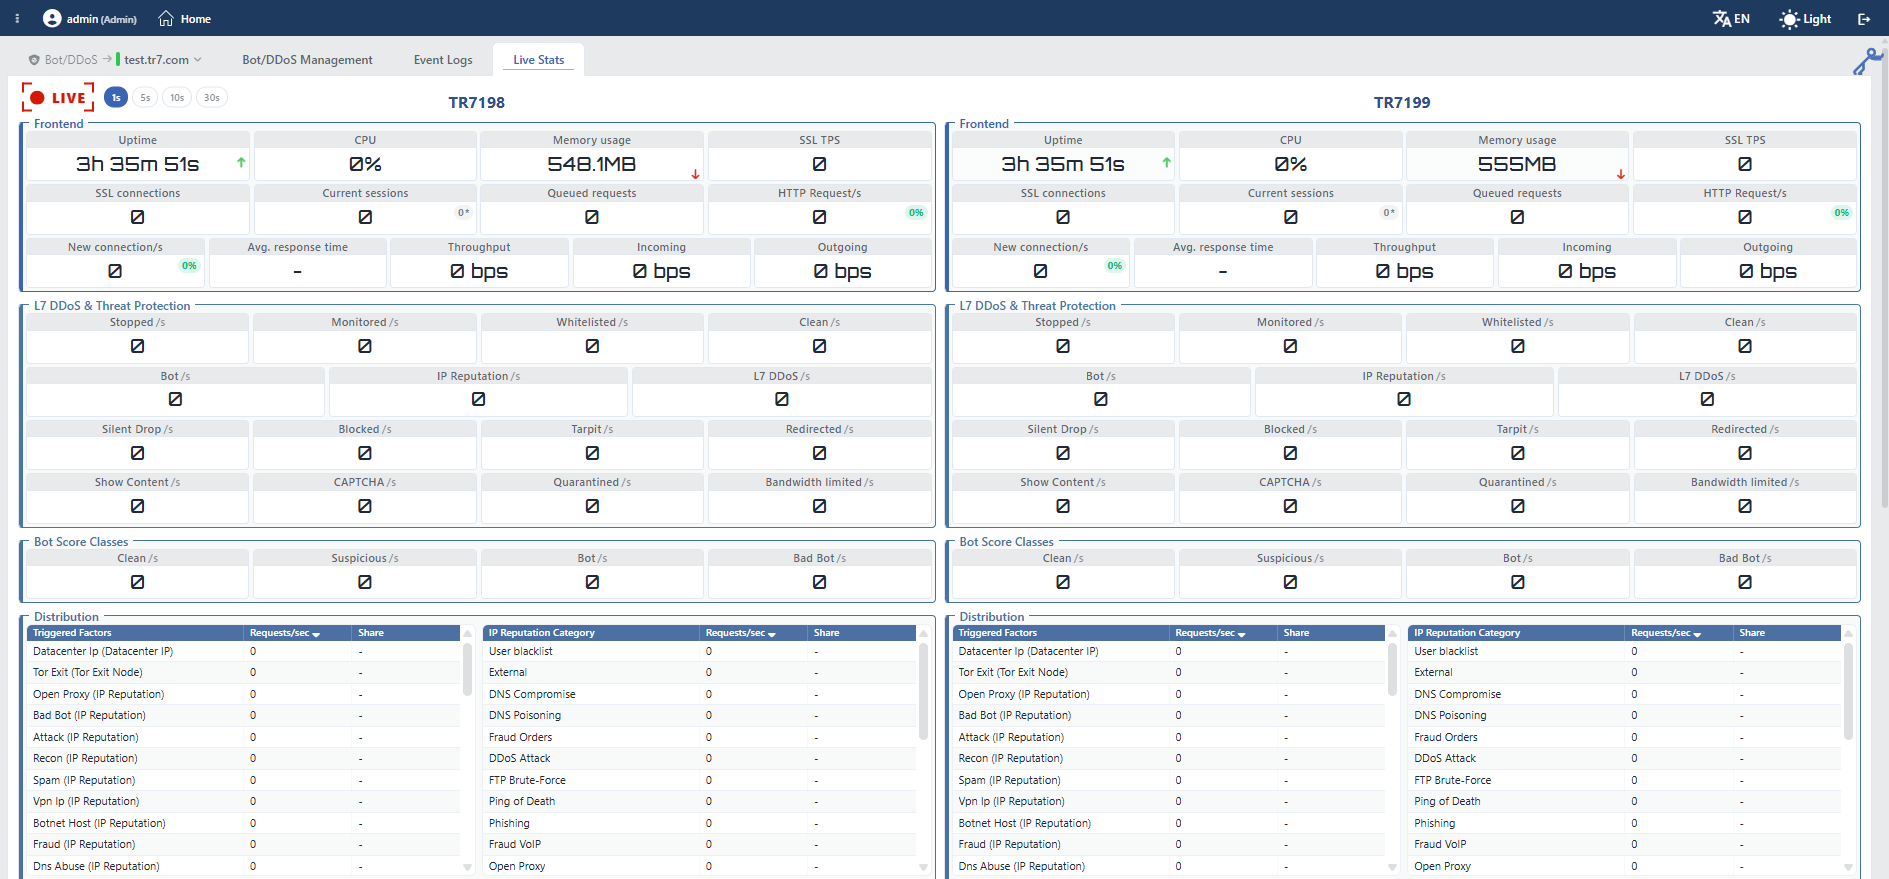 Bot/DDoS Live Stats
Screen Controls
There are two controls at the top left of the dashboard:
- The LIVE indicator stops and restarts the stream. The indicator takes four states: a dim circle while not subscribed, a spinning wait sign while subscribed but before the first data has arrived, a circle that beats like a pulse while data is flowing, and a stop sign when five seconds have passed since the last update.
- With the 1s, 5s, 10s and 30s chips next to it, the refresh interval is selected; the default value is 1 second. The selection is stored per user and is preserved in the following sessions. The preference is kept separately according to the vService type: the HTTP and L7 TCP vServices share one preference and the Network (L4) vServices a separate one. On Network vServices, since the counters cannot be refreshed once a second, the interval does not go below 5 seconds; the 1 second chip stays visible but is ineffective. When the interval is changed, the stream is established again with a short interruption; during this the rates are read as zero once.
In a cluster installation the dashboard shows every section in a separate column per device and the device names are located above the columns; in a single installation a column title is not written. The values are not totaled between the devices: every device takes its own data from its own socket and shows only the traffic that passes over itself. When the peer device cannot be reached, the column of that device does not leave the screen; the cards read - or 0 and a warning is not displayed on the screen in addition.
Duration of the live stream
A live stream session lasts about 30 minutes; since the duration check runs once per minute, the stream ends by itself between 30 and 31 minutes. The values on the screen stay as they were last read and are not refreshed.
The end is not reported by the server: the indicator continues to appear active, only the pulse stops and the icon turns into the stop sign. If monitoring is to continue, the page must be refreshed, or the LIVE indicator must first be turned off and then turned on again. Changing the refresh interval also re-establishes the stream and restarts this duration.
Frontend
In the section the instantaneous state of the traffic engine and the frontend of the vService is summarized as cards. None of the cards shows the device as a whole; the system cards also belong only to the own traffic engine of that vService.
| Card | What it shows |
|---|---|
| Uptime | The uninterrupted working period of the traffic engine. |
| CPU | The instantaneous processor utilization (%) of the vService's traffic engine. |
| Memory Usage | The instantaneous memory usage of the vService's traffic engine. |
| SSL TPS | The number of TLS handshakes per second. It is displayed only if at least one of the frontend addresses terminates TLS. |
| SSL Connections | The number of open TLS connections. It depends on the same condition. |
| Current Sessions | The number of client sessions open at that moment. In the tooltip the peak value and the defined upper limit are displayed. On HTTP vServices it also carries a badge: the number of requests continuing to the Backend Services at that moment. |
| Queued Requests | The number of requests taken into the queue. |
| HTTP Request/s | The number of HTTP requests per second. On L7 TCP vServices the place of this card is taken by Rate Max. |
| New Connection/s | The number of new connections established per second. |
| Avg. Response Time | The average response time. It is present only on HTTP vServices; in the tooltip the highest value seen is written. |
| Throughput | The total data flow rate. |
| Incoming · Outgoing | The incoming and outgoing data rate. If compression is defined, next to these two cards there are also cards that compare the volume before and after the compression. |
| Cache | The hit and miss counters displayed if a cache is defined. |
The percentage badges show the fullness of the limit
At the top right of some cards there is a colored percentage badge. The badge is the ratio of the measured value to the soft limit of the related L7 DDoS block; its color is determined according to this fullness and shifts towards red as the ratio rises. In the tooltip the limit, the hard ceiling, the measurement window and the working mode of the protection are written.
The badge does not mean that that block is on: on the card of a block that is off, a badge calculated over the default limit also appears. Whether the block really works or not is read from the mode information (Off / Monitor / Active) in the tooltip.
L7 DDoS & Threat Protection
The section shows the per-second distribution of the decisions that the three protections give. Fifteen cards are gathered in three sets.
The aggregator cards summarize how the traffic is divided:
| Card | Meaning |
|---|---|
| Stopped /s | The total of the requests that undergo an enforcement. |
| Monitored /s | The requests that are evaluated in the monitoring mode and that do not undergo an enforcement. |
| Whitelisted /s | The requests that are let through because they match the exemption definition or because they are a verified bot. |
| Clean /s | The requests that do not enter any of the above. |
The protection lenses show which protection gives the decision: Bot /s, IP Reputation /s and L7 DDoS /s. Every lens totals the own seven enforcement outcomes and the own monitoring stamps of that protection.
The enforcement cards give one by one which action has been applied: Silent Drop /s, Blocked /s, Tarpit /s, Redirected /s, Show Content /s, CAPTCHA /s, Quarantined /s and Bandwidth Limited /s.
The bandwidth limiting counting is kept only in the own band of the L7 DDoS lens; the Bandwidth Limited /s card, on the other hand, stays at zero because it reads from the aggregator band. The bandwidth limitings applied are monitored from the Event Logs screen and from the breakdown in the tooltip of the L7 DDoS lens.
What must be paid attention to when the cards are totaled
- The four aggregator cards are a disjoint partition. Every request is counted in only one of them; the total of the four gives the whole of the traffic evaluated. The own auxiliary requests of the challenge page are not counted in any card, for this reason the total of the four can stay below the number of requests in the Frontend section.
- Stopped is the total of seven of the eight enforcement cards. Bandwidth Limited is not included in this total: since bandwidth limiting is an overlay that does not terminate the request, it is outside the disjoint partition and the same request can also be counted in another bucket.
- The three protection lenses cannot be totaled. The bands overlap: if two protections have objected to the same request, the counter of both of them increases. The total of these three cards can be greater than the total of Stopped and Monitored; which protection applied the decision is read only from the aggregator cards.
- The protection lenses count the monitoring besides the enforcement. Every lens adds its own monitoring stamps to the seven enforcement outcomes of that protection; for this reason a protection in the monitoring mode also produces a number on these cards. The requests that are let through, that get an exemption and that are verified bots do not enter the lens.
The breakdown tooltip is present only on the cards that total more than one component: Stopped, Whitelisted and the three protection lenses. Since Monitored and Clean read a single counter, they do not have breakdowns.
Bot Score Classes
The section gives the band distribution of the calculated bot scores with per-second rates.
| Card | Score range |
|---|---|
| Clean /s | 0–39 |
| Suspicious /s | 40–59 |
| Bot /s | 60–84 |
| Bad Bot /s | 85–100 |
These four cards count requests and are a disjoint partition. The section is displayed even if Bot Protection is off; in that case all four cards read zero.
Distribution
The section gathers three tables in a single frame. The tables do not carry separate titles; they take their identity from the first column headings. When the screen stays narrow, the third table shifts to the lower row and appears as a separate panel.
Every table is located there only if the counter table behind it has been set up. A dimension that has no source makes itself felt not as a table full of zeros but by not appearing at all.
| Table | What it lists | Number of rows |
|---|---|---|
| Triggered Factors | The detection factors that produce the bot score | 46 |
| IP Reputation Category | The categories in the reputation database | 25 |
| DDoS Rule | The L7 DDoS limit rules | 10 |
All three tables carry the same three columns: the first column that names the row, and Requests/sec and Share. The lists are complete: the rows that are not triggered at all at that moment also stay in the list with the value zero, so the ordering stays fixed and the comparison becomes easier. The ordering is changed by clicking the column heading; the tables are in descending order according to the rate by default.
The Share column shows the live mix
Share is the ratio of a row to the total rate in that table; it is not a cumulative share. If all the rows in the table are zero, 0% is not written in the column but - is.
The Triggered Factors table counts factor triggerings, not requests: since a single request can trigger more than one factor, the total of the rows can exceed the number of requests per second. Bot Score Classes, on the other hand, counts requests; the two sections are therefore not compared directly.
In the Triggered Factors rows, next to the factor name, the parent factor family is written in parentheses (such as Open Proxy (IP Reputation)). The parentheses are printed only when the factor has a family separate from itself; the factors that stand alone are listed with their names. This family is the group in the bot scoring tree; it must not be confused with the IP Reputation Category table on the same screen. The second one counts the category in which the address is recorded in the reputation lists.
The ten rows of the DDoS Rule table correspond to the limit blocks: Source IP Request Rate, Source IP Connection Rate, Source IP Error Rate, Total Request Rate, Total Connection Rate, Active Source Count, Country Rules, Network Type Rules, Hard Ceiling (Requests) and Hard Ceiling (Connections). The country and network type rules are gathered in a single row: independently of how many rules are defined, the triggerings of all of them are written to the same row. The rule-based detail is read from the Event Logs screen.
The conditions of the tables are different from each other
The counters of the three tables do not depend on the same condition:
| Table | When the counters work |
|---|---|
| Triggered Factors | While Bot Protection is in the Active or the Monitor mode. While the protection is Off, the table is not located there. |
| IP Reputation Category | While IP Reputation Protection is in the Active or the Monitor mode. While the protection is Off, the table is not located there. |
| DDoS Rule | Only while L7 DDoS Protection is in the Active mode. The table is not located there either while the protection is in the monitoring mode or while it is off. |
That is, the monitoring mode feeds the first two tables and does not feed the third one: while L7 DDoS Protection is in the monitoring mode, which limit is triggered is read not from this screen but from the Event Logs screen.
In the lower half of the dashboard the quarantine, the source address statistics and the live traffic sections are located respectively.
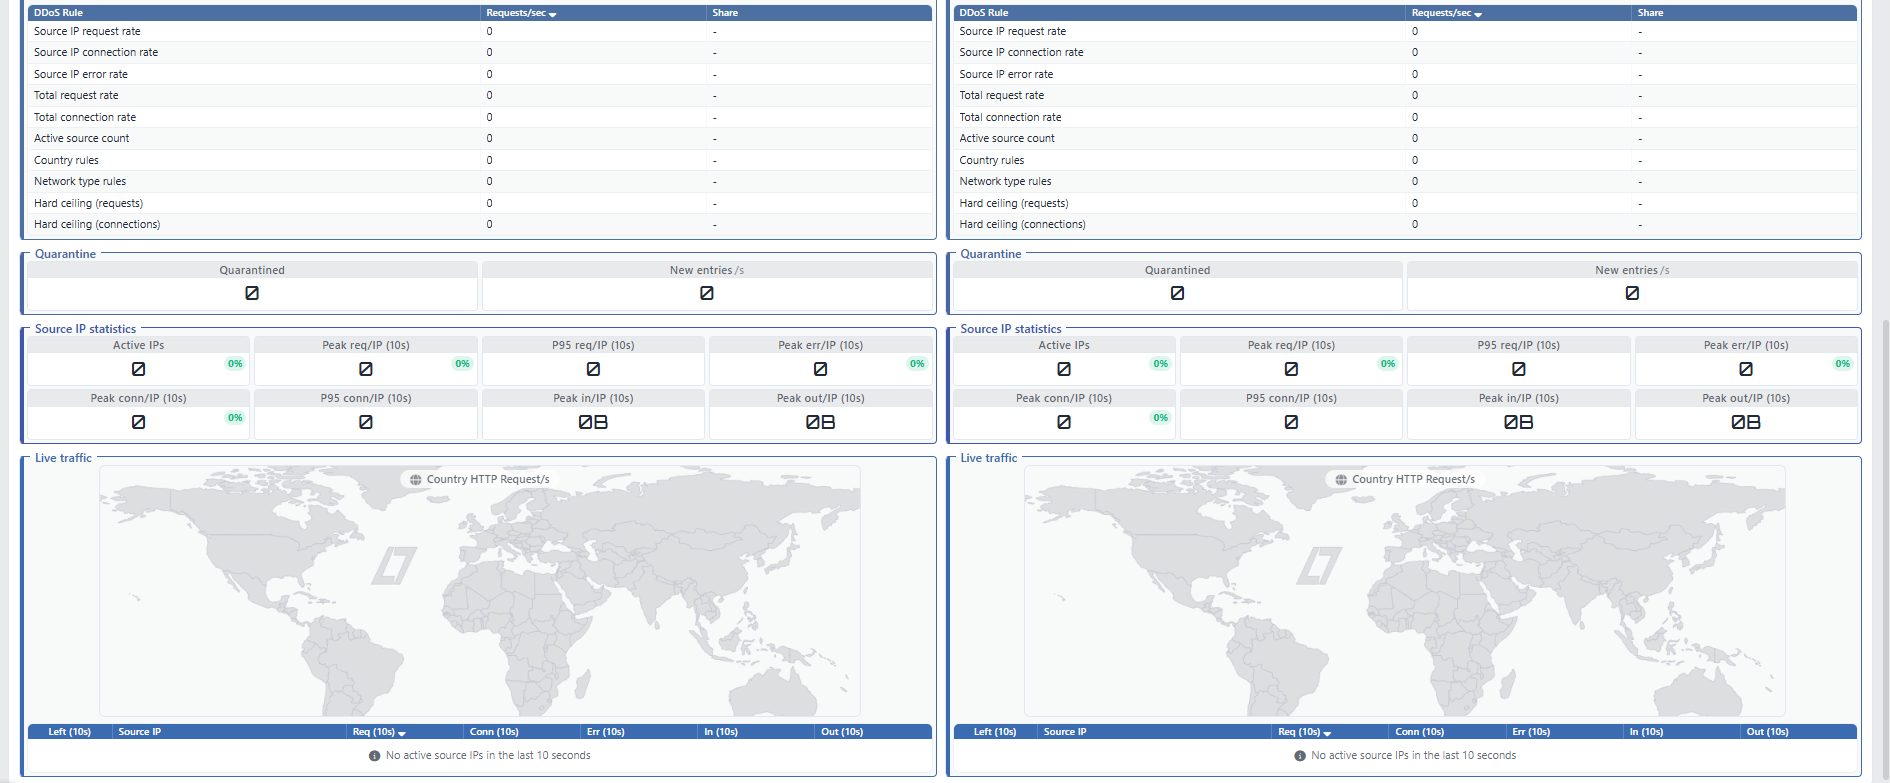 Bot/DDoS Live Stats - The Lower Half of the Dashboard
Quarantine
The section carries two cards:
| Card | What it shows |
|---|---|
| Quarantined | The number of records that are in the penalty box at that moment. It is not a rate but the instantaneous fullness. |
| New entries /s | The number of requests that come per second from an actor in the penalty box. |
"New entries" does not count the entries into the box
In spite of its name, this card does not show how many new actors are added to the box per second: it counts every request that comes from the actors in the box. The same counter also feeds the Quarantined /s card in the L7 DDoS & Threat Protection section, for this reason the two cards always show the same value.
How many new records have entered the box is not located on any card on the dashboard. The entries into the penalty box are monitored from the Event Logs screen. The Quarantined card in this section, on the other hand, shows the fullness of the box: it says how many records are inside.
The section is seen only when the penalty box is set up
The penalty box is a single box that the three protections use in common; the box is set up by any one of four configurations:
- If there is a row with the
Quarantineaction in the Bot Protection rule list, - If there is a row with the
Quarantineaction in the IP Reputation Protection rule list, - If the L7 DDoS Protection hard ceiling is defined in such a way that it takes into quarantine,
- If the quarantine for the failed attempts is on on the Captcha card.
All four require that the related protection is in the Active mode: a protection in the monitoring mode does not set up the box. If none of them is valid, this section is not located on the screen. Because of which protection an actor has fallen into the box is kept in the own record of the box and is read from the Event Logs screen.
Depending on the configuration, next to this section two more sections can be located. The real order on the dashboard is in the form Captcha → Quarantine → Waiting Room: if the challenge is defined, the Captcha section is above the quarantine (the numbers of the challenges shown, solved and failed), and if the waiting room is defined, the Waiting Room section is below the quarantine (the number of visitors inside and in the queue together with the admission and queuing rates). The waiting room is present only on HTTP vServices.
Source IP Statistics
The section summarizes how the load is distributed among the source addresses in a ten-second window. These cards are not rates but raw counts within the window.
| Card | What it shows |
|---|---|
| Active IPs | The number of different addresses at least one of whose metrics is greater than zero in the window. |
| Peak Req/IP (10s) | The highest number of requests that a single address produces. |
| P95 Req/IP (10s) | The 95th percentile value of the number of requests. |
| Peak Err/IP (10s) | The highest number of errors that a single address receives. |
| Peak Conn/IP (10s) | The highest number of connections that a single address establishes. |
| P95 Conn/IP (10s) | The 95th percentile value of the number of connections. |
| Peak In/IP (10s) · Peak Out/IP (10s) | The highest amount of incoming and outgoing data that a single address produces. |
On L7 TCP vServices the three cards that measure requests and errors are not present; the section is located there with five cards.
The cards of this section also carry the same percentage badge as the Frontend cards: the badge shows the ratio of the measured value to the related source address limit.
Reading the peak and the percentile values
The Peak values are the real maximum. The P95 values, on the other hand, are estimates calculated from a scale-independent histogram; they carry approximately two percent relative error and must not be read as the exact percentile value.
Reading the two values together says the shape of the load: if the peak value is high but the percentile value is low, the load is being produced by a single address; if the two are close to each other, the load is spread to the base.
Live Traffic
In the section there is a world map and below it a live source address table.
The map shows the distribution of the traffic to the source countries with color intensity. Its title is Country HTTP Request/s on HTTP vServices and Country Connection/s on L7 TCP vServices. The map can be dragged and zoomed; the sources that cannot be shown on the map are summarized as chips below.
The map shows all the traffic
The map here is not an attack map: it distributes not the requests that the protections decide on but all the traffic that comes to the vService according to the countries. For the attack breakdown, Dashboard and Event Logs are used.
The table below the map lists the source addresses that produce the most load at that moment:
| Column | What it shows |
|---|---|
| Left (10s) | The share that remains from the ten-second activity window of the address; it is shown in the form of a ring. |
| Source IP | The source address, with the country flag. When it is hovered over, the address information opens. |
| Req (10s) · Conn (10s) · Err (10s) | The numbers of requests, connections and errors within the window. The request and error columns are present only on HTTP vServices. |
| In (10s) · Out (10s) | The amount of incoming and outgoing data within the window. |
The table shows at most twenty rows and this limit cannot be changed. On HTTP vServices the rows are in descending order according to the number of requests by default; on L7 TCP vServices, which do not have a request column, a default ordering is not applied. The ordering is changed by clicking the column heading, but this only rearranges the twenty rows that have come and does not bring deeper data. If there is no active address in the window, No active source IPs in the last 10 seconds is written in the table.
Scope and Limits
INFO
- The data is not stored. Live Stats shows only the instantaneous state; Dashboard is used for a retrospective examination.
- No time range can be selected. The only window control is the refresh interval.
- The rates are per second independently of the selected interval. Selecting a 30-second interval does not enlarge the values; it only changes in how many seconds the dashboard is refreshed and over which window the rate is smoothed. A short interval is suitable for seeing the sudden fluctuations and a long one for reading the trend.
- The source IP statistics are a fixed ten-second window and are not affected by the refresh interval.
- There is no rule- and host-based breakdown. The counters are across the vService; the examination at the rule level is made over Event Logs.
- Another screen is not passed to from the panels. The cards and the table rows do not carry a link. The elements that can be clicked on the screen are only the LIVE indicator, the refresh interval chips, the table column headings, the map and the source address information.
- The columns are not totaled in a cluster. Every device shows its own data; the device as a whole is not read by manually totaling the values of the two columns.
- When the traffic engine is reconfigured, since the counters are reset, the rates can be read as zero once in the refresh that coincides with that moment. The same situation is also experienced when the refresh interval is changed.
- A read error and there being no traffic cannot be distinguished everywhere. A part of the Frontend and source statistics cards shows
-when a read cannot be made; Uptime, Throughput, Incoming and Outgoing, on the other hand, write0even if there is no read. The protection outcomes, the bot bands and the distribution tables also read0in the same situation. - The refresh interval has a cost. Every refresh opens separate reads to the traffic engine; on a busy vService a 5- or 10-second interval is safer.
