
Smarter by Design.Simpler for Business
Dashboard
What Is Dashboard?
Dashboard is the monitoring dashboard that shows the behavior of a single route table over time. The screen combines two subjects on a single surface: the network traffic carried by the route table and the telemetry produced by the L4 DDoS protection applied to that traffic. In this way the questions "how much was the line loaded" and "how much of this load was an attack and how much was dropped" are read side by side in the same time range.
The dashboard is per route table: all the series shown belong only to that table. Since the L4 DDoS protection is also defined per route table, the protection panels of the dashboard carry the measurements of the rules defined in that table.
The two measurement families are collected at different speeds. The bandwidth, packet and error counters of the route table are read every two seconds; all the L4 DDoS measurements (the threat state, the rule telemetry, the quarantine and the dropped traffic) are read every five seconds and are written to the same five-second grid. The gateway check, on the other hand, is not bound to a cycle: its result is recorded every time the check runs. The data is stored in tiers; for this reason both the last five minutes and the past year can be looked at from the same screen.
The layout of the dashboard is not fixed. The panels can be moved, resized, their view can be changed, they can be removed and new ones can be added; next to the ready tabs, the user's own tabs can also be defined. All these preferences are stored in the user account and have no effect at all on the traffic or on the configuration.
7 + 1
View Tabs
Summary · Network · Floods · Connection Limits · Suspicious Packets · Quarantine · Dropped Traffic; Gateway Check is added only if a gateway check is defined
2 / 5 Seconds
Measurement Period
The network counters are read every two seconds and all the L4 DDoS measurements every five seconds
5 Bands
Threat Scale
No Attack · Low Activity · Possible Attack · Attack Detected · Active Attack
10 Years
Longest Retention
The resolution decreases as one goes back; the daily summary is kept for ten years
Disabled Rule
Without a Panel
The panel of a rule whose mode is Disabled is not seen; except for two rules, no record of it is kept either
Last 1 day(s)
Default Range
The screen opens with the last one day; the preset ranges extend from five minutes to five years
10 Seconds
Automatic Refresh
It is on by default; it stops by itself when an absolute date range is selected
32
Panels per Tab
The user can additionally define at most 16 tabs of their own
Monitoring Only
Authorization
Seeing the dashboard requires monitoring authorization in the Network area; arranging a panel requires no additional authorization
The dashboard is formed for every route table
All the route tables defined on TR7 get the same dashboard; the DEFAULT table is included as well. The protection is not enabled separately: the L4 DDoS rule catalog is ready in every route table.
The catalog defaults are also in force from day one: while the route table is being created, at every network write and in the configuration check at device startup, all the L4 DDoS fields whose value remains undefined are written to the route table with the catalog value. For this reason, in a route table that has never been touched a part of the rules is born in enforcement and a part in monitoring, and they produce measurements.
Panels also contain only the rules whose measurement is on: a rule whose mode is Disabled is not seen on the dashboard with its own panel, and no record of it is kept either. Two rules are outside this: the telemetry of the Allow ICMP and Smurf: TCP Reset Limit rules is recorded in every mode; measurements are written for these rules while they are Disabled as well, but their panels are still not displayed.
Accessing Dashboard
- Left Monitor Panel is opened.
- Route Tables & L4 DDoS is selected from the category tabs at the top left.
- The route tables defined on TR7 are listed.
- The route table to be monitored is clicked; the screen opens with the Dashboard tab that carries the name of the route table.
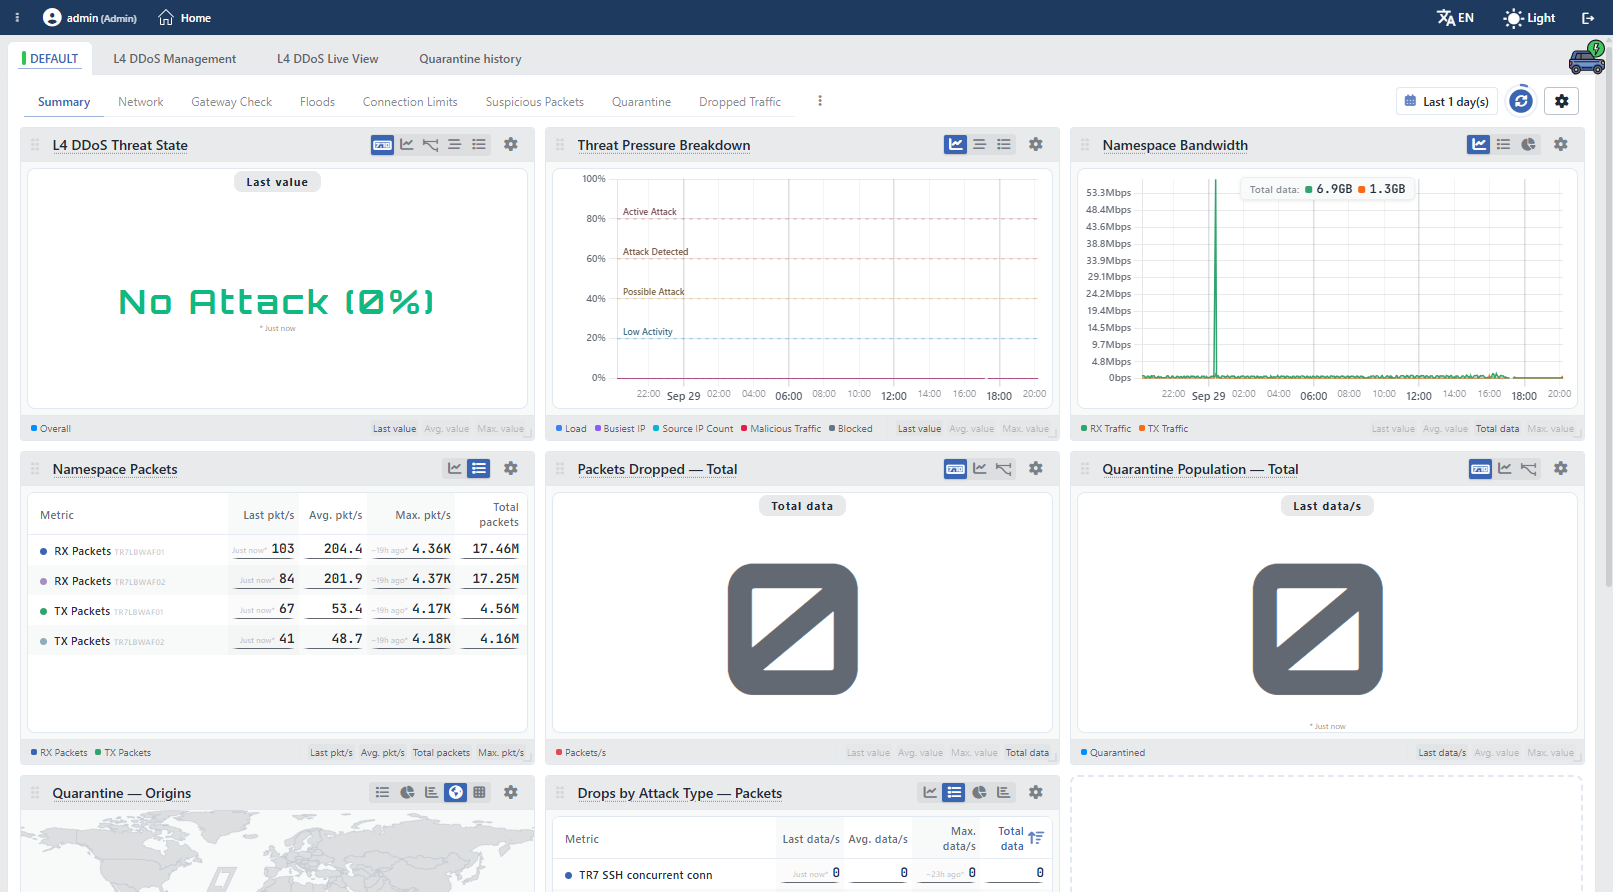 Route Tables & L4 DDoS Dashboard
In the category list, two counters are displayed under every row: the number of interfaces and IP addresses bound to the route table. A name and status filter can be applied to the list. Since the panel tabs can be arranged per user, if the category has been removed before, it is added again from the same selector.
Tab Bar
At the very top of the screen there are four fixed tabs and none of them can be closed:
| Tab | Content |
|---|---|
| the name of the route table | The monitoring dashboard explained on this page. |
| L4 DDoS Management | The whole L4 DDoS configuration of the route table. |
| L4 DDoS Live View | The live view of the sources in quarantine and of the instant rule pressure. |
| Quarantine History | The history of the sources that entered quarantine, listed according to the date range. |
The label of the first tab is the name of the route table; the colored mark on its left shows the status of the table in the system. The editing operation started from the preview panel is added to this strip as a closable Edit tab.
There is one more link between the tab strip and the dashboard: the Quarantine table → link of the Quarantine box on the L4 DDoS Management screen does not open a separate tab, it passes directly to the L4 DDoS Live View tab.
Route Table Preview Panel
On the right of the dashboard there is the preview panel that carries the summary information of the selected route table. The panel is open only while in the Dashboard tab; it closes when one of the other tabs is switched to.
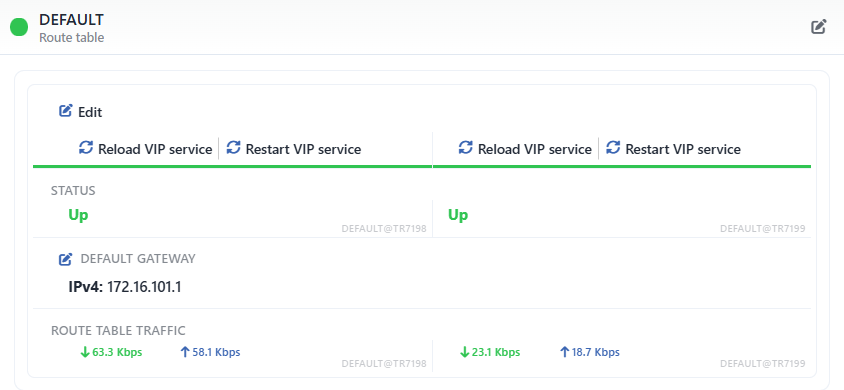 Route Table Preview Panel
Panel Header
In the header there are the name of the route table, the Route Table subtitle below the name and, on the left, the colored circle that shows its status. In cluster setups the circle is in two halves; the left half shows the status of this device and the right half the status of the peer device.
At the top right there is a single control:
| Button | Function |
|---|---|
| Edit | Opens the editing form of the route table as a closable tab in the tab strip. Requires change authorization in the Network area. |
There is no text on the button; the Edit label is displayed only as a tooltip.
The dashboard shortcut is not on this screen
The same preview header also carries a Dashboard button in the Route Tables list in order to go to the dashboard. On the dashboard this button is never displayed: the dashboard is already open.
There is no delete operation in the header either. Deleting a route table is not done from the preview header on any screen; it is carried out from the toolbar of the Route Tables list or from the right-click menu of the row.
Panel Body
The body has no tabs; the information is listed in a single list. In a cluster setup the list is divided into two columns; while the cluster is off, a single column is displayed. The columns have no header: the device they belong to is indicated with a small <route table name>@<device name> label in the bottom right corner of the cell in every row.
| Field | Its content |
|---|---|
| Edit | The counterpart in the body of the editing button in the header. |
| Reload VIP Service (only in a cluster) | Reloads the VIP service in the route table. |
| Restart VIP Service (only in a cluster) | Restarts the VIP service in the route table. |
| VTYSH Console (only in dynamic tables) | Opens the dynamic routing console of the table. |
| Restart (only in dynamic tables) | Restarts the dynamic routing service of the table. |
| Status | The status of the route table on the device; the value is written with the color of the status. |
| Default Gateway | The default gateways defined for the table, with the IPv4: and IPv6: labels. If both are undefined, - is displayed. The icon on the left of the row label opens the default gateway form. |
| Route Table Traffic | The current receive and send rate of the table. |
In a cluster setup the Edit button is a single row that covers both columns together; the Reload VIP Service and Restart VIP Service rows, on the other hand, are displayed separately per device and the button that is clicked is applied only to its own device. In the values, on the other hand, the distinction changes according to the field: Status and Route Table Traffic are read separately for every device, and Default Gateway, being a configuration value, is displayed in a single row that covers both columns together.
View Levels
The network monitoring view is offered at two levels:
| Level | Scope |
|---|---|
| Route table | The dashboard explained on this page: it shows the total of all the interfaces bound to the table and the L4 DDoS telemetry of the table. |
| Interface | The own dashboard of a single interface: only the link status, the bandwidth, the packets, the errors and the notifications of that interface. The L4 DDoS panels are not present at this level. |
Since the protection is defined per route table, the L4 DDoS telemetry is read only at this level. No rule-based distinction is made between the interfaces bound to a table: all the traffic entering the table passes through the same rule set.
Screen Controls
On the right of the tab strip there are the controls that affect the whole dashboard.
 Screen Controls
INFO
Menu
This button right of the view tabs is not an overflow menu; it opens the template menu titled Settings and manages the tabs themselves:
| Operation | What it does |
|---|---|
| Create New Template | Creates a new user tab. |
| Duplicate Current | Produces a copy of the selected tab. |
| Edit Template | Edits the name of the tab; it opens a window with a single field and is active only in the user tabs. |
| Reset to Default | Deletes the arrangement saved in the selected tab; it is active only if there is an arrangement saved in that tab. It asks for confirmation. |
| Remove Template | Deletes the user tab; it is not active in the ready tabs. It asks for confirmation. |
| Reset All to Defaults | Resets the whole dashboard: all the user tabs and all the arrangements are deleted, and the time range, theme, height, resolution and refresh preferences saved in the toolbar also return to the default. It asks for confirmation. |
Before the operation, Create New Template and Duplicate Current open a window with a single field that asks for the name of the tab and pass to the tab that is formed; the tab opened with Create New Template comes empty.
There are two more shortcuts on the tabs: a double click returns the tab to the default (it asks for confirmation), and a middle click removes the user tab.
The reset also works in the user tabs
Reset to Default and the double click are not limited to the ready tabs. When they are applied in a user tab, since there is no default to return to, the tab is emptied: all the panels in it are removed and it cannot be undone. The only way to restore a user tab is to add the panels again.
INFO
Last 1 day(s) Time Range
Determines the time range covered by all the panels on the dashboard. The default value is the last one day.
The preset ranges are the values 5m, 15m, 30m, 1h, 3h, 12h, 1d, 3d, 7d, 1M, 3M, 6M, 1y and 5y respectively. Next to these, a free duration entry (minute, hour, day, week, month, year) and an absolute range defined by giving a start and an end date can also be used.
The selection is stored in the user account; only the absolute range selection is not stored.
INFO
Refresh
Fetches all the panels again. While the operation continues, the icon turns and the button becomes inactive.
The ring around the button is the countdown of the automatic refresh. The automatic refresh is on by default and runs every 10 seconds. When an absolute start and end are selected as the time range, the automatic refresh stops by itself; it runs only in the ranges in the form "the last N units".
INFO
Settings
Gathers the general settings of the dashboard in three sections.
Data
| Setting | Options | Default |
|---|---|---|
| Chart Resolution | High Resolution · Standard Resolution · Low Resolution | Standard Resolution |
| Auto-refresh | Disabled · 5s · 10s · 30s · 60s | 10s |
Clustering (displayed only in a cluster setup)
| Setting | Options | Default |
|---|---|---|
| Source | The name of its own device · the name of the peer device · Both Devices | Both Devices |
Visual
| Setting | Options | Default |
|---|---|---|
| Height | The height of the panels on the screen | - |
| Theme | Professional · Corporate · High Contrast · Monochrome Blue · Colorblind Safe | Professional |
Every change is written to the user account immediately.
INFO
Panel View Icons
In the header of every panel, the views supported by that panel are located as icons and are switched to by clicking. If only a single view is supported in a panel, the icon group is not displayed.
| Icon | View | Meaning |
|---|---|---|
| 7:10 | Digital | The reading of a single number in a large font. |
| Line Chart | A series graph on the time axis. | |
| Mini Chart | A small trend line in the panels with a single series. | |
| Status Timeline | A time strip consisting of status boxes. | |
| Stat Table | The numerical summary of the series. | |
| Pie Chart | The ratio of the series to one another. | |
| Bar Chart | The bar comparison of the series. | |
| Map | The distribution of the series on a country map. | |
| Heatmap | The listing of the country distribution as heat density. |
The handle on the left of the header is used to drag the panel and reorder it, and the handle at the bottom right corner to resize the panel; the resizing settles on half-card steps.
INFO
Panel Settings
The gear at the right end of the panel header offers two operations:
- Edit: edits the Section (which graph), Visualization Type (the view), Row Span and Column Span values of the panel. The color, the threshold, the unit and the data source are fixed in the definition of the graph and cannot be changed from here.
- Remove: removes the panel from the tab. It does not ask for confirmation.
INFO
Panel Metric Columns
On the strip below the panel, on the left there is the colored legend of the series and on the right the aggregation boxes: Last Value, Avg. Value, Max. Value and a total box. The order of the boxes changes according to the panel: in the Packets Dropped — Total panel the order is the last value, the average, the peak and the total; only the Namespace Bandwidth and Namespace Packets panels put the total box in the third place, before the peak box. Clicking a box opens or closes that value; the values that are open are also shown in a floating box over the graph.
The strip is not displayed at all in the graphs that carry more than six series. For this reason, in the stacked graphs that open one series per rule, such as Attack Waves — Packets/s, there are neither aggregation boxes nor a floating box.
Which of the boxes are present and which one comes open changes according to what the panel measures:
| Panel family | Boxes | The one that comes open |
|---|---|---|
| The bandwidth, packet and dropped traffic totals | All four | Total: what is measured is a rate, what is meaningful is the amount accumulated over the range. |
| The threat state, the pressure breakdown and the quarantine population | Three boxes: Last Value, Avg. Value and Max. Value; there is no total box | Last Value: what is measured is a level, the range average looks misleadingly calm. |
| The rate and concurrency graphs per source IP | There is no total box | Avg. Value and Max. Value together. |
| The Stat Table and map views | The same as the boxes of the panel | All the columns; for every series the values the panel carries are read side by side. There are four columns in the panels that carry a total, and three columns (the last value, the average, the peak) in the threat state, pressure breakdown and quarantine population panels. |
The text on the box is different in the open and the closed state: while the box is closed, it carries the general name below, and while it is open, the graph's own name with its unit. For this reason the same Total box says Total Data on the bandwidth panel and Total Packets on the packet panel.
The names with units of the L4 DDoS panels are written in the form of data volume: on the panels that count packets and that count the addresses in quarantine, the boxes also carry the Total Data, Last Data/s, Avg. Data/s and Max. Data/s labels. The unit of the value is not in the name of the box but in the panel's own title and in the axis label.
The meanings of the values are as follows:
| Box | How it is calculated |
|---|---|
| Last Value | The last valid measurement in the selected range. |
| Avg. Value | The average of the range; it is calculated only over the period that carries data. |
| Total | The sum of the rate over time, that is, rate × duration. In the dropped traffic this is the total amount of packets or bytes really discarded in the range. |
| Max. Value | The highest value in the range. |
The MAX badge on the left of the strip is not an aggregation function: it turns the highest value band on and off. When it is turned on, the peak values of the same series are added behind the average line as a semi-transparent band; the purpose is to make visible the sudden jumps that the average swallows in wide time ranges.
The badge is not present on every panel. If the view is not a line chart, if the number of visible series is zero or more than two, if the series are stacked on top of one another or if in a cluster the data of two devices is shown combined, the badge is not displayed.
View Tabs
The dashboard offers eight ready tabs. Seven of them are seen unconditionally, and Gateway Check is conditional.
 View Tabs
| Tab | Its subject |
|---|---|
| Summary | Eight panels selected from two subjects: the threat state, the pressure breakdown, the bandwidth, the packets, the dropped traffic and the quarantine. |
| Network | The pure network telemetry of the route table; it contains no L4 DDoS panel. |
| Gateway Check (conditional) | The reachability check of the default gateway. It is displayed only if a gateway check is defined in that route table. |
| Floods | The telemetry of the rules that limit the rate per source IP. |
| Connection Limits | The telemetry of the rules that limit the concurrent connections per source IP. |
| Suspicious Packets | The telemetry of the packet classes that match not a threshold but a signature. |
| Quarantine | The number, the origin and the distribution of the sources taken into quarantine. |
| Dropped Traffic | The volume of the traffic really dropped and its distribution by attack type. |
Add Visualization
The ADD VISUALIZATION slot at the end of the grid adds a new panel to the selected tab. In the Dashboard Section window that opens there are four fields: Section (which graph), Visualization Type (the view), Row Span and Column Span.
The graphs listed change according to the selected tab: every tab offers the graphs that enter its own subject. The Enforcement Modes panel, which is not present in any of the ready tabs, is also added from here; the panel shows in which mode and for how long every rule has run, in the form of colored bands.
The panel is added not to the dashboard but to the tab selected at that moment and the preference is stored in the user account. There can be at most 32 panels in a tab.
Summary Tab
Summary is a view with eight panels: two threat panels, two network panels and four protection panels. Six of them are selected from the Network, Quarantine and Dropped Traffic tabs; the L4 DDoS Threat State and Threat Pressure Breakdown panels, on the other hand, are not present in any other ready tab, they are found only here and in the ADD VISUALIZATION list.
L4 DDoS Threat State
Shows the current threat level of the route table as a single value. The value is the combination of the pressure collected from all the protection rules and is measured between 0 and 1; on the panel it is written as a percentage together with the name of the band it is in (e.g. No Attack (0%)).
The scale is divided into five bands:
| Band | Range | Meaning |
|---|---|---|
| No Attack | 0 – 20% | There is no measured pressure. |
| Low Activity | 20% – 40% | Light activity; it is not an alarm level. |
| Possible Attack | 40% – 60% | A single axis is testifying on its own. |
| Attack Detected | 60% – 80% | At least two axes must rise at the same time and markedly. |
| Active Attack | 80% – 100% | At least two axes have been read close to the ceiling at the same time. |
The thresholds of the bands tell how many witnesses are speaking. An axis is counted as a witness only when its value passes 40%, and an axis that testifies on its own caps the value at 59%; that is, a single axis can never rise above the Possible Attack band. For the alarm bands more than one axis must rise at the same time; in this way a single source forcing a single rule for a short time is not declared an attack.
The value moves fast on sudden jumps and slowly on calming down: a smoothing of about 15 seconds is applied while rising and of about 60 seconds while falling. For this reason, when the attack ends, the panel stays high for a few measurements and comes down gradually.
The panel can also be opened in the Line Chart, Mini Chart, Status Timeline and Stat Table views. The status strip view turns the same value into a time strip consisting of the band colors and makes it possible to read at a single glance when the attack started and when it ended.
A gap is not calm
An axis that cannot be measured is recorded not as zero but as empty. A gap in the graph does not mean "there was no pressure", it means "that axis could not be measured at that moment".
The Load axis is the permanent example of this: the series is defined, but since there is not yet a volume counter across the route table, it always looks empty.
In a cluster the highest value is valid
This panel does not add up the values of the cluster members. It shows the higher one of the measurements of the two devices: even if the attack comes to only one device, the threat level of the route table is the reading of that device.
Threat Pressure Breakdown
Separates out where the threat level comes from. On the same 0–1 scale it carries four axes and one response line:
| Series | What it measures |
|---|---|
| Load | The volume across the route table. Since there is no counter that corresponds to it, this series is currently always empty. |
| Busiest IP | The fill level of the single source that forces the most, according to its own limit. In the rules that limit a rate it is calculated over the packets per second, and in the ones that limit concurrent connections over the number of open connections. If the limit is very small, a significance floor is used instead: 50 packets per second in the rate rules and 25 connections in the connection rules. |
| Source IP Count | How much the pressure is spread over the sources. It is not a number but the measure of whether the upper slice of the sources is also forcing the limit, and it stays zero unless at least 20 separate sources are seen. If only Busiest IP is high, a single-source forcing is read, and if both are high, a distributed attack. |
| Malicious Traffic | The density of the traffic counted as hostile by its signature. Since most of these packets have no legitimate counterpart, their volume itself is the signal. |
| Blocked | The volume of packets really dropped together with the entry rate into quarantine. It is shown with a dashed line. |
The Blocked line works differently from the others and does not mix into the average of the threat level. The reason for this is the measurement logic: an attacker taken into quarantine disappears from the other axes, so the more the defense works, the lower the pressure looks. In order to compensate for this, the Blocked value applies a floor to the threat level; however, this floor is limited so as to stay below the alarm bands. That is, an absorbed attack becomes visible, but the defense itself cannot declare an attack on its own.
The contribution of the axes is weighted according to its source. The rules that protect the device's own management ports do not carry full weight: a management port scan is seen on the panel, but it cannot raise the route table to the top band on its own. The packet classes that a healthy network can also produce (packets with an invalid state, new packets that do not carry SYN, suspicious MSS and sources coming from private address spaces) are limited in a similar way and cannot produce the top band on their own.
The panel can also be opened in the Status Timeline and Stat Table views.
Namespace Bandwidth
Shows the amount of data the route table receives and sends per second. It carries two series: RX Traffic (received) and TX Traffic (sent). The values are the total of all the interfaces bound to the table.
In the total box that comes open (Total Data), the value is not a rate but the total amount of data carried in the range.
The panel can also be opened in the Stat Table and Pie Chart views.
Namespace Packets
Shows the number of packets the route table receives and sends per second: RX Packets and TX Packets. On the Summary tab it is placed with the table view; for every series the last value, the average, the peak and the total number of packets are listed in separate columns.
The packet rate is a measure that must be read independently of the bandwidth and is especially important in the L4 DDoS context: flood type attacks produce a large number of small packets, so while the bandwidth looks calm, the packet rate can hit the ceiling.
The panel can also be opened in the Line Chart view.
Packets Dropped — Total
Shows the total number of packets dropped by all the protections together in the selected range as a single value.
The counter is fed only from the real drop path: the packets a rule drops while running in Block or Quarantine mode are counted. A rule in Monitor mode sees the match but lets the traffic pass, so it makes no contribution at all to this panel. This distinction is critical in reading the panel: the value being zero can also mean not that there was no attack but that no rule was applying enforcement.
The panel can also be opened in the Line Chart and Mini Chart views.
Quarantine Population — Total
Shows the number of unique IPs held in quarantine at that moment. The value is not a range total but an instantaneous population.
The number is not added up but combined between the protections: if the same IP has been taken into quarantine by more than one rule, it is counted once here. For this reason the value of the panel can be smaller than the total of the rule-based distribution on the Quarantine tab.
When a range is selected, the value read follows the selected aggregation function: the last value, the average or the peak.
The panel can also be opened in the Line Chart and Mini Chart views.
Quarantine — Origins
Shows which countries the sources taken into quarantine come from on a world map. The countries are colored according to the density.
The map measures not a population but a flow: the sources newly entering quarantine in the selected range are counted according to their countries. If an IP has been caught by more than one rule in the same measurement, it is counted separately for each of them; the purpose is to make the volume of the attack origin visible.
The local and private address spaces are gathered under the Local Networks heading and are always on the map even if their value is zero; the other countries enter the list only when they carry data. The addresses whose geography cannot be resolved, on the other hand, are not written under any heading; for this reason the total of the map can stay smaller than the number of records entering quarantine in the same range.
The panel can also be opened in the Heatmap, Stat Table, Bar Chart and Pie Chart views.
The resolution of this panel is coarser than that of the others
Since the country distribution keeps more than two hundred separate series, a more economical retention is applied: the one-minute resolution is kept for one day, the five-minute resolution for one week, the fifteen-minute resolution for one month, the hourly resolution for three months and the daily summary for two years; anything older is kept as a five-day summary.
The horizon is again ten years, but the per-second intermediate steps in the other protection panels are not present on this panel.
Drops by Attack Type — Packets
Lists rule by rule which protection the dropped packets come from. Every row is a rule and is fed from its own measurement file.
The table is sorted by default from the largest to the smallest by the total number of packets; in this way the rule that cuts the most traffic in the range sits in the first row. Every row is read together with four columns: the last value, the average, the peak and the total. The list contains all the rules that can apply enforcement and the ones whose value is zero also keep their rows: since the rule set does not change from measurement to measurement, making a comparison becomes easier.
The rules that have no enforcement path are not present in this table at all. The settings with an on/off structure and the rules that limit a rate and let it pass do not enter the list, since they do not drop traffic. The rules that protect the device's own management ports, on the other hand, are listed only in the DEFAULT route table of the main device.
The panel can also be opened in the Line Chart, Bar Chart and Pie Chart views; in the line view the series are stacked on top of one another.
Network Tab
Gathers the pure network telemetry of the route table under three subject headings; it contains no L4 DDoS panel. Every graph is placed together with the numerical table of the same data next to it.
| Panel | Its content |
|---|---|
| Namespace Bandwidth | The received and sent data rate (RX Traffic · TX Traffic). |
| Namespace Packets | The received and sent packet rate (RX Packets · TX Packets). |
| Network Namespace Errors | The frames counted as faulty and the dropped packets (RX Errors · TX Errors · RX Drops · TX Drops). |
The RX Drops and TX Drops values here are not the traffic dropped by the L4 DDoS protection: they are read from the interface counters and point to queue and resource pressure. The traffic dropped by the protection is measured only on the Dropped Traffic tab.
The cluster behavior changes according to the view
In a cluster setup the graph views of these three panels add up the data of the two devices and show a single RX and a single TX line. The only view that separates the devices is Stat Table: there every device gets its own row.
Which devices will be taken into account is changed with the Source selector in the settings window.
Gateway Check Tab
Shows the result of the reachability check made to the default gateway of the route table. The tab is displayed only if a gateway check is defined in that route table; if it is not defined, it is not present in the tab strip at all.
| Panel | Its content |
|---|---|
| Gateway Status | Whether the gateway is reachable, as a status strip. The value 1 means reachable and 0 unreachable. |
| Gateway Response Time | The round-trip time of the response returning from the gateway; as a graph and as a numerical table. |
Both panels carry the IPv4 and IPv6 gateways as separate series and only the family that is defined is drawn. The panel titles, unlike those of the other tabs, also show the name of the route table in parentheses.
The cluster behavior is also different on this tab: the status strip and the graph views keep the devices separate, while the numerical table view gives the average of the two devices.
Floods · Connection Limits · Suspicious Packets Tabs
These three tabs carry the raw telemetry of the L4 DDoS rules. Their panels are not placed manually: every tab produces one panel per rule for the rules whose measurement is on. For this reason the number of panels changes according to the configuration of the route table; when a rule is taken into Disabled mode, its panel also disappears.
| Tab | Which rules | Panel title |
|---|---|---|
| Floods | The ones that limit the number of packets per second per source IP. | L4 DDoS Rate — <rule> |
| Connection Limits | The ones that limit the number of concurrent connections per source IP. | L4 DDoS Concurrency — <rule> |
| Suspicious Packets | The ones that look not at a threshold but at the class of the packet: the signature checks together with the IP reputation and the packet counters with an on/off structure. | L4 DDoS Packet Class — <rule> |
The Floods and Connection Limits panels have the same structure and carry four series:
| Series | Meaning |
|---|---|
| Peak (Worst Source IP) | The highest single source value in the measurement. |
| p95 (Bulk Upper Edge) | The value below which 95 percent of the sources stay; the upper limit of the crowd. |
| Active Source IPs | The number of sources entering the measurement at that moment. It is shown on the right axis. |
| Configured Limit | The limit of the rule in force. It is drawn as a line over the observation series; in the aggregation strip only its last value is displayed numerically. |
The dashed form of the limit line tells the mode of the rule; in this way an administrator looking at the graph also sees whether the enforcement is really applied at the moment the threshold is exceeded. The mode is also read in writing in the tooltip of the series. When the limit is changed manually, the line makes a step and the history of the old value is not deleted.
In these two panel families there is no total box; the boxes that come open are Avg. Value and Max. Value.
The Suspicious Packets panels do not carry a limit, because these rules drop the matching packet directly. They show a single series (Packets/s) and the fill color of the series carries the mode of the rule: the warning color in monitoring mode and red in enforcement mode. The ranges in which the rule passed disabled are drawn dim; if the rule is currently disabled, the panel itself is not displayed at all.
In a cluster the series are not combined
By default the panels on these three tabs do not add up the data of the cluster members; every device keeps its own series. The reason for this is the limit line: if the limits of the two devices were added up, a threshold that never existed would be drawn on the graph. The mode information is kept separate for the same reason.
While the Source value in the settings window is Both Devices, a Combine selector opens and the way of combining can be changed from here.
Quarantine Tab
Shows the sources taken into quarantine from four angles: how many sources entered in the range, how many sources are held at that moment, where they came from and by which protection they were caught.
| Panel | View | Its content |
|---|---|---|
| Quarantined in Range — Total | Digital | The total of the records that entered quarantine in the selected range. It is a flow measure and, if the same source has been caught by more than one rule, it is counted separately for every rule. |
| Quarantine Population — Total | Digital | The number of unique IPs held in quarantine at that moment. It is a population measure. |
| Quarantine — Origins | Map | The country distribution of the sources entering quarantine; here too it is counted separately for every protection. |
| Quarantine Entries — By Attack Type | Line Chart · Stat Table | The number of sources every protection sent to quarantine in the range; stacked over time and as a table. |
| Quarantine Population — By Attack Type | Stat Table | The number of sources every protection holds at that moment. Since it is an instantaneous number, there is no total column in this table. |
The flow and population panels are deliberately kept separate: one answers the question "how many of them came" and the other "how many of them are still inside", and combining them in the same graph makes both of them read wrongly.
The two rule-based tables list only the rules that can send to quarantine; the rules whose enforcement is limited to dropping packets only are not present in these tables. All the rules listed keep their row even if their value is zero.
The totals do not overlap
The Quarantine Population — Total panel counts unique IPs, while the rule-based table shows the number of every rule. If the same source has been caught by more than one rule, it is seen in more than one row in the table but is counted once in the total. For this reason the numbers of the two panels do not have to be equal.
On the flow side, on the other hand, exactly the opposite is valid: Quarantined in Range — Total and Quarantine — Origins do not deduplicate, they count per rule. The value of these two panels can be larger than the number of different sources entering quarantine in the same range.
The quarantine duration is defined not per rule but across the route table and is managed from the Quarantine card.
The first reading after a restart is only a snapshot
When the measurement collector restarts or the route table is set up again, the first reading takes only a snapshot of the sources in quarantine. The sources already in quarantine at that moment are not counted as new entries: they are not added to the Quarantined in Range — Total, Quarantine — Origins and Quarantine Entries — By Attack Type panels or to the quarantine entry component of the Blocked line in the Threat Pressure Breakdown panel. A measurement that cannot be read, on the other hand, is skipped completely and no value is written for that measurement.
Dropped Traffic Tab
Shows the volume of the traffic the protections really dropped. All the panels on the tab are fed from the counters on the enforcement path; the matches in monitoring mode do not enter here.
| Panel | View | Its content |
|---|---|---|
| Packets Dropped — Total | Digital | The total number of packets dropped in the range. |
| Bandwidth Shed — Total | Digital | The total amount of bytes dropped in the range. |
| Attack Waves — Packets/s | Line Chart | The course over time of the number of packets dropped per second, in the form of areas stacked by attack type. |
| Drops by Attack Type — Packets | Stat Table | The number of packets every protection dropped, from the largest to the smallest. |
| Drops by Attack Type — Bandwidth | Stat Table | The amount of bytes every protection dropped, from the largest to the smallest. |
The two distribution tables show the same event through two different lenses. The packet lens brings to the fore the floods that produce a large number of small packets, and the bandwidth lens the filling of the line with a small number of large packets. Which type an attack is of is most of the time understood from the ordering of the two tables being different.
The Attack Waves — Packets/s panel gives the time of the attack: each of the stacked areas is a protection rule, and the moment the area thickens is the moment that rule took effect.
Scope and Limits
INFO
- The dashboard is only for monitoring. The panel layout, the view selection, the relative time range and the settings are stored in the user account; none of them affects the configuration of the route table, the protection rules or the traffic. When the date range is fixed manually, this selection is not stored.
- The layout is not stored per route table. The panel placement, the selected tab and the settings are kept common for all the route tables: an arrangement made in one table also becomes valid on the dashboard of the others.
- There can be at most 32 panels per tab; the user can define at most 16 tabs of their own. When the limit is exceeded, a warning is displayed.
- The number of panels changes with the configuration. The rule telemetry tabs produce a panel only for the rules whose measurement is on; the quarantine and drop tables also list only the rules that have the related capability. The rules that protect the device's own management ports are seen only in the DEFAULT route table of the main device.
- There are two measurement speeds. The network counters are read every two seconds and all the L4 DDoS measurements every five seconds. For this reason a shift of a few seconds can be seen between the trace of an attack on the network graph and its trace on the protection graph. The gateway check, on the other hand, is not bound to either of these two cycles; its result is written according to its own check period.
- The retention is tiered and the resolution decreases as one goes back. The finest step is the record file's own step (one second in the network files, five seconds in the L4 DDoS files) and it is kept for one minute; then the five-second resolution is kept for one day, the fifteen-second for three days, the one-minute for two weeks, the five-minute for sixty days, the fifteen-minute for one hundred and eighty days, the hourly for two years, the six-hourly for five years and the daily summary for ten years. The Quarantine — Origins panel is outside this rule: its horizon is again ten years but it is kept with fewer steps and at a coarser resolution.
- If there is no record that covers the selected range, the panel shows no data. If the record file does not exist at all or if no retention step covers that window, the warning No data recorded for the selected time range. is displayed; if the query succeeds but returns empty, the card's own empty state layer is written.
- The first reading after a restart does not count quarantine entries. When the measurement collector restarts or the route table is set up again, the first reading takes only a snapshot; the sources in quarantine at that moment are not counted as new entries in Quarantined in Range — Total, Quarantine — Origins, Quarantine Entries — By Attack Type and the Blocked line. A measurement that cannot be read is skipped and no value is written in its place.
- An empty series is not zero. On the threat panels an axis that cannot be measured is left empty; a gap in the graph tells not that there was no pressure but that that axis could not be measured.
- Removing a panel does not ask for confirmation. The Remove operation in the panel gear is applied directly; in order to undo it, the panel is added again or the tab is reset with Reset to Default.
- Seeing the dashboard requires monitoring authorization in the Network area. Adding a panel, removing it and creating a template require no additional authorization; the editing operation started from the preview panel, on the other hand, requires change authorization.
- When a route table is deleted, its dashboard cannot be accessed. The moment the record drops out of the configuration, the table is not seen in the list and its dashboard is not produced. The measurement files collected earlier are not deleted.
