
Smarter by Design.Simpler for Business
Log Settings
What Is Log Settings?
Log Settings manages the volume of the records WAF produces from two separate points: the smart sampling of the learning log (how many lines will be written) and the not listing of the attack records under a certain condition.
The two settings touch different records and do not take the place of each other: the sampling affects only the learning record, the suppression condition only the attack record.
Which setting determines which record
The volume and the content of the records are managed from more than one screen; so that they are not confused:
- Log Settings (this screen): how many lines will be written into the learning log and which of the attack records will not be listed.
- Request Body Limits: the length of the body quotation in the attack record.
- The Detailed Log switches of the inspection fields under WAF Rules: whether the matching value will be kept in the attack record or not.
- SIEM & Attack Details: the fields of the attack information sent outside.
The scope
The Log Settings settings are valid across the vService and are common in all the host groups. The smart sampling works only in the HTTP vServices; in the L7 TCP vServices this setting has no effect.
The Log Settings Card on WAF Management
The Log Settings card in the Learning & Reporting section of the WAF Management screen summarizes the sampling state in a single sentence: while the sampling is on The learning log is smart-sampled — the first 50 of each request shape are written in full, while it is off Sampling is off — every request is written in full (only advisable on low traffic). If a suppression condition is defined, below it the line WAF logging is suppressed for requests matching: and the summary of the condition are added.
Since this card, like the Request Body Limits, Blocking Page and SIEM & Attack Details cards, has no on/off switch, it never goes dim and does not take the Disabled pill; it looks alive while the sampling is off as well. The card additionally shows the sampling sentence even if the vService is only blocking and is not learning at all; the sampling does a job only in a vService that learns.
When the pencil icon at the top right of the card is clicked, the edit screen opens.
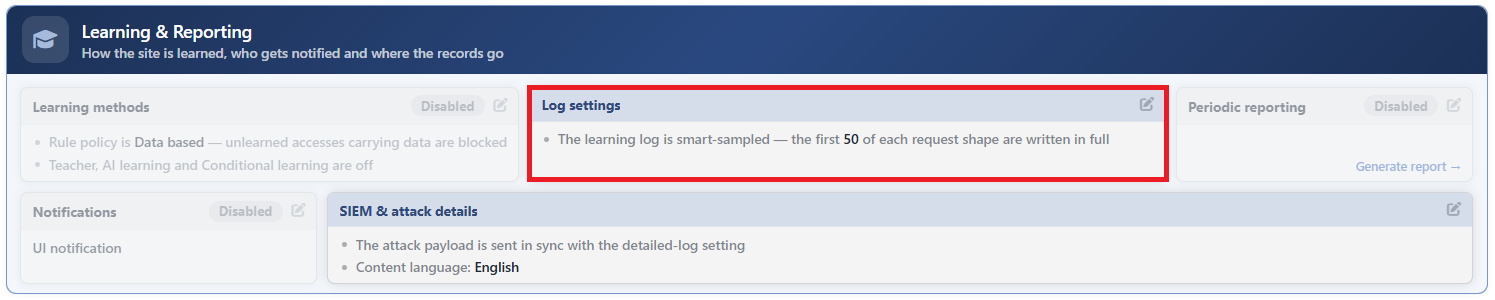 WAF Management - The Log Settings Card
The Log Settings Edit Screen
- The WAF Management tab is opened.
- The pencil icon at the top right of the Log Settings card in the Learning & Reporting section is clicked; the editing window titled Log Settings opens.
- The following fields are edited and confirmed with the
Editbutton.
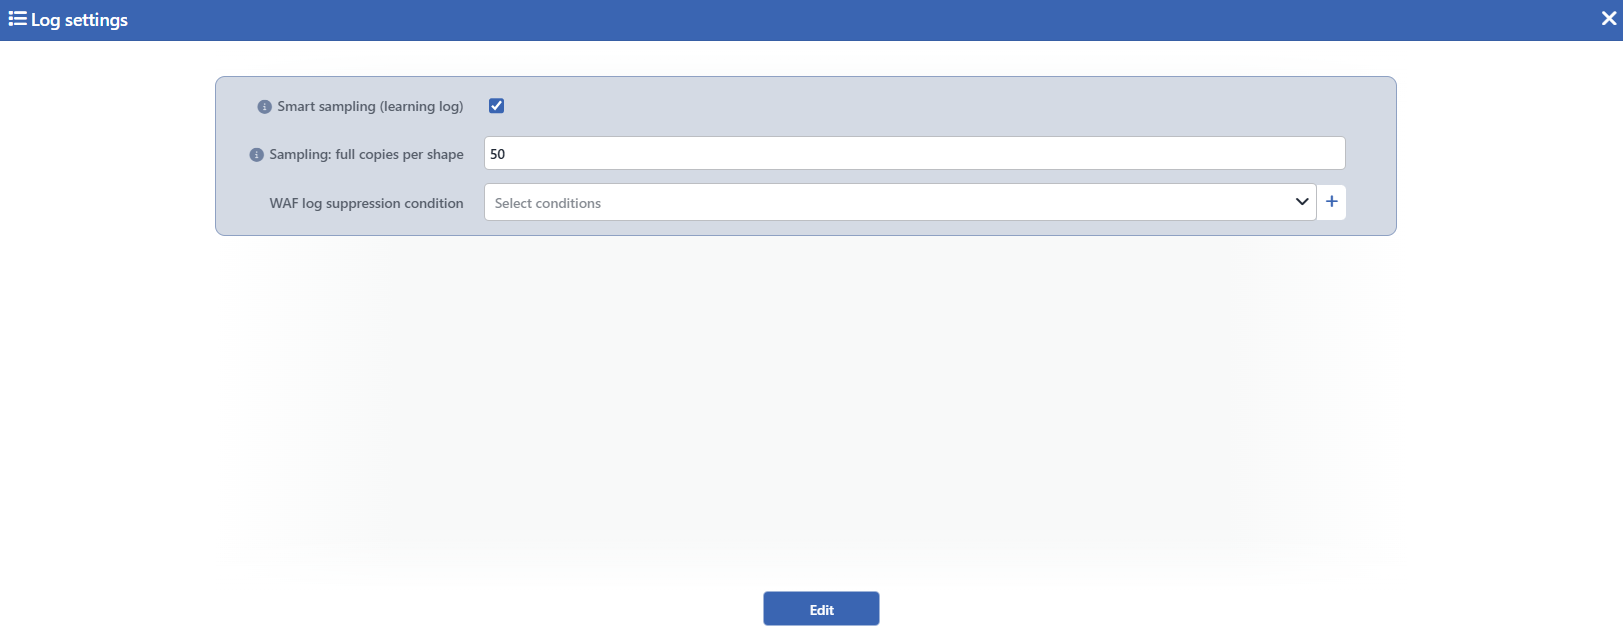 The Log Settings Edit Screen
INFO
Smart Sampling (Learning Log) Default: Checked
It turns on the smart sampling of the learning log; it is checked by default. While it is on, the requests are grouped according to their shapes and the first samples of every shape are written in full, and from the rest a sparse sample is taken. When it is turned off, every request within the learning scope is written in full; this selection is recommended only on the sites with low traffic.
The request shape is a signature consisting of the method, the host, the page (path), the parameter names and the value length ranges, the body field names, the header names, the attack signatures triggered if there are any and the response status code given to the request. The shape signature does not carry the values themselves; the requests that come to the same page with different parameter values of a similar length count as the same shape, and when the value length falls into a different range or the request produces a different status code, a separate shape is formed. A request that triggers a different attack pattern also opens its own quota as a separate shape.
Sampling: Full Copies per Shape Default: 50
Into this field that appears in the form when the box is checked, how many times a shape will be written in full before the sampling is passed to is entered; it takes a value between 5 and 10000 and its default value is 50. After the quota is filled, the requests of the same shape are sampled randomly: in the default setting approximately one of every twenty requests is written. Increasing the value, within certain limits, both collects more full samples and makes a sample be taken more frequently from the remaining requests; decreasing it thins out both. When a shape is seen for the first time, it is written in full as a rule.
The counting is cumulative per shape: it is not per period, it is gathered as that shape is seen. If a shape is not seen at all for a long time (approximately three weeks), it falls out of the memory; the shape memory also has an upper limit, for this reason in the systems in which a large number of new shapes are formed the oldest shapes may fall before this period as well. Additionally, in the cases in which a large number of new shapes appear at once in a short time (for example a client that scans by producing parameter names), the record is taken under protection and during that minute the full writing of the new shapes is thinned out as well.
INFO
WAF Log Suppression Condition
The condition that determines which of the requests written into the attack record will not be listed is defined; only the HTTP Conditions belonging to the request side can be selected. When no condition is defined, the field is displayed as an empty condition group, no record is suppressed and the suppression line does not take place on the card.
The requests that meet the condition are not listed on the Event Logs screen and in the filtered reports. The inspection behavior does not change: the request is still inspected and if it needs to be blocked, it is blocked.
INFO
Edit
The changes in the form are saved by clicking the Edit button; the button becomes enabled when no error remains in the form. There is no additional confirmation window or deployment (deploy) step; the WAF configuration is automatically produced again and applied.
The suppressed records continue to be seen in the summary countings
The suppression is not a writing but a listing restriction: the requests that meet the condition continue to be written into the attack record and are included in the countings in the Dashboard panels and in the summary reports; they are only taken out of the record lists. For this reason the suppression cannot be used to reduce the disk usage and creates a difference between the summary numbers and the list numbers.
Deleting the condition changes the suppression silently
A Conditions definition used in the suppression condition does not count as in use because it is used on this screen and can be deleted without a warning being given. When the only defined condition is deleted, the suppression becomes non-working; on the card, on the other hand, the condition line may continue to be displayed. In a definition in which more than one condition is used together, if only one of the conditions is deleted, the suppression does not stop, it continues with the remaining conditions and takes a wider traffic than expected out of the record list.
When the sampling is turned off
When the sampling is turned off, the learning log writes every request in full and the record volume grows rapidly. Additionally, the Learning tab on the Dashboard screen and the learning graphs in it (Learning Log Sampling, Learning Discovery Rate, Learning Coverage) become invisible. When the sampling is turned on again, the shape countings are not reset; they continue from where they left off and this memory, by being shared between the cluster devices, survives the configuration refreshes as well.
