
Smarter by Design.Simpler for Business
Load Balancer Management
What Is Load Balancer Management?
Load Balancer Management is the tab that summarizes the current configuration of a vService in plain sentences. Instead of listing form fields one by one, the screen turns each setting into a readable sentence: which addresses traffic enters from, where TLS is terminated, which security modules are active, which rules run in which order, how traffic is distributed and which Backend Services it reaches are read on a single screen.
The screen is a reading surface. The actual editing on the vService takes place in the vService form in the Configuration Menu; the Edit link located in the header strip of the sections in this tab, except for the section titled with the type, opens the same form directly at that section's fields. In this way, there is no intermediate step between reading a setting and correcting it.
No row on the screen is queried separately for this screen; all of them are derived from the vService record and the device's live status data, and they refresh themselves as soon as the record changes. Measured values (request count, bandwidth, health history) are not on this screen but in the Dashboard tab. The live indicators here are four: the vService's combined status, the status and warning sentences in the first section, the operating color of the listener addresses and the health status of the Backend Services.
7
Sections
Entry addresses, security modules, actions, settings, HTTP processing, distribution and Backend Services
One Click
Going to the setting
Each section's Edit link opens the vService form at that section's fields
Live
Configuration summary
Sentences are derived from the vService record and the device's live status; the screen changes as soon as a setting changes
3 Types
All vService types
Works in HTTP, L7 TCP and Network vServices; the section set narrows according to type
Read-Only
For unauthorized users
Without permission, the edit entries of sections and boxes disappear, and the content stays complete
Warns
Incomplete configuration
Incomplete settings are marked with an amber-colored phrase within the sentence
Accessing the Screen
- Left Monitor Panel is opened.
- Load Balancer vServices is selected from the category tabs at the top left.
- The vServices defined on TR7 are listed.
- The vService to be monitored is clicked; the screen opens with the Dashboard tab that carries the vService's name.
- On the screen that opens, the Load Balancer Management tab is clicked.
On the right of the screen, the Load Balancer - ADC Data Flow Panel panel from the Dashboard tab stays open here as well; the diagram and this screen are two separate readings of the same configuration.
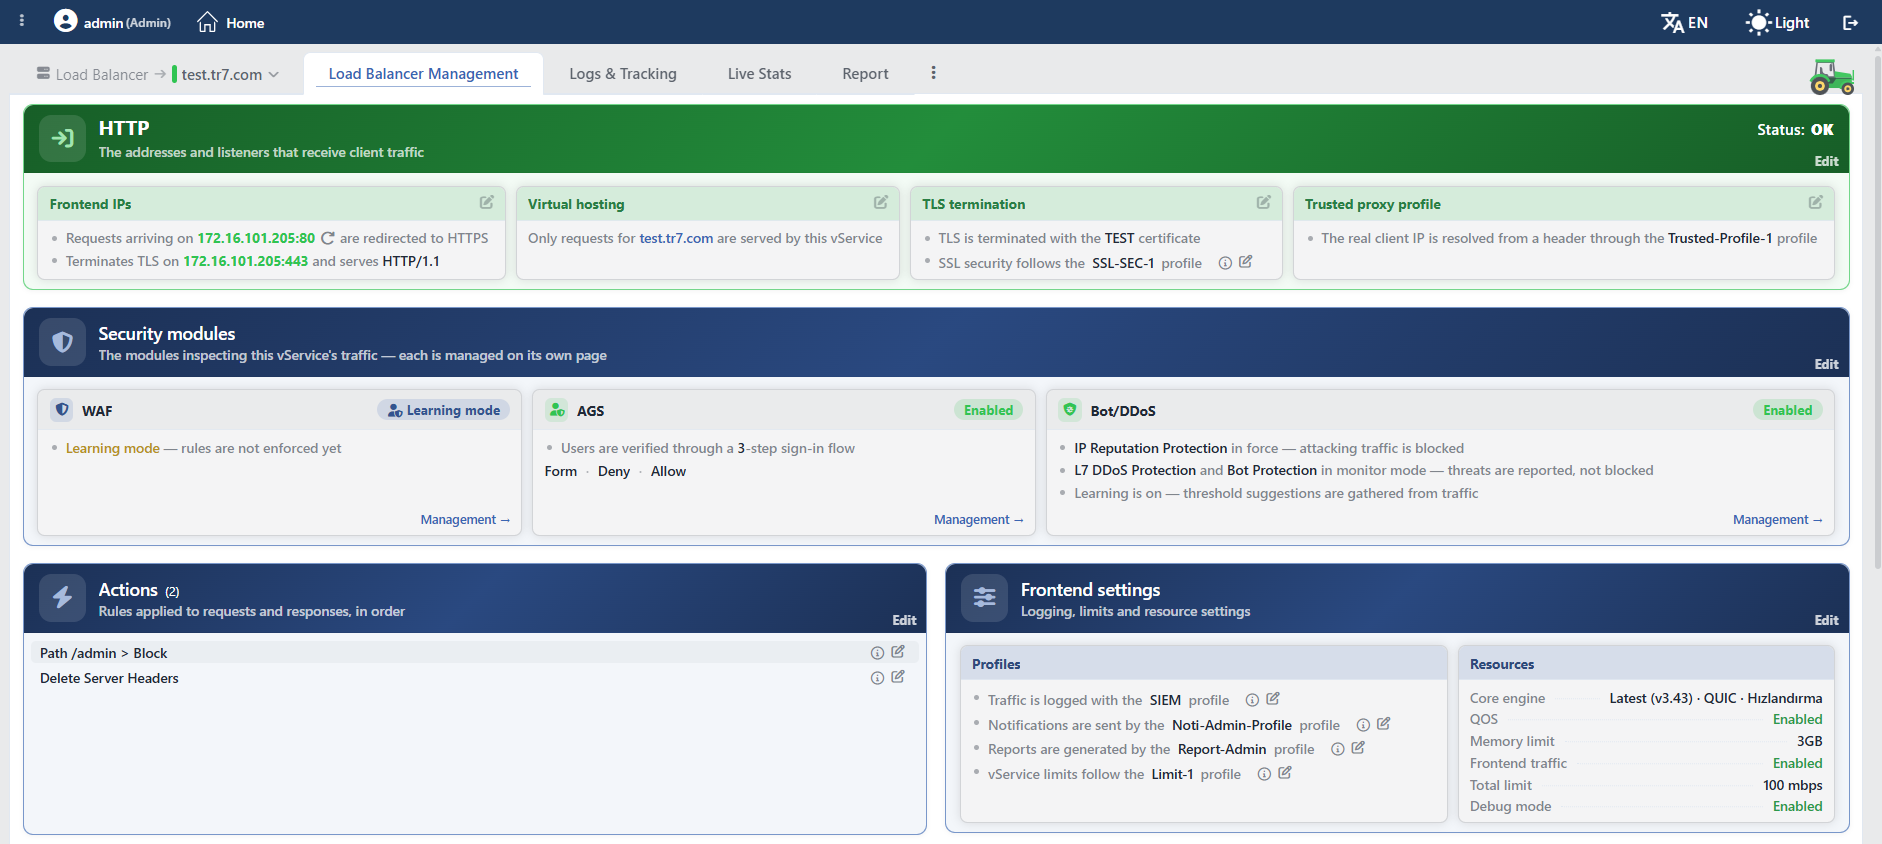 Load Balancer Management (upper sections)
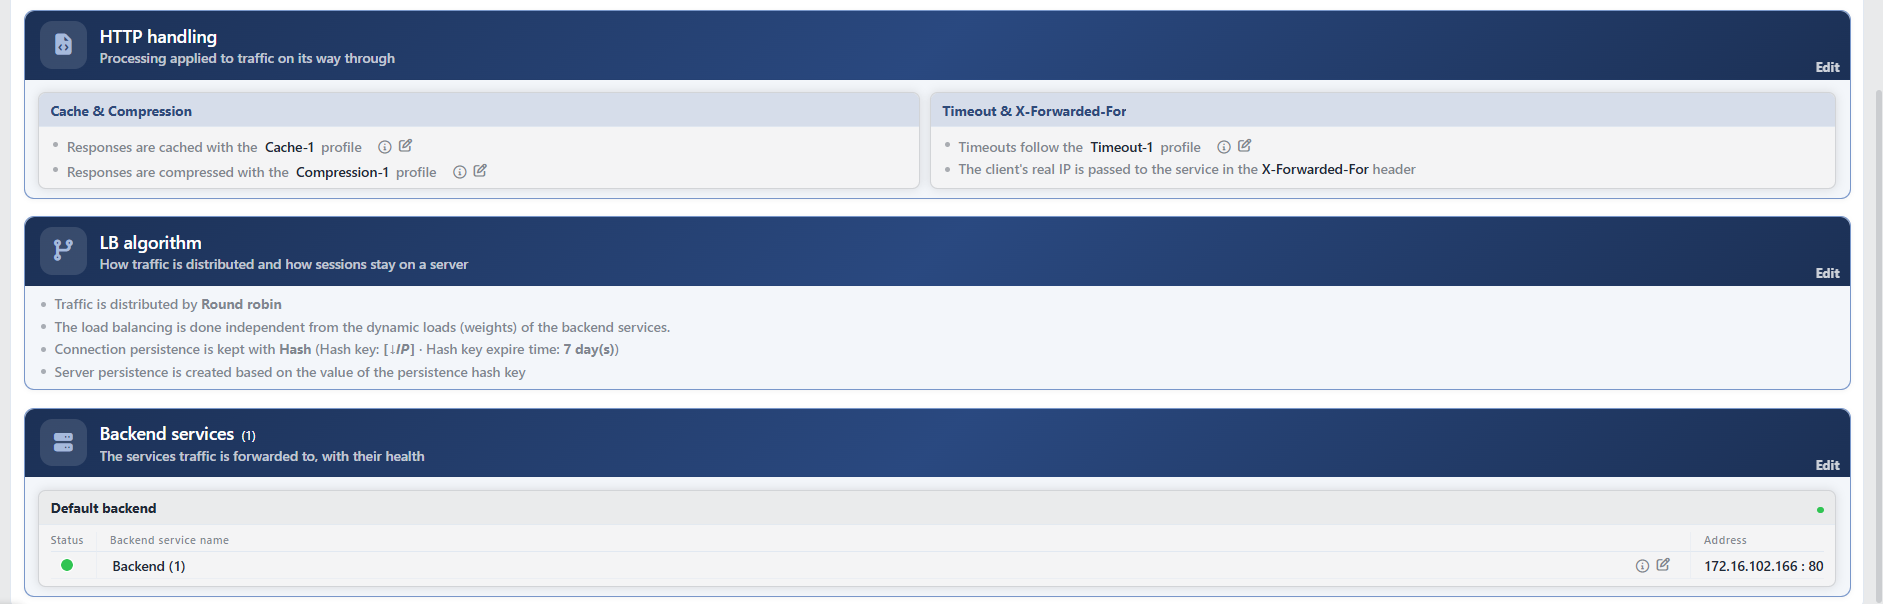 Load Balancer Management (lower sections)
Layout of the sections
The sections are arranged one below the other. The only exception is the Actions and Frontend Settings sections: if both are present, they share the same row and Frontend Settings determines the row's height; if the Actions list is long, it scrolls within itself. On narrow screens, this pair also moves one below the other.
Common Elements of the Screen
All seven sections use the same pattern: a header strip, and below the strip a list of sentences and/or boxes. The edit entry is displayed in two forms: in sections, an Edit text in the bottom right corner of the header strip, and in boxes, a pencil icon at the right end of the box title.
Section Header and Color
The title of the first section is the vService's type: HTTP, L7 TCP or Network. The strip color of this section is not fixed; it carries the vService's combined status, and the same status is also shown in text at the top right.
| State | Strip color | Status value |
|---|---|---|
| No issues | Green | OK |
| Warning | Amber | Warning |
| Error | Red | Error |
| Being evaluated | Accent color (with the spinning icon on the badge) | Evaluating |
| Off | The strip is not colored, a neutral header remains | Disabled |
The amber strip is shown flat and its text is black; on the OK, Error and Evaluating strips, the text is white. The strip of the remaining six sections always carries the theme's accent color (blue in the default theme) and contains no status indicator.
Edit Link
The header strip of each section has an Edit text, and the title of each of the four boxes in the entry section has a pencil icon. The boxes of the other sections have no separate edit entry; they are bound to the section's own Edit. The two entries behave differently:
| Where it is clicked | What opens |
|---|---|
| Edit of the first section titled with the type (HTTP / L7 TCP / Network) | The entire vService form opens as a closable Edit tab. Identity fields such as the vService type, zone and L4 network definition are edited only in this full form. |
| Entry of the other sections and boxes | The vService form opens as a window and is reduced to only the fields that belong to that section. If the section has a side field group, the group comes opened and brought to the center of the screen; no such focusing is done in Backend Services and Virtual Hosting, which carry only a single field. |
The form fields that the sections open are as follows:
| Section / box | Fields opened in the form |
|---|---|
| Section titled with the type | Full form (including identity fields) |
| Frontend IPs | Listener addresses, virtual domain names (together with the on/off switch), certificate, TLS security profile and L4 fields |
| Virtual Hosting | Virtual domain names |
| TLS Termination | Certificate and TLS security profile |
| Trusted Proxy Profile | Trusted Proxy profile |
| Security Modules | WAF, AGS and Bot/DDoS switches |
| Actions | Request and response rules |
| Frontend Settings | Log, notification, report, vService limits, QOS, bandwidth, engine and debug fields |
| HTTP Handling | Cache, compression, X-Forwarded-For, timeout and user tracking |
| LB Algorithm | Algorithm and persistence |
| Backend Services | Default and conditional Backend Service lists |
Inline ⓘ and Pencil Icons
At the end of the names of the log, notification, report, limit, cache, compression and timeout profiles, action rules and Backend Services mentioned in the sentences, there are two small icons:
| Icon | Function |
|---|---|
| Opens the quick view of that record. In profile sentences, the window is displayed on the right so that it does not cover the section; in action and Backend Service rows, the placement is determined according to the free space on the screen. | |
| Opens that record's own edit window. This window is not the vService form but the form of the related profile or rule. |
The pencil icon is not present on every row: it is not displayed on built-in default records, and only the quick view is offered on those rows. Certificate names and the name of the Trusted Proxy profile, on the other hand, carry no icons at all; they are written as bold plain text and are not opened from this screen.
Reading the Sentences
| Appearance | Meaning |
|---|---|
| Normal-colored sentence | The setting is defined and in effect. |
| Faded sentence | The setting is not defined. The row is still written, because knowing what has not been set is also information (e.g. Responses are not cached). |
| Sentence containing an amber phrase | The configuration is incomplete and affects traffic. The amber color is applied not to the whole sentence but to the phrase stating the missing part: TLS is terminated but no certificate is selected. |
Collapsing is applied in only two places: the Frontend IPs box shows at most six sentences, and the first section's own status sentences at most four; the rest are gathered behind the … N more row. The other boxes write all of their sentences. In the same way, Backend Service tables collapse at eight rows and the virtual domain name list at six names.
Entry Section (HTTP / L7 TCP / Network)
The first section of the screen describes the layer where traffic enters the vService: The addresses and listeners that receive client traffic. Its title is the vService's type; if the type cannot be read, the title becomes vService. The section first contains the vService's own status and warning sentences, followed by four boxes. The Frontend IPs box is always displayed (to give a warning if no address is defined); the other three boxes are displayed only if the related configuration exists.
Frontend IPs
A sentence is written for each of the listener addresses. The address is printed in bold and in the color of its operating status; when hovered over, which interface the address comes from and, in a cluster, additionally its counterpart on the peer device are read.
| State | Sentence |
|---|---|
| Redirection from HTTP to HTTPS | Requests arriving on <address> are redirected to HTTPS (a Redirect SSL marker in the shape of a circular arrow is added to the right of the address) |
| TLS termination | Terminates TLS on <address> and serves <protocol> |
| TLS termination + QUIC | Terminates TLS on <address> and serves <protocol>, offering HTTP/3 alongside |
| No TLS | Listens on <address> as plain <protocol> |
The protocol value is HTTP, HTTP/1.1 or HTTP/2 in HTTP vServices, and TCP or TCP + TLS in L7 TCP vServices. The protocol is not written in the redirection row. In the Network type, the protocol is one of the values ANY - L3, TCP - L4 or UDP - L4.
In Network type vServices, this box uses different sentences:
| State | Sentence |
|---|---|
| All ports | Answers every port arriving on <address> (<protocol>) |
| Port range | Listens on <address>, ports <range>, as <protocol> |
| Single port | Listens on <address>, port <port>, as <protocol> |
In addition to these come the rows that describe the distribution mode and the network definition: Traffic is distributed in <Direct Server Return / Route Mode / SNAT> mode, Requests reach the backend services with the source address <IP> if SNAT mode is selected and an address is given, and Runs on the <name> route table if a separate route table is used.
Incomplete configuration warnings
If no listener address is defined at all, a single amber sentence is displayed in the box: no frontend address is defined — this vService answers nothing. In the same way, if SNAT mode is selected and no address is given, the SNAT mode is selected but no SNAT address is selected warning is written.
Virtual Hosting
Displayed if a virtual domain name is defined for the vService: Only requests for <domain names> are served by this vService. The domain names become clickable links, and the service opens in a new tab, only in a vService of HTTP type and while there is a single open entry path (a single scheme with a single concrete port; redirecting listeners are not included in this count). For domain names with more than one entry path, using a port range or containing a wildcard character, only bold text is displayed. The list collapses after six names.
TLS Termination
| State | Sentence |
|---|---|
| Single certificate | TLS is terminated with the <name> certificate |
| More than one certificate | The certificate matching the requested name is served: <names> (only the first three names are written, the rest are added as + N more) |
| TLS is terminated but no certificate is selected | Amber: TLS is terminated but no certificate is selected |
| A certificate is selected but no address terminates TLS | Amber: Certificates are selected but no address terminates TLS |
Below it comes the TLS security profile row: SSL security follows the <name> profile. If the built-in default profile is used, the same sentence is written as plain text and carries no icon, since there is no record to open.
Trusted Proxy Profile
Displayed if a Trusted Proxy profile is assigned to the vService: The real client IP is resolved from a header through the <name> profile.
Security Modules
The modules inspecting this vService's traffic — each is managed on its own page
This section summarizes the vService's security modules and does not carry their details. The Management → link under each card leads to the related module's own management tab; the module's settings are described there. The link is displayed only while the module is enabled.
None of the cards has a separate pencil icon; since the three module switches live in a single form, editing is done with the Edit in the section header.
WAF
Displayed only in HTTP vServices. The badge carries the dominant mode of the host groups: Blocking Mode (red), Monitor Mode (amber) or Learning Mode (blue). The mode repeated most among the groups wins; in a tie, the mode of the default host group wins. If no host group is defined at all, the badge becomes Enabled. The badge also contains the mode's icon.
In the card body, if there is a single host group, that group's mode sentence is written, and if there is more than one group, the sentence Requests are evaluated in <N> host groups, each with its own WAF mode — <summary> is written. If learning is on, the Rules are being learned from live traffic by the Teacher and Conditional learning is on — rule suggestions are drawn from past traffic rows are additionally displayed.
Details: WAF Management.
AGS
Displayed only in HTTP vServices. The badge becomes only Enabled or Disabled. The body contains the sentence Users are verified through a <N>-step sign-in flow; <N> is the total number of actions defined in the sign-in chain. Below it, the badges of the steps in the chain (such as Form, Deny, Allow) are listed; if there is more than one step of the same type, the badge is summed with a count in the 2 Form format, and the list collapses at eight badges.
Bot/DDoS
Displayed in every vService type. The badge changes according to the mode of the protections: Enabled if at least one protection column is blocking, Monitor if all columns are only monitoring, and Disabled if the module is off. If all three columns are turned off even though the module is on, the badge stays Enabled and the card body appears empty.
In the body, the three protection columns (L7 DDoS Protection, IP Reputation Protection, Bot Protection) are written grouped by their modes: <names> in force — attacking traffic is blocked and <names> in monitor mode — threats are reported, not blocked. If learning is on, the Learning is on — threshold suggestions are gathered from traffic row is added, and in automatic learning the Automatic learning is on — thresholds tune themselves from traffic row.
Details: Bot/DDoS Management.
Actions
Rules applied to requests and responses, in order
Lists the Actions rules bound to the vService. The number in the title is the number of rule links in the vService record; a rule whose link remains but whose record has been deleted is included in the count but not in the list.
The order of the rows is the running order of the rules. The list is not split by request and response leg; it is given in the order kept by the record, that is, in the order the engine applies them. Each row contains the rule's name, with the quick view and edit icons at the end.
If no rule is defined at all, the section is still displayed and says No actions defined; the way to add the first rule is this section's Edit link.
This section does not exist in Network type vServices.
Frontend Settings
Logging, limits and resource settings
It consists of two boxes. The row set of the Profiles box does not change according to the vService's configuration: if a profile is not assigned, the row does not disappear; in its faded form, it gives the "not assigned" information. In the Resources box, on the other hand, rows are displayed while the related setting is on.
Profiles
| Row | If assigned | If not assigned |
|---|---|---|
| Log | Traffic is logged with the <name> profile | No log profile is selected |
| Notification | Notifications are sent by the <name> profile | No notification profile is selected |
| Report | Reports are generated by the <name> profile | No report profile is selected |
| vService limits | vService limits follow the <name> profile | No vService limits are applied |
In the notification and report rows, if additional profiles are also assigned next to the main profile, a +N suffix comes at the end of the row; the number here is the number of additional profiles. If the main profile is not selected, this suffix is not displayed even if there are additional profiles. In Network type vServices, only the notification row exists in this box.
Resources
Lists the vService's resource and engine settings as label/value pairs:
| Row | Meaning |
|---|---|
| Core Engine | The engine version the vService runs on; written only if an engine is selected. The value is taken as-is from the version catalog; for this reason, it is displayed however it is written in the catalog and does not change according to the interface language. When hovering over the row, the raw image name is displayed. |
| QOS | Whether resource isolation is on. |
| Cores | The number of cores allocated to the vService while QOS is on; if no core is assigned at all, the row is not written. |
| Memory Limit | The memory upper limit while QOS is on. |
| Cpu Usage Limit (%) | The processor usage upper limit while QOS is on. |
| CPU Priority | The priority while QOS is on: High, Normal or Low. |
| Frontend Traffic | Whether bandwidth limiting is on. |
| Total Limit | The total limit while bandwidth limiting is on. |
| Debug Mode | Exists only in HTTP vServices; shows whether Debug Mode is on. |
The Debug Mode row is shown to everyone
A vService with Debug Mode on keeps producing detailed records without it being noticed. For this reason, the row is always displayed regardless of the user's permission. The records produced are described on the Debug Logs page.
While QOS is off, the core, memory and processor rows are not written at all; while bandwidth is off, the Total Limit row is not displayed.
HTTP Handling
Processing applied to traffic on its way through
This section does not exist in Network type vServices. In L7 TCP vServices, only the timeout box is displayed and its title becomes Timeout.
Cache & Compression
Exists only in HTTP vServices.
| Row | If assigned | If not assigned |
|---|---|---|
| Cache | Responses are cached with the <name> profile | Responses are not cached |
| Compression | Responses are compressed with the <name> profile | Responses are not compressed |
Timeout & X-Forwarded-For
| Row | If assigned | If not assigned |
|---|---|---|
| Timeout | Timeouts follow the <name> profile | Default timeouts apply |
X-Forwarded-For | The client's real IP is passed to the service in the X-Forwarded-For header | The X-Forwarded-For header is not added |
The X-Forwarded-For row exists only in HTTP vServices.
LB Algorithm
How traffic is distributed and how sessions stay on a server
Describes how traffic is shared among Backend Services and how a client is kept on the same server. The section consists of two blocks: distribution and persistence.
The distribution row is in the form Traffic is distributed by <algorithm>. If the algorithm has adjustable parameters, they are added in parentheses as <label>: <value> pairs separated by ·; for example, the header name in header-based distribution, and the length and depth values in URI length-based distribution. Directly below it, the algorithm's own description is written as a faded row; if no description is defined, this row is skipped.
The persistence row takes one of three forms:
| State | Sentence |
|---|---|
| A persistence method is selected | Connection persistence is kept with <method> (in parentheses if it has parameters) |
| The algorithm is inherently persistent | <algorithm> pins a client to a backend by itself — no separate persistence setting is needed |
| No persistence | Faded: No connection persistence — every request is distributed anew |
When an inherently persistent algorithm is selected, a separate persistence row is not written at all; this is intentional, because the setting appearing empty would give the impression that something is missing.
The parameters of the persistence method also go into the same row: the cookie name and lifetime in the New cookie method, only the cookie name in the Current cookie method, the hash keys and key validity period in the Hash method, and the cookie source, cookie name and lifetime in SAM. Hash keys are written not with raw field names but with the short notation on the condition screens (e.g. ↓IP). Below the persistence row, the selected method's own description is also written as a faded row.
If hash consistency is on, the Hash consistency is on row and its description below it are additionally displayed. Since this setting can be configured only when an inherently persistent algorithm is selected, the row appears in practice under that branch.
In Network type vServices, the block is simplified: the L4 algorithm list (Round-Robin, Weighted Round-Robin, Least-Connection, Weighted Least-Connection, Locality-Based Least-Connection, Source Hash, Destination Hash and their replicated variants) is used, and persistence is given as a duration in the form A client keeps the same backend service for <duration>; if there is no persistence, the row becomes No connection persistence — every connection is distributed anew. If SIP persistence is on, the SIP sessions are pinned by their call id row is added. In this type, there is no algorithm parameter or hash consistency.
Weights are not shown on this screen
The weight values of the Backend Services are not listed row by row in this section; weight is mentioned only by the algorithm's own description text. Weights are displayed in the Backend Service definition.
Backend Services
The services traffic is forwarded to, with their health
Lists the Backend Services that traffic reaches in tables. The number in the title is the total of the rows in all branches.
The ordering is the traffic's decision order: first the conditional branches, and Default Backend comes last. Conditional branches can be defined only in HTTP and L7 TCP vServices; in the Network type, there is only the default branch. The title of a conditional branch is the branch's condition sentence itself; if no condition is defined, the title becomes Conditional backend services. A request is routed by looking at the conditions in order, and if none of them claims it, it falls to the default branch.
Each table has three columns:
| Column | Content |
|---|---|
| Status | A colored dot showing the Backend Service's health status; when hovered over, the status text is read. |
| Backend Service Name | The Backend Service's name, with the quick view and edit icons at the end. |
| Address | IP : port for single Backend Services; in a Backend Group row, the number of members (Total of N) is written instead of the address. |
The colors of the status dot:
| Color | Meaning |
|---|---|
| Green | The health check is positive. |
| Red | The health check has failed or the service cannot be connected to. |
| Amber | In maintenance mode, being prepared, or partially healthy for a group. |
| Gray | No health check is defined, it is ignored, there is no data, or the device on which the service is located is off. |
In the top right of each table, there are small dots that summarize the health distribution of the services in that branch. Three buckets are used: healthy, in trouble and not monitored; when hovered over, each bucket's name and the number of services in that bucket are read, and the service names are not listed. A bucket with a value of zero gets neither a dot nor text. If all the services in a branch are in the same bucket, the box's frame also takes that color.
A service in maintenance mode is counted as "in trouble"
A Backend Service put into maintenance mode is counted in the in trouble bucket in the health distribution. This is deliberate: since a service under maintenance does not respond to traffic, it is not counted as up in the capacity calculation.
A table shows at most eight rows, and the rest are gathered behind the … N more row; when this row is clicked, the table opens completely. If no Backend Service is defined at all, an amber warning is displayed instead of the table: No backend service is defined.
The conditional branch boxes do not have their own pencil icon; since a branch is not a separate record, editing is done from the section's Edit link or from the own icon of the record on the row.
Differences by vService Type
The rule of the screen is as follows: if a feature cannot be applied in that vService type, the row is not written at all; if it has been turned off by the user, the row remains and says that it is off. When sections drop out according to this table, the layout also changes: Actions and Frontend Settings share the same row only when both are present.
| Section | HTTP | L7 TCP | Network |
|---|---|---|---|
| Entry section | ✔ | ✔ | ✔ (with L4 sentences) |
| Virtual Hosting box | if defined | - | - |
| TLS Termination box | ✔ | ✔ | - |
| Security Modules | WAF · AGS · Bot/DDoS | Bot/DDoS only | Bot/DDoS only |
| Actions | ✔ | ✔ | - |
| Frontend Settings → Profiles | 4 rows | 4 rows | notification only |
| Frontend Settings → Resources | all | except Debug Mode | engine and bandwidth only |
| HTTP Handling | Cache & Compression + Timeout & X-Forwarded-For | Timeout only | - |
| LB Algorithm | ✔ | ✔ | with L4 algorithms |
| Backend Services | ✔ | ✔ | ✔ |
Scope and Limits
INFO
- The screen shows only the configuration. Traffic, error and performance measurements are in the Dashboard and Live Stats tabs. The live information on this screen is the vService's status badge and warning rows, the colors of the listener addresses and the health status of the Backend Services.
- The edit permission is the Load Balancer write permission. Without permission, the Edit texts of the sections and the pencil icons of the boxes are not displayed; the sections, sentences, tables and Management → links continue to be displayed completely. The own ⓘ and pencil icons of the records within sentences are not affected by this restriction.
- The detailed settings of the security modules are not changed here. The Edit of the Security Modules section opens only the on/off switch of the three modules; rule, mode and threshold settings are configured in the modules' own management tabs.
- The order of the sections is fixed and does not change according to the configuration; only the sections that cannot be applied drop out of the list.
- A disabled feature and an undefined feature look different. A disabled feature continues to state what it is with a faded row; a feature that does not exist at all in that vService type does not appear on the screen.
