
Smarter by Design.Simpler for Business
Server Response Time
What Is the Server Response Time Condition?
Server Response Time is a condition type used to make traffic manipulation decisions by evaluating in milliseconds (ms) the time it takes the Backend Service to respond to an HTTP request.
The measured duration is the time elapsed until the Backend Service produces the first complete response headers (similar to TTFB): the connection setup and the transfer of the response body are not included in this duration. This definition makes it possible to read the metric as "the thinking time of the server": large file downloads do not inflate the duration.
This condition can be evaluated only at the response stage.
WARNING
The Server Response Time condition works only at the Response stage. This condition cannot be evaluated before the Backend Service responds.
The Importance of the Server Response Time Condition
The Backend Service response time is a critical metric that directly affects the performance of the application and the user experience.
With the Server Response Time condition:
- Slow-responding Backend Services can be detected and marked with a header,
- SLA threshold values can be monitored and violations can be reported,
- An information page can be shown to the user for extremely slow responses,
- Response time based performance analysis can be performed,
- Traffic classification can be performed according to performance tiers.
Common Usage Scenarios:
| Scenario | Operator | Value | Action |
|---|---|---|---|
| Slow response detection | > | 2000 ms | Mark with a header |
| SLA violation | > | 200 ms | Mark with a header |
| Overload detection | > | 5000 ms | Information page |
| Performance analysis | - | 100-500 ms | Traffic monitoring |
Supported vService Types
HTTP
L7 TCP
Network
How to Add?
A new Server Response Time Condition can be added through the TR7 web management interface by following the steps below:
- The Configuration Menu is opened by clicking the TR7 logo at the bottom left.
- The Load Balancer → Conditions → Add steps are followed.
- Server response time is selected as Criteria.
- The related configurations of the condition are made.
- The condition is added by clicking the
Addbutton.
Server Response Time Condition Add Form
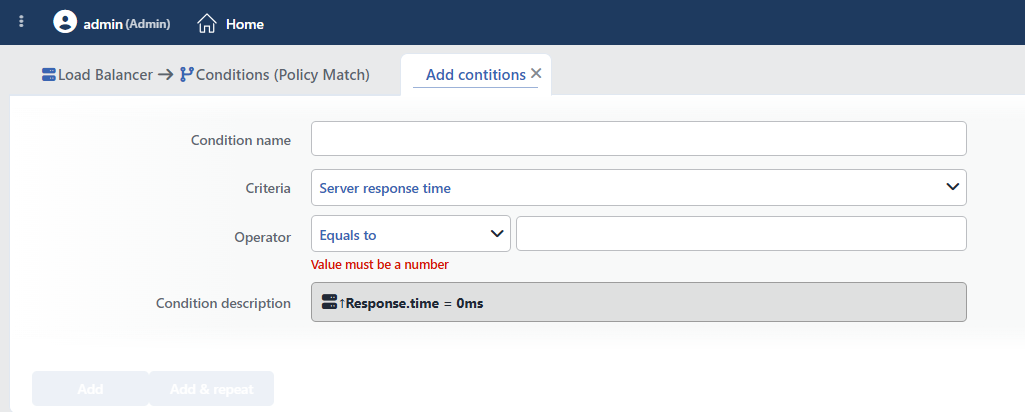 Server Response Time Condition Add Form
INFO
Condition Name
An optional name can be entered for the condition to be created.
This field is especially important in the following scenarios:
- When many conditions are defined under the same vService,
- When conditions with similar criteria need to be distinguished,
- When it is necessary to quickly understand which business rule the condition represents.
When this field is left empty, TR7 analyzes the content of the related condition and creates an automatic, descriptive name in the Condition Description field. This generated description is used as the name in condition lists.
INFO
Criteria Required
The field that determines the type of the condition; Server response time is selected from the searchable dropdown list. This selection determines the fields displayed in the form. The criterion cannot be changed after the condition is saved: if a different criterion is needed, a new condition is defined. For all criteria in the list and their scopes, the criteria catalog on the Conditions page can be referred to.
INFO
Operator
The numeric comparison operator and value are entered. The form opens with the operator Equals to (=) selected and the value empty; the entered value must be an integer.
| Operator | Symbol | Description |
|---|---|---|
| Less than | < | The value must be less |
| Equals to | = | The value must match exactly |
| Greater than | > | The value must be greater |
| Range | - | The value must be between two values; when selected, a second value field opens; both boundaries are included in the range |
TIP
Values are entered in milliseconds (ms); for example, for 2 seconds 2000 is written. In the automatic description, values of 1000 ms and above are shown converted to a readable unit (2000 → 2 seconds). The response time can be printed in log formats with the Response time of the backend service smart variable; the total duration seen by the client is a separate variable (Total connection time).
WARNING
If the connection drops before the response is completed, the duration value becomes negative; for this reason, Less than thresholds may also match interrupted/failed responses by mistake. This situation should be taken into consideration in "fast response" checks.
INFO
Condition Description
It is created automatically by TR7 in line with the entered criteria and values.
This description:
- which value the condition applies to,
- which criterion it works on,
- the quick understanding of the condition on listing screens
is produced dynamically by the system so as to provide these.
INFO
Form Buttons
Add
The condition adding process is completed by clicking the Add button.
Add & Repeat
With the Add & Repeat button, the condition adding process is completed, and another new condition can be added with different configurations without leaving the related window.
 Condition Added
Operational Usage Recommendations
- SLA Threshold Values Should Be Monitored. Threshold values appropriate for the SLA requirements of the application should be determined and violations should be reported.
- Graduated Thresholds Should Be Defined. Different actions should be defined for different response time thresholds (e.g. > 200ms SLA violation mark, > 2000ms slow response mark, > 5000ms information page).
- Performance-Based Analysis Should Be Performed. Performance analysis in downstream systems should be enabled by adding the response times to headers.
Common Usage Scenarios in Live Environments
The examples below show how the related condition is applied in the most frequently encountered use cases in real systems. These scenarios are based on practices that are widely preferred in live environments and rest on experience gained in the field.
Scenario 1: Slow Backend Service Detection and Marking with a Header
Purpose: To detect Backend Services whose response time exceeds 2 seconds, mark them with a header and monitor the performance drop.
Configuration: Operator → Greater than (>) 2000
Action Recommendations:
- ✅ Add HTTP Header → The
X-Slow-Backend: trueandX-Response-Time-Alert: exceeded-2sheaders are added, and downstream systems can detect the slow response. - ✅ Advanced Traffic Inspection → Slow-responding Backend Services, their response times and request details are reported.
Scenario 2: SLA Compliance Monitoring
Purpose: To detect requests that exceed the 200ms SLA threshold and mark them with a header.
Configuration: Operator → Greater than (>) 200
Action Recommendations:
- ✅ Add HTTP Header → The
X-SLA-Violation: trueheader is added, and monitoring systems can detect the SLA violation.
Scenario 3: Backend Service Overload Detection
Purpose: To detect that the Backend Service is under excessive load when the response time exceeds 5 seconds, and to show an information page to the user.
Configuration: Operator → Greater than (>) 5000
Action Recommendations:
- ✅ Show Content → The information page "The service response time is above normal, please try again later" is shown.
- ✅ Block → Extremely slow responses are blocked with 503, and the user is prevented from waiting for a long time.
Scenario 4: Performance Tier Analysis
Purpose: To perform performance tier analysis by classifying the response time according to specific ranges, and to monitor requests showing medium-level performance.
Configuration: Operator → Range (-) 100-500
Action Recommendations:
- ✅ Advanced Traffic Inspection → Requests in the 100-500ms range are reported as "medium-tier", and the performance distribution is analyzed.
- ✅ Add HTTP Header → The
X-Performance-Tier: mediumheader is added, and the performance tier information is transmitted to downstream systems.
