
Smarter by Design.Simpler for Business
Notification Logs
What Is Notification Logs?
Notification Logs is the central monitoring log that records the system events, the infrastructure status changes and the service alerts that occur on the TR7 device in chronological order. The exceeding of the resource thresholds such as CPU/memory/disk, the network interface and VIP status changes, the cluster connection and the vDevice events are monitored retrospectively from this screen.
When the notification infrastructure of TR7 detects an event, it both creates a notification record and (if the related notification profile is configured) delivers it to the related people through the defined channels (e-mail, SMS, SNMP, interface). This screen offers the central history of all of these events and provides the monitoring of the system health and the infrastructure integrity. Whether a notification will be generated for an event and the threshold values are defined from the Notification Management screen.
01 · DetectThe event is detectedA CPU/memory threshold, a service, VIP or cluster status
02 · GenerateThe notification is createdThe related notification profile and the threshold values are checked
03 · DeliverIt is sent to the channelsE-mail · SMS · SNMP Trap · Interface
04 · RecordIt is written to the logA permanent, non-deletable notification history
Every notification record contains the following information:
- The notification type: Which category the event belongs to (e.g. Bandwidth, Backend Service status)
- When: The date and time the event occurred
- Which device: The TR7 source on which the event occurred (Source)
- What happened: The descriptive text of the event
- Who was notified: Through which channels (e-mail, SMS, SNMP) the notification was delivered
Events
System & infrastructure
Threshold breaches, status changes, alerts
Permanent
Non-deletable record
Retained since the initial installation
Channels
Delivery status
E-mail · SMS · SNMP · Interface
Monitoring
Health & performance
The resource, service and cluster events
Permanent Record
The Notification Logs are retained permanently from the initial installation of the device onward. A manual deletion operation cannot be done. In this way a complete history of the infrastructure events is provided.
Forwarding to an external system (SIEM)
The notification logs can also be forwarded to an external Syslog server or to a SIEM system with Log Forwarding (Log Sources → Notification Logs).
Why Are the Notification Logs Important?
The Notification Logs are the basic component of monitoring the health, the performance and the infrastructure integrity of the TR7 device. Thanks to these logs:
- The critical threshold breaches in the system resources (CPU, memory, disk, bandwidth) can be detected,
- The availability history and the downtime of the Backend Services can be monitored,
- The connection drops and the pairing problems between the devices in the cluster environments can be analyzed,
- The network interface and VIP status changes can be examined chronologically,
- The root cause and the timeline of the events can be determined during the troubleshooting processes.
Notification Types
The system events that occur on the TR7 device are monitored automatically and are logged as a notification. The notification types monitored:
System Resources:
| Notification Type | Key | When it is triggered |
|---|---|---|
| CPU usage | cpu | When the CPU utilization rate exceeds the defined threshold |
| Memory usage | mem | When the memory utilization rate exceeds the defined threshold |
| Disk | disk | When the disk utilization rate exceeds the defined threshold |
| Bandwidth | bw | When the bandwidth consumption exceeds the defined threshold |
Network and Infrastructure:
| Notification Type | Key | When it is triggered |
|---|---|---|
| Interface status | interfaceState | When the status of a network interface changes (up/down) |
| IP status | ipStatus | When the status of an IP address changes |
| TR7 IP state | tr7Ip | When the status of the TR7 cluster IP changes |
| VIP status | vrrp | When a failover occurs on the cluster virtual IP (VIP/VRRP) |
| VIP connection status | tr7InterfaceClusterIpConn | When the cluster IP (VIP) connection over an interface changes |
| GW health status | tr7InterfaceGw | When the gateway health status over an interface changes |
Load Balancing (Traffic Manager):
| Notification Type | Key | When it is triggered |
|---|---|---|
| Backend service status | backendStatus | When the health check result of the Backend Service changes (healthy/not healthy) |
| vService status | poolStatus | When the overall status of the vService changes |
| vService statistics | poolStat | When the traffic statistics of the vService exceed the defined threshold values |
| Certificate status | poolCert | When the SSL/TLS certificate assigned to the vService is about to expire or has expired |
| Configuration error | poolAlert | When an error is detected in the vService configuration |
| Internal sync error | poolInternalError | When an error occurs in the internal synchronization of the vService |
vDevice:
| Notification Type | Key | When it is triggered |
|---|---|---|
| vDevice status | zoneStatus | When the status of a vDevice (zone) changes |
| vDevice service status | zoneSocket | When the connection status of the services on the vDevice changes |
| Health check | hc | When the status of a service/resource changes as a result of a health check |
Cluster:
| Notification Type | Key | When it is triggered |
|---|---|---|
| Cluster connection | clusterConn | When the cluster connection between the two TR7 devices changes (up/down) |
| Cluster synchronization | clusterDbSync | When the configuration synchronization status between the devices changes |
Security and Services:
| Notification Type | Key | When it is triggered |
|---|---|---|
| IP Intelligence & Reputation Data | ipRep | When the IP reputation database has never been loaded or has stayed older than the determined period |
| NTP Synchronization | ntp | When the device clock loses the NTP synchronization or exceeds the deviation threshold |
| User Action | userLog | When a monitored user operation occurs |
| WAF Rule Compilation | wafCompile | When the WAF rule compilation encounters a problem |
| Health Check Service | hcStale | When the health check service stops producing data |
| Health Check Connection | hcConn | When the connection status with the health check service changes |
| WAF Attack Rate | wafRate | When the WAF attack rate threshold is exceeded |
| Advanced WAF Notification | wafAdvn | When an advanced WAF notification (window/threshold) is triggered |
| Threat Protection State | tpState | When the traffic protection status changes |
| Country Traffic | tpCountry | When the country-based traffic threshold is exceeded |
| Network Type Group Traffic | tpNettype | When the network type group traffic threshold is exceeded |
| Advanced Protection Notification | tpAdvn | When an advanced protection notification (window/threshold) is triggered |
| Access Gateway | agsStat | When the AGS status changes |
| Access Gateway Engine | agsEngine | When the AGS engine status changes |
| Cloud HA | cloudHa | When the status of the cloud (Azure) HA components changes |
User events
The operations performed by the users (login/logout, failed login, configuration changes) are monitored on the User Logs screen.
The Notification Delivery Channels
When a notification is generated, it is delivered to the recipients in the contact groups assigned to the profile, through the channels selected in the related notification profile (Notification Action). The available channels and the delivery methods:
| Channel | How it is sent |
|---|---|
| Notify UI | The notification is broadcast instantly to the web interface clients connected at that moment and is shown in the notification panel. |
| Send E-Mail | The notification is sent to the e-mail addresses in the contact groups using the global SMTP settings of the device (E-mail Settings). |
| Send SMS | The notification is delivered as an SMS to the defined phone numbers. |
| SNMP Trap | The notification is sent as an SNMP trap to the destination defined in SNMP Settings. |
In the Notification Contacts column of the Notification Logs table, the e-mail and SMS deliveries of the notification are shown with icons per channel: if the delivery is successful the icon appears green, and if it fails red, and the number of recipients is written on the icon. When the icon is hovered over, the recipient list, the content sent and (if it failed) the error detail are displayed. The Notify UI and SNMP Trap deliveries are not listed in this column.
The Delivery Channel Configuration
The notification delivery channels are configured separately for every notification type from the Notification Management screen. The notification types whose channel is not configured are only recorded in the log.
Operational Usage Recommendations
- The critical notifications should be monitored continuously. The Backend Service status, Cluster connection and vService status notifications in particular should be reviewed regularly; these are the early indicators of the service interruptions.
- The delivery channels should be configured. The e-mail and SMS channels should be configured for the critical notification types; relying only on the interface notification may cause the events to be missed while there is no active session.
- The threshold values should be adjusted according to the environment. The CPU, memory, disk and bandwidth thresholds should be determined appropriately for the capacity and the traffic profile of the device; the default thresholds are suitable for general use but may need to be adjusted in heavy traffic.
- The Source column should be followed in the cluster environments. The Source column shows on which device the event occurred; it is critical for determining whether the recurring problems are specific to a particular device or not.
- They should be archived with periodic exports. For the long-term trend analysis and the compliance reporting, the notification logs should be archived as Excel/CSV at regular intervals.
Notification Logs Listing Screen
By following the path Settings → System Logs → Notification Logs, the notification logs on the TR7 device are listed.
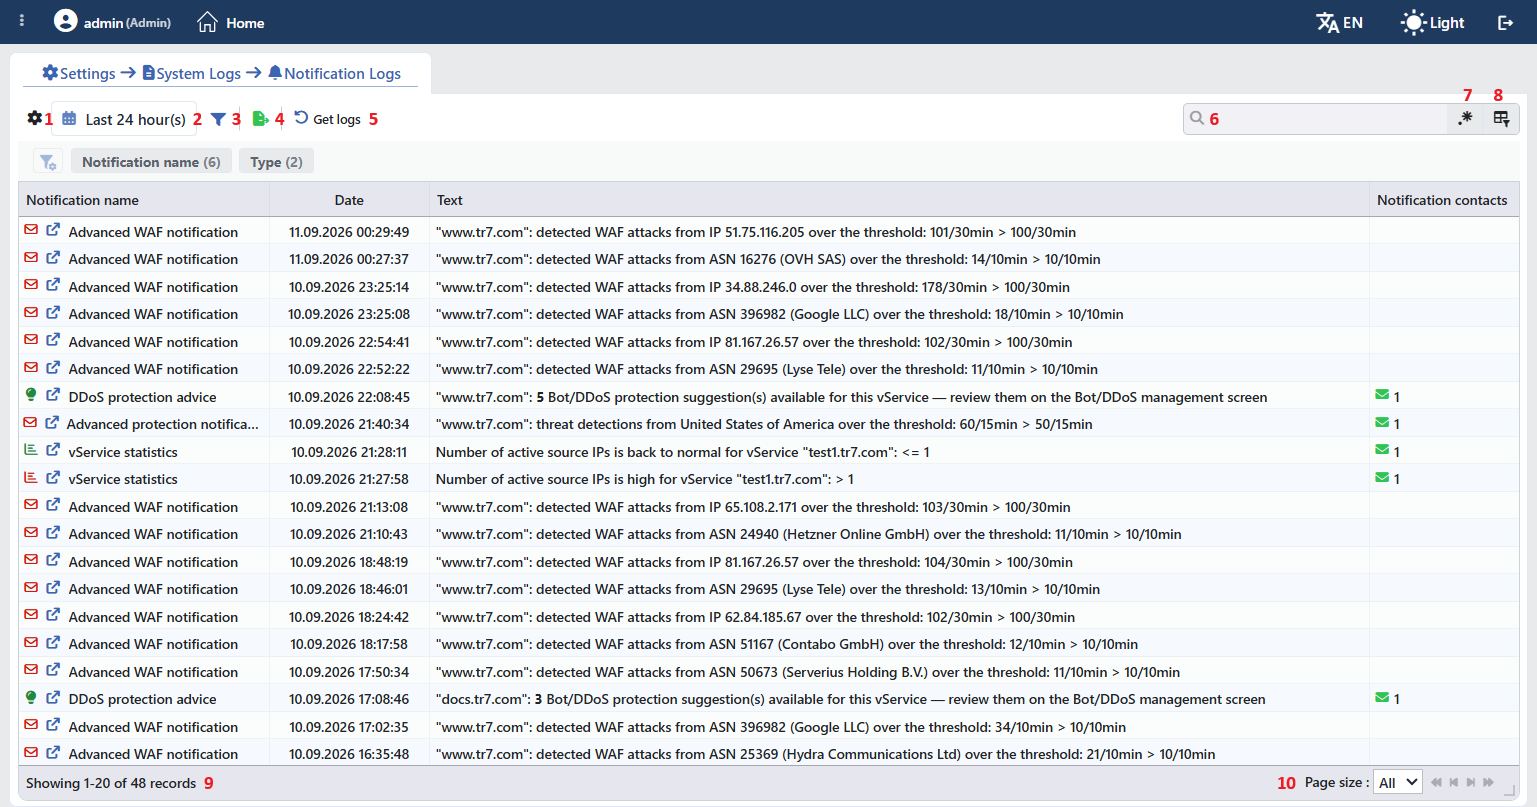 The Notification Logs Listing Screen
The table opens with the following columns by default:
| Column | Description |
|---|---|
| Notification Name | The name of the notification. The icon at the beginning of the row is colored according to the notification severity level: Alarming red, Info dark, OK green. If the screen the notification is related to can be resolved, the Go to Related Page icon appears next to the name and when it is clicked, that page is gone to. |
| Date | The date and time the notification was generated. |
| Text | The body text of the notification; the value that exceeds the threshold and the comparison are also written in this text (e.g. 101/30min > 100/30min). |
| Notification Contacts | The contact groups the notification was sent to; they are shown with the channel icon and the number of recipients. On the notifications that are only shown in the interface (Notify UI), this cell stays empty. |
The Source column is displayed only in a cluster setup; it shows on which device the event was generated.
The items in the toolbar are arranged from left to right in the following order; the last two items (Page Information and Page Size) are located in the information strip below the table.
Columns
Which columns will be shown in the table is selected. In the same panel the columns are reordered by dragging, the alignment is selected per column, a manually set column width is returned to automatic sizing by clicking, and with the Reset button the column layout is returned to the default. The layout is stored per user.
Time Range
The time range for which the logs will be displayed is selected. The predefined ranges: 5 min · 15 min · 1 hour · 3 hours · 6 hours · 1 day · 7 days · 1 month. In addition, a free period (in the hour/day/week/month/year unit) can be selected with Custom Duration or a start-end date (including the hour/minute) from the calendar with Custom Date Range. Default: The last 24 hours.
Filter
The Filter button is used to filter the logs shown in the list according to certain criteria. The criteria offered: Type (the notification severity level: Alarming / Info / OK) and Notification Name (multiple selection). The filtering view can be customized: which filters will be shown can be selected, their order can be changed and the layout is saved to the user account.
Export
By clicking the Export button, the table is exported as Excel, CSV or PDF according to the desired data columns.
Get Logs
It loads the logs from the server according to the selected time range. By clicking the Get Logs button, the notification logs within the determined date range are listed. The logs are not updated automatically; in order to see the new logs, the button must be clicked again.
Search
Used to search all information in the table.
RegExp Search
Used to search all information in the table with a regular expression (RegExp).
Column Based Search
Used to perform a column-based search on the information in the table.
Page Information
Information about the total number of notification logs and the range of records displayed in the list takes place.
Page Size
The maximum number of records to be displayed on the page is selected; on this screen the default comes as All (all the records on a single page). The arrow icons are used to navigate between the pages.
The visibility and the read information
The records listed are filtered according to the permission of the user: a record is displayed only if the user has full permission in the related area or if the record belongs to an object (vService/vDevice) assigned to the user; two different users may see different sets of records on the same screen. When the screen is visited, the notifications are counted as seen and the notification badge in the interface is reset.
The Notification Panel (Quick Access)
The notification panel in the bottom right corner of the TR7 web management interface makes it possible to display the latest system events instantly.
The status bar instantly shows the result of the most recently performed operation (e.g. "Created LB frontend service successfully"). By clicking the message icon on the right, the notification panel is opened.
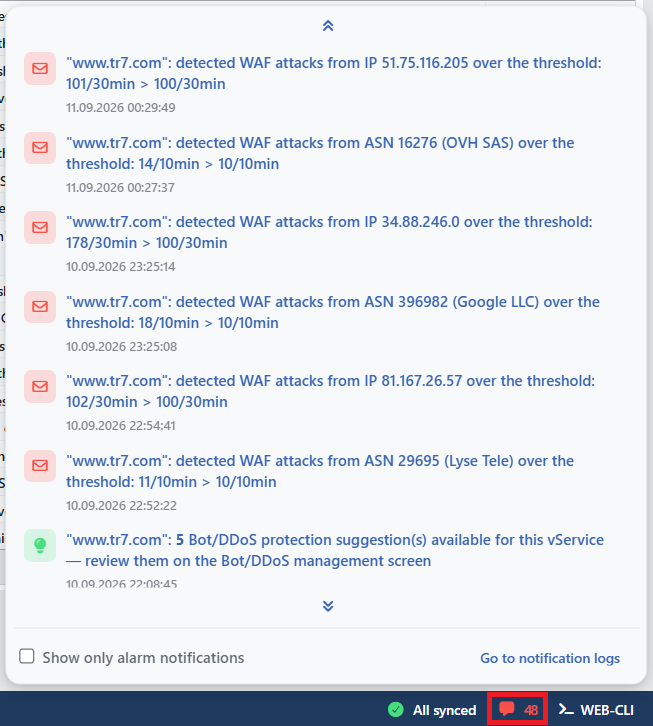 The Notification Panel (Quick Access)
In the notification panel the latest notifications are listed in chronological order. At the bottom of the panel:
- Show only alarm notifications: When it is checked, only the notifications of an alarm nature (threshold breaches, service interruptions, connection drops etc.) are shown; the informational ones are filtered out.
- Go to notification logs: It navigates to this screen on which all the notification logs are displayed in detail.
Instant Monitoring
The notification panel provides the instant tracking of the device events without the need to refresh the page; the critical infrastructure changes are monitored from this panel immediately.
