
Smarter by Design.Simpler for Business
Quarantine
What Is the Quarantine Action?
The Quarantine action tracks the incoming requests according to certain keys and temporarily restricts the access of the clients that meet the determined conditions (IP address, User-Agent combination, etc.). This action provides automatic protection against DDoS attacks, brute-force (DoS) attempts and abnormal traffic behaviors.
This action can work both at the request and at the response stage and can be used both on HTTP and on L7 TCP vServices.
TIP
At most five Quarantine actions can be defined on a vService. When this limit is exceeded, the actions defined in excess are not put into effect, without any warning being given; for this reason, different scenarios should be managed within a single action with conditions as much as possible.
How Does the Quarantine Action Work?
The Quarantine action applies a three-stage protection mechanism:
1. Tracking
Client metrics are collected (number of requests, bandwidth, etc.)
2. Evaluate
Conditions are checked (e.g. >100 requests/min)
3. Quarantine
The client is blocked for a certain period.
Stages:
| Stage | Description | Duration |
|---|---|---|
| Tracking | The client metrics (number of requests, bandwidth, etc.) are collected | Tracking Time |
| Evaluate | The quarantine conditions are checked | Instant |
| Quarantine | The client/clients that meet the conditions are blocked | Quarantine Time |
Detailed Logging
Within the scope of the Quarantine action, the information that is tracked, that is, the information selected in the Tracking Key field, and the data of the clients placed under quarantine are kept on TR7 in two separate log structures. Thanks to this structure, both the monitoring of the clients according to the determined information and the management of the clients that are actively in quarantine can be carried out separately.
The first log structure relates to the tracking stage. These logs contain the metrics collected according to the determined tracking keys (number of requests, number of connections, amount of data, etc.) and make visible the behavior of the clients that have not yet triggered the quarantine conditions but are under monitoring. In this way, the clients that can pose a potential threat can be analyzed before they are placed under quarantine.
The second log structure belongs to the clients that have been placed under quarantine. The clients on which the action has been applied by meeting the quarantine conditions are listed in this table. Here, information such as the quarantine start time, the quarantine end time and the IP address of the client is located.
Both log structures can be viewed through the TR7 web management interface. The operators can monitor the tracked clients and the clients in active quarantine instantly, analyze the attack behaviors and intervene operationally when necessary. In addition, a client that has been placed under quarantine can be manually released from quarantine through the web interface. This feature makes it possible to resolve false positive situations quickly and to preserve service continuity.
Detailed information is in the How Are the Collected Data Viewed? section on this page.
The Importance of the Quarantine Action
Automatic protection against abnormal traffic behaviors is critically important.
The Quarantine action;
- automatically detects and blocks DDoS attacks,
- limits brute-force attempts on a request basis,
- prevents bandwidth consumption attacks,
- provides rate limiting at the application level,
- applies selective protection with conditions,
- tracks different client types (IP, IP+UA, Host+IP) separately.
For this reason, the Quarantine action is a basic component for the security of web applications.
Supported vService Types
HTTP
L7 TCP
Network
Execution Timing
On Request
On Response
How to Add?
A new Quarantine Action can be added through the TR7 web management interface by following the steps below:
- The Configuration Menu is opened by clicking the TR7 logo at the bottom left.
- The Load Balancer → Actions → Add steps are followed.
- A unique and descriptive name is entered for the action.
- Quarantine is selected as Action Type.
- The related configurations of the action are made.
- In the Conditions tab, the condition/conditions under which the action takes effect are determined.
- The action is added by clicking the
Addbutton.
Quarantine Action Add Form
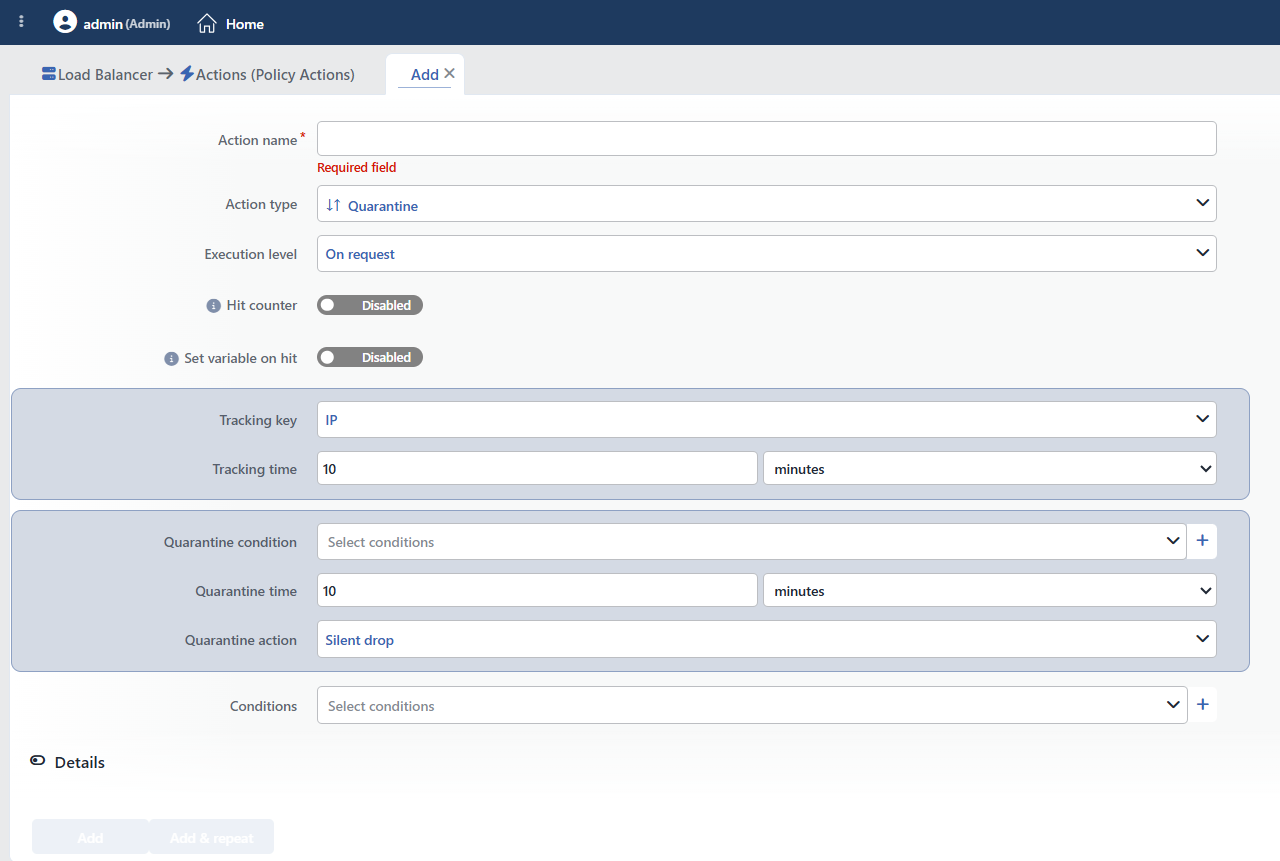 Quarantine Action Add Form
INFO
Execution Level
Determines at which stage the action is run.
- On Request: The action is applied before the request is forwarded to the related Backend Service. This level is used in cases where changes need to be made to the request or additional information needs to be passed to the Backend Service.
- On Response: The action is applied before the response is forwarded to the client. This level is used in cases where edits or additions need to be made to the response sent to the client.
INFO
Hit Counter Default: Off
Hit Counter counts every run of the action (it is evaluated together with the action's own condition; the count is not lost even in terminating actions such as Deny). Action-based rates and totals are displayed in the Action Hits tab of the vService dashboard and on the live statistics screen; they do not appear as a separate column in the lists. The counter is cumulative; there is no interface for resetting it manually: it starts from zero when the set of counted actions changes or when the vService is reloaded, while the history is preserved on the dashboard as a rate (hit/s).
In this action, the counter increases not during tracking but when the quarantine operation is applied.
INFO
Set Variable on Hit
A variable name whose value is assigned each time the action runs can be entered (optional; empty by default). The name can consist of letters, digits and underscores (at most 32 characters). When the action is triggered, the variable is set to 1, and chained behaviors can be built by reading it with the %TR7VAR(name) smart variable in other conditions and actions on the same vService.
INFO
Tracking Key Default: IP
The key/keys to be used to track the incoming requests are selected in this field. This key determines on which client basis the quarantine evaluation will be made.
WARNING
If TCP is selected as Rule protocol in the Details section, only the IP and Manual options are offered; the options containing V-Host and User-agent are removed from the list.
The options that can be selected by default:
| Tracking Key | Description | Use Case |
|---|---|---|
| IP | Tracking only according to the source IP address | General DDoS protection |
| IP + User-agent | The combination of the IP and the browser information | Bot detection, advanced protection |
| V-Host + IP | The combination of the virtual host and the IP | Multi-tenant environments |
| V-Host + IP + User-agent | The most detailed combination (recommended) | Maximum granularity |
| Manual | A custom Variables combination | Customized scenarios |
TIP
- IP: The simplest and most performant option. It is suitable for most scenarios.
- IP + User-agent: In order to distinguish the different browsers coming from the same IP.
- Manual: In order to track according to custom values such as the session ID and the user name.
Quarantine Keys to Track
When manual tracking is selected, the Smart Variables to be tracked are determined. More than one value can be selected.
TIP
This field supports Smart Variables. Existing variables can be accessed with the fx button and dynamic content can be created.
Sample variables: Source IP, Source Port, Request Header, Request Cookie, Path, Query String, Host; fixed text values can also be entered.
Detailed information is on the Variables page.
 Quarantine Keys to Track (Manual) Example
Sample combinations:
[Source (client) IP address]: The source IP[Source (client) port]: The source port[Request header: X-Forwarded-For]: The real IP behind the proxy[Request cookie: session_id]: The session ID
INFO
Tracking Time Default: 10 minutes
The period during which the client metrics will be collected is determined. During this period, the selected metrics such as the number of requests and the bandwidth usage are tracked. Seconds, Minutes or Hours can be selected as the unit; the value must be between 1 second and 360 hours.
Sample values:
| Period | Use Case |
|---|---|
| 1 minute | Fast detection, instant attacks |
| 5 minutes | Balanced protection |
| 10 minutes | Long-term behavior analysis |
| 1 hour | Low-intensity attacks |
WARNING
Tracking Time determines the period of the rate calculations in the quarantine conditions. For example, a tracking time of at least 1 minute is necessary for the "100 requests/minute" condition.
INFO
Quarantine Condition
The conditions that must be met for the client to be placed under quarantine are selected. Only Quarantine Condition can be used here. More than one condition can be combined with the AND or OR operators.
 Quarantine Condition
 The AND Operator
 The OR Operator
The (+) button is clicked in order to add a condition and the form below opens:
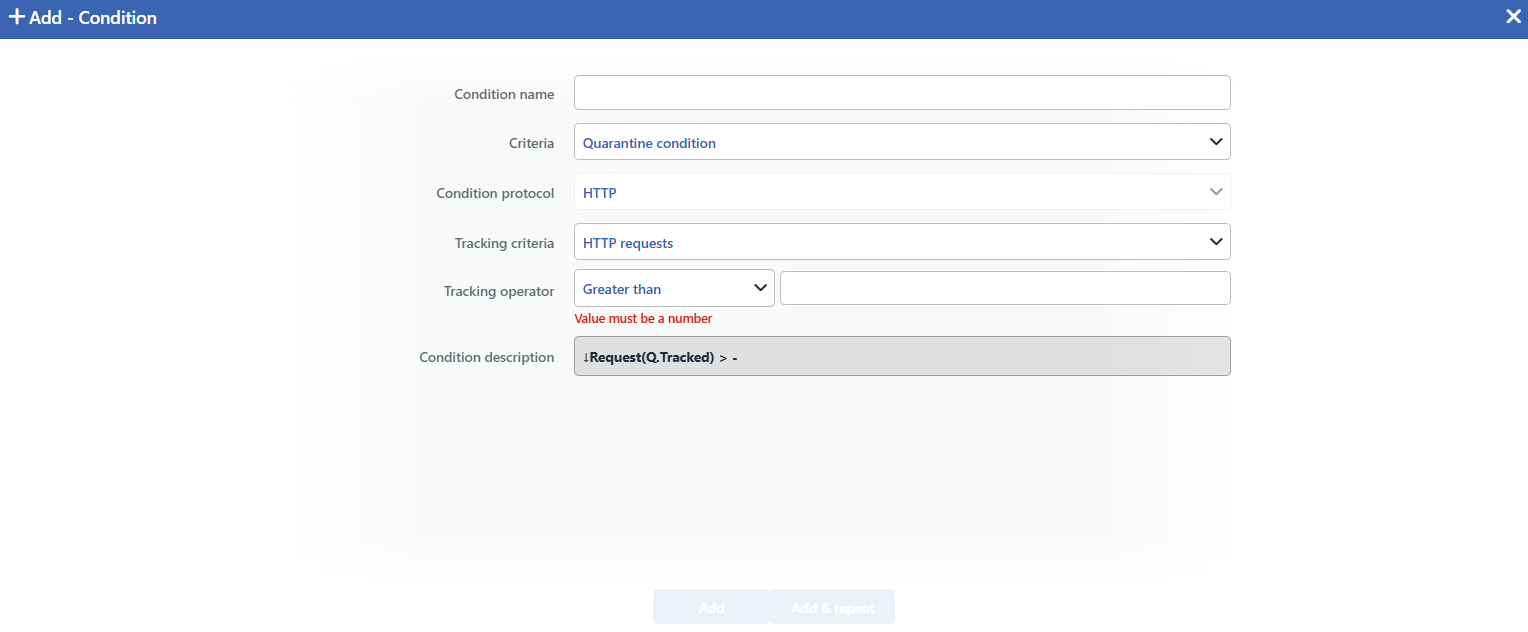 Quarantine Condition Add Form
Tracking Criteria:
| Criterion | Description | Sample Use |
|---|---|---|
| HTTP Requests | The number of HTTP requests within the Tracking Time | > 1000 requests |
| HTTP Errors | The number of HTTP errors within the Tracking Time | > 100 errors |
| Incoming Data (B) | The amount of data coming in within the Tracking Time | > 100 MB |
| Outgoing Data (B) | The amount of data going out within the Tracking Time | > 500 MB |
| Total Connections | The total number of connections within the Tracking Time | > 200 connections |
| Current Connections | The instant number of connections within the Tracking Time | > 50 connections |
TIP
More sensitive rules are created by using more than one condition:
HTTP requests > 1000 AND HTTP errors > 50: Both high traffic and high errorsConnection current > 100 OR Data > 1GB: Many connections or a lot of data
INFO
Quarantine Time Default: 10 minutes
The period during which the client that meets the conditions will remain in quarantine is selected. During this period, the client is dropped, redirected or shown a custom content page according to the selected operation. Seconds, Minutes or Hours can be selected as the unit; the value must be between 1 second and 360 hours.
The period runs from the last violation
As long as the client in quarantine continues to meet the condition, the period is renewed. The quarantine is lifted this much time after the moment the condition was met for the last time.
Recommended values:
| Period | Scenario |
|---|---|
| 1 minute | Test/development environment |
| 5 minutes | Normal attacks |
| 30 minutes | Persistent attackers |
| 1 hour | Serious attack attempts |
| 24 hours | Repeating attackers |
INFO
Quarantine Action Default: Silent drop
The operation to be applied to the client placed under quarantine is selected.
WARNING
The Redirect and Show content options are offered only for HTTP rules. If TCP is selected as Rule protocol in the Details section, only Silent Drop can be used; if a value has been selected before, it silently returns to Silent Drop.
In TCP rules, Silent Drop does not drop the connection silently; the connection of the client in quarantine is closed by being refused.
Silent Drop Default
When it is selected, the requests coming from the client placed under quarantine are dropped without a response being produced; the client sees a connection timeout.
Use case: DDoS attacks, bot traffic
Redirect
When Redirect is selected, the client placed under quarantine is redirected to the specified URL.
 The Redirect Option and the Location Field
Redirect Location: The URL to which the client placed under quarantine will be redirected.
WARNING
The redirection is made as a permanent redirect (301); the status code cannot be selected.
The variable list may not open in this field; the target address must be written as fixed text.
Use case: Rate limiting page, CAPTCHA verification
Show Content
When Show Content is selected, a custom content page is shown to the client placed under quarantine.
 The Show Content Option and Its Settings
Quarantine content: It is the content page that will be shown. The ready Quarantine page (English) is selected by default; with the + button next to the list, a new content page can also be created without leaving the form. The pages are also managed in the Content Pages section.
Quarantine status code: It is the HTTP status code that will be returned to the client. All the HTTP status codes are in the list; the default is 401.
Common preferences for the quarantine response:
- 401 Unauthorized: Unauthorized (default)
- 403 Forbidden: Access forbidden
- 429 Too Many Requests: Too many requests
Use case: Custom error pages, user information
INFO
Conditions
In this field, it is defined under which condition or conditions the related action takes effect.
By adding one or more conditions, the behavior can be applied in a targeted and controlled way with the and/or structure.
Detailed information about conditions is on the Conditions page.
WARNING
If no condition is defined in this field, the related action runs unconditionally (Always). In this case, the action is applied to all traffic coming to the related vService.
In live environments, using an action without defining a condition can lead to unexpected situations (service outages). For this reason, it is recommended that at least one condition always be defined when an action is created.
INFO
Details
It is selected for which vService type the added Quarantine action will be created. HTTP is used by default.
- HTTP
- TCP
INFO
Form Buttons
Add
The action adding process is completed by clicking the Add button.
Add & Repeat
With the Add & Repeat button, the action adding process is completed, and another new action can be added with different configurations without leaving the related window.
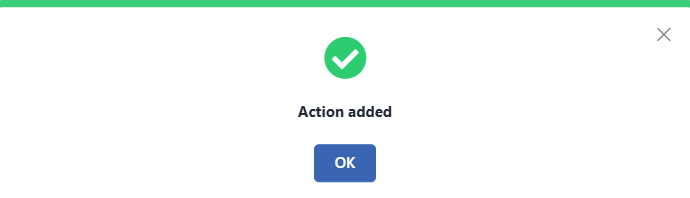 Action Added
How Are the Collected Data Viewed?
The data collected by the Quarantine action can be viewed from the Logs & Tracking tab of the vService. The data are presented in two separate tables, Quarantine Logs (Tracking) and Quarantine Logs (Quarantine).
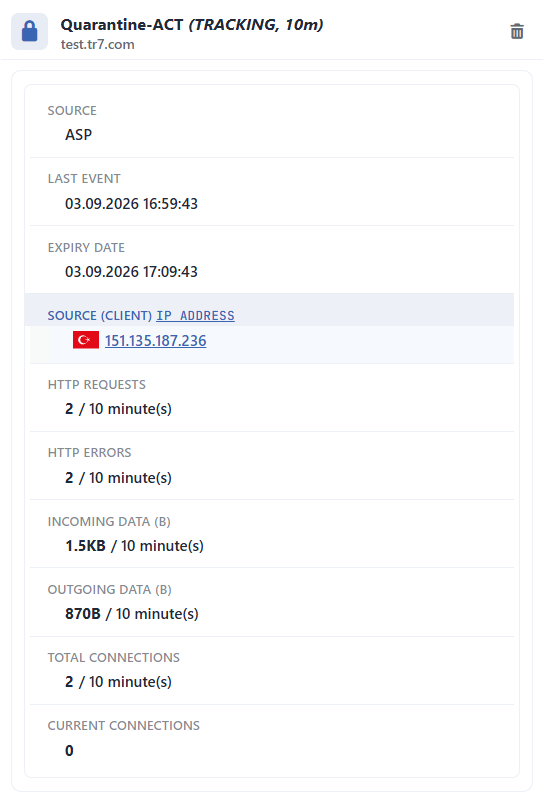 Quarantine Logs (Tracking)
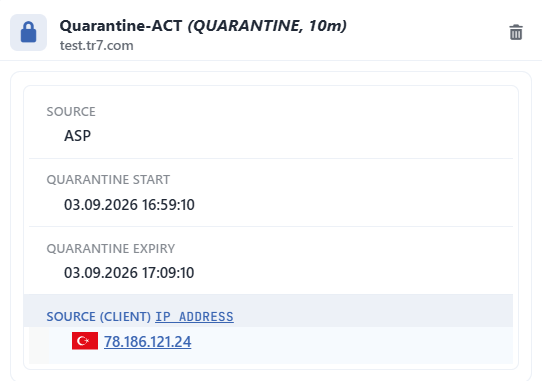 Quarantine Logs (Quarantine)
1
Step 1 Go to the vServices screen
The Load Balancer → Load Balancer vService List path is followed in the TR7 web interface.
2
Step 2 Open the Logs & Tracking tab
The related vService is selected from the list and the Dashboard icon is clicked, or the related service under vServices is selected directly from the left menu. With both methods, the Dashboard screen of the related vService is reached and the Logs & Tracking tab is opened.
3
Step 3 Select the table
The Quarantine Tracking logs or the Quarantine table is selected from the dropdown menu at the top left. (The name given to the action is displayed.)
4
Step 4 Load the data
The table data is loaded automatically. The Refresh button is clicked in order to update the table manually.
Quarantine Logs (Tracking): Table Columns
| Column | Description |
|---|---|
| Last Event | The time of the last activity for this record |
| Expiry Date | The time when the record will be deleted from the table |
| IP | The monitored IP address (or the selected fx variables) |
| Request | The number of HTTP requests (only HTTP) |
| Request.error | The number of HTTP errors (only HTTP) |
| Data (in) | The amount of data coming in |
| Data (out) | The amount of data going out |
| Total Connections | The total number of connections |
| Current Connections | The instant number of connections |
Quarantine Logs (Quarantine): Table Columns
| Column | Description |
|---|---|
| Quarantine Start | Entry into quarantine |
| Quarantine Expiry | Exit from quarantine |
| IP | The IP address of the quarantined client (or the selected fx variables) |
Resource Usage and Optimization
The Quarantine action performs Quarantine Tracking Table queries for every request. Some points to pay attention to in high-traffic environments are listed below.
Tracking Key selection:
- IP is the option that consumes the least resources.
- With Manual, the memory usage increases when too many keys are used.
Table sizes:
- Tracking table: ~20,000 record capacity
- Quarantine table: ~5,000 record capacity
Recommendations:
- Tracking Time should not be kept unnecessarily long.
- Specific conditions are used instead of very broad conditions.
- IP-based tracking is preferred on high-traffic services.
The quarantine records are on a device basis
The tracking counters and the quarantine records are kept separately on each TR7 device; they are not shared between the devices in the cluster. A client whose traffic is distributed to more than one device fills the threshold separately on each device.
When the configuration is refreshed, the records are preserved; when the service is completely restarted, they are reset.
INFO
Manual Removal from Quarantine
A client in quarantine can be released by being selected from the quarantine table on the Logs & Tracking screen of the related vService, with the Remove from Table operation. This operation also clears the tracking record of the client; the client starts to be evaluated from scratch.
Operational and Safe Usage Recommendations
- It is used together with a whitelist. Conditions are used in order to keep the known IPs (office, partner, monitoring, in-house) exempt from quarantine.
- Verify in a Test Environment. The threshold values are verified in a test environment before production. A wrong configuration can block legitimate users.
- It is monitored with logging. The Quarantine Logs (Tracking) and Quarantine Logs (Quarantine) screens are followed continuously in order to monitor the quarantine events.
- Keep the Quarantine Period Balanced. Too short a period remains ineffective, too long a period can block legitimate users.
Common Usage Scenarios in Live Environments
The examples below show how the related action is applied in the most frequently encountered use cases in real systems. These scenarios are based on practices that are widely preferred in live environments and rest on experience gained in the field.
Scenario 1: DDoS Attack Protection and Silent Drop
Problem: An e-commerce site is under a DDoS attack. More than 1000 requests per minute are coming from a single IP and the servers are overloaded. The attacker IPs need to be blocked quickly and the resources need to be protected.
Solution: With IP-based tracking, the IPs that make more than 1000 requests in 1 minute are blocked silently for 30 minutes.
Configuration:
- Execution Level: On Request
- Tracking Key: IP
- Tracking Time: 1 Minute
- Quarantine Condition: HTTP Requests > 1000
- Quarantine Time: 30 Minutes
- Quarantine Action: Silent Drop
- Conditions: Source IP does not start with 10.0.0.0/8 (exclude the office network)
- Details: HTTP
Result:
- ✅ Automatic DDoS protection → The IPs that make >1000 requests in 1 minute are placed under quarantine immediately.
- ✅ Silent drop → The attacker does not receive any response, the connection is dropped.
- ✅ Whitelist protection → The office network (10.0.0.0/8) is kept exempt from quarantine.
- ✅ Resource protection → The attacker IPs are blocked for 30 minutes, the server load decreases.
- ✅ Automatic clearing → The quarantine is lifted automatically after 30 minutes.
Quarantine Tracking Table:
| IP | Request | Data (in) | Data (out) | Total Connections |
|---|---|---|---|---|
| 203.0.113.45 | 1523 | 15 MB | 2 MB | 1523 |
| 198.51.100.23 | 2041 | 20 MB | 1 MB | 2041 |
Quarantine Table:
| IP | Quarantine Start | Quarantine Expiry |
|---|---|---|
| 203.0.113.45 | 2024-01-15 14:23:10 | 2024-01-15 14:53:10 |
| 198.51.100.23 | 2024-01-15 14:24:05 | 2024-01-15 14:54:05 |
Scenario 2: WordPress/CMS Admin Panel Brute-Force Prevention
Problem: Bots continuously make brute-force attacks on the /wp-admin/ login page of a WordPress site. There are more than 50 login attempts in 5 minutes and the PHP processing capacity of the server is full. The failed login attempts must be monitored and the attackers must be blocked.
Solution: With the IP + User-Agent combination, the clients that make more than 50 requests in 5 minutes on the login path are detected and blocked silently for 15 minutes.
Configuration:
- Execution Level: On Request
- Tracking Key: IP + User-agent
- Tracking Time: 5 Minutes
- Quarantine Condition: HTTP Requests > 50
- Quarantine Time: 15 Minutes
- Quarantine Action: Silent Drop
- Conditions: Path starts with
/wp-admin/ - Details: HTTP
Result:
- ✅ Brute-force blocking → The IP+UA combinations that make >50 login attempts in 5 minutes are placed under quarantine.
- ✅ Silent drop → The attacker bots do not receive any response, the connection is dropped.
- ✅ PHP resource protection → Unnecessary login operations are blocked, the server load decreases.
- ✅ Path condition → Only the
/wp-admin/path is protected, the other pages are not affected. - ✅ User-Agent tracking → Different browsers/bots coming from the same IP are monitored separately.
Quarantine Tracking Table:
| IP | User-Agent | Request | Total Connections |
|---|---|---|---|
| 203.0.113.10 | python-requests/2.31.0 | 156 | 156 |
| 198.51.100.5 | Go-http-client/1.1 | 89 | 89 |
Scenario 3: API Rate Limiting and Fair Usage Policy
Problem: A public API endpoint (/api/v1/) is offered to the customers, but some customers disrupt the service of the other customers by making more than 500 requests per minute. A fair usage policy must be applied and excessive use must be blocked. Every API key must be monitored separately and a key-based limit must be applied.
Solution: By tracking with the API key + IP combination, the clients that send more than 100 requests per minute are blocked with a rate limit message for 1 minute.
Configuration:
- Execution Level: On Request
- Tracking Key: Manual
- Quarantine Keys to Track: The
Request header: X-API-KeyandSource (client) IP addressvariables are selected with the Smart Variables (fx) button
- Quarantine Keys to Track: The
- Tracking Time: 1 Minute
- Quarantine Condition: HTTP Requests > 100
- Quarantine Time: 1 Minute
- Quarantine Action: Show Content
- Quarantine Content: API-Rate-Limit-Error (a previously defined content page)
- Status Code: 429 Too Many Requests
- Conditions: Path starts with
/api/v1/ - Details: HTTP
Result:
- ✅ Fair usage → Every API key can make a maximum of 100 requests per minute.
- ✅ API key tracking → Every API key is monitored separately, a fair limit in multi-user scenarios.
- ✅ Fast reset → The quarantine is lifted after 1 minute, the user can try again.
- ✅ 429 status code → A standard HTTP rate limit response, the clients can apply retry-after.
- ✅ Manual tracking → Granular tracking with the X-API-Key and IP combination.
API Rate Limit Content Page:
json
{
    "error": "rate_limit_exceeded",
    "message": "You have exceeded the API rate limit of 100 requests per minute.",
    "retry_after": 60,
    "documentation": "https://api.example.com/docs/rate-limits"
}
Quarantine Tracking Table:
| X-API-Key | IP | Request | Total Connections |
|---|---|---|---|
| key_abc123...xyz | 203.0.113.50 | 156 | 156 |
| key_def456...uvw | 198.51.100.25 | 89 | 89 |
Scenario 4: Blocking a Bandwidth Consumption Attack (Download Flood)
Problem: Large files (video, ISO, firmware) are served from a CDN service. Some IPs pull more than 10 GB of data in 1 minute and the bandwidth is exhausted. The other users experience slowness. The IPs that download excessively need to be blocked temporarily.
Solution: With IP-based tracking, the IPs that download more than 1 GB of data in 1 minute are redirected to a warning page for 10 minutes.
Configuration:
- Execution Level: On Response
- Tracking Key: IP
- Tracking Time: 1 Minute
- Quarantine Condition: Outgoing Data (B) > 1073741824 (1 GB)
- Quarantine Time: 10 Minutes
- Quarantine Action: Redirect
- Redirect Location:
/bandwidth-limit.html
- Redirect Location:
- Conditions: Path starts with
/downloads/ - Details: HTTP
Result:
- ✅ Bandwidth protection → The IPs that download >1 GB in 1 minute are placed under quarantine.
- ✅ Redirect warning → The user is redirected to the bandwidth limit warning page.
- ✅ Outgoing data tracking → The amount of data in the response body is monitored.
- ✅ Path condition → Only the
/downloads/path is affected, the other content is accessed freely. - ✅ Temporary block → The user can download again after 10 minutes.
Bandwidth Limit Warning Page:
html
<!DOCTYPE html>
<html>
<head>
    <title>Bandwidth Limit Exceeded</title>
</head>
<body>
    <h1>Download Limit Exceeded</h1>
    <p>You have exceeded the download bandwidth limit (1 GB per minute).</p>
    <p>To protect service quality for all users, your access to downloads has been temporarily limited.</p>
    <p><strong>Your access will be restored in 10 minutes.</strong></p>
    <p>If you need higher bandwidth, please contact our support team for enterprise options.</p>
</body>
</html>
Quarantine Tracking Table:
| IP | Request | Data (out) | Total Connections |
|---|---|---|---|
| 192.0.2.100 | 45 | 2.3 GB | 45 |
| 198.51.100.50 | 120 | 1.8 GB | 120 |
