
Smarter by Design.Simpler for Business
Network
What Is Network?
Network is the view tab that gathers the network state of the device on a single screen on the TR7 home page. The tab consists of seven panels: the Network Topology panel that shows the interfaces defined on the device as a diagram, the bandwidth, packet and error panels that read the total of all the interfaces and the three panels that read the TCP connection table of the device.
While the other tabs of the home page read the totals of the vService, WAF, AGS or DNS service traffic, this tab reads the own network counters of the device. For this reason there is no scope upper row such as All vServices or All DNS Services in the title of the panels and no vService Distribution table that offers a vService breakdown takes place in the panels. The totals in the tab are not separated per interface either: the bandwidth, the packets and the errors of a single interface are monitored on the Interfaces - Dashboard screen, and the traffic of a single vService in the Frontend Bandwidth panel.
The display of the tab depends on the Network permission and all of the seven panels are in the same permission area. There is no conditional panel in the tab: the seven panels are laid out on every device, both on a virtual machine and on a physical device, and the panel number does not change according to the number of interfaces on the device. The number of interfaces determines only the content of the Network Topology panel and which interfaces take part in the totals. This tab is only for monitoring: the interface, address and routing configuration is done on the screens in the Network section.
7
Panel
The tab does not have a subtab; there is no conditional panel in the tab
Network
Required Permission
The tab and all of the seven panels are bound to the same permission
Device-Wide
Measurement Scope
The panels read the total of all the interfaces; they do not offer an interface or vService breakdown
1 s
Recording Step
The network and TCP counters are stored in per-second steps
Access to the Network Tab
- The Home shortcut on the left of the Header Bar is clicked.
- Network is selected from the view tabs.
The tab does not have a subtab, so the second row of the tab bar is not displayed. For the Header Bar shortcuts, see Header Bar.
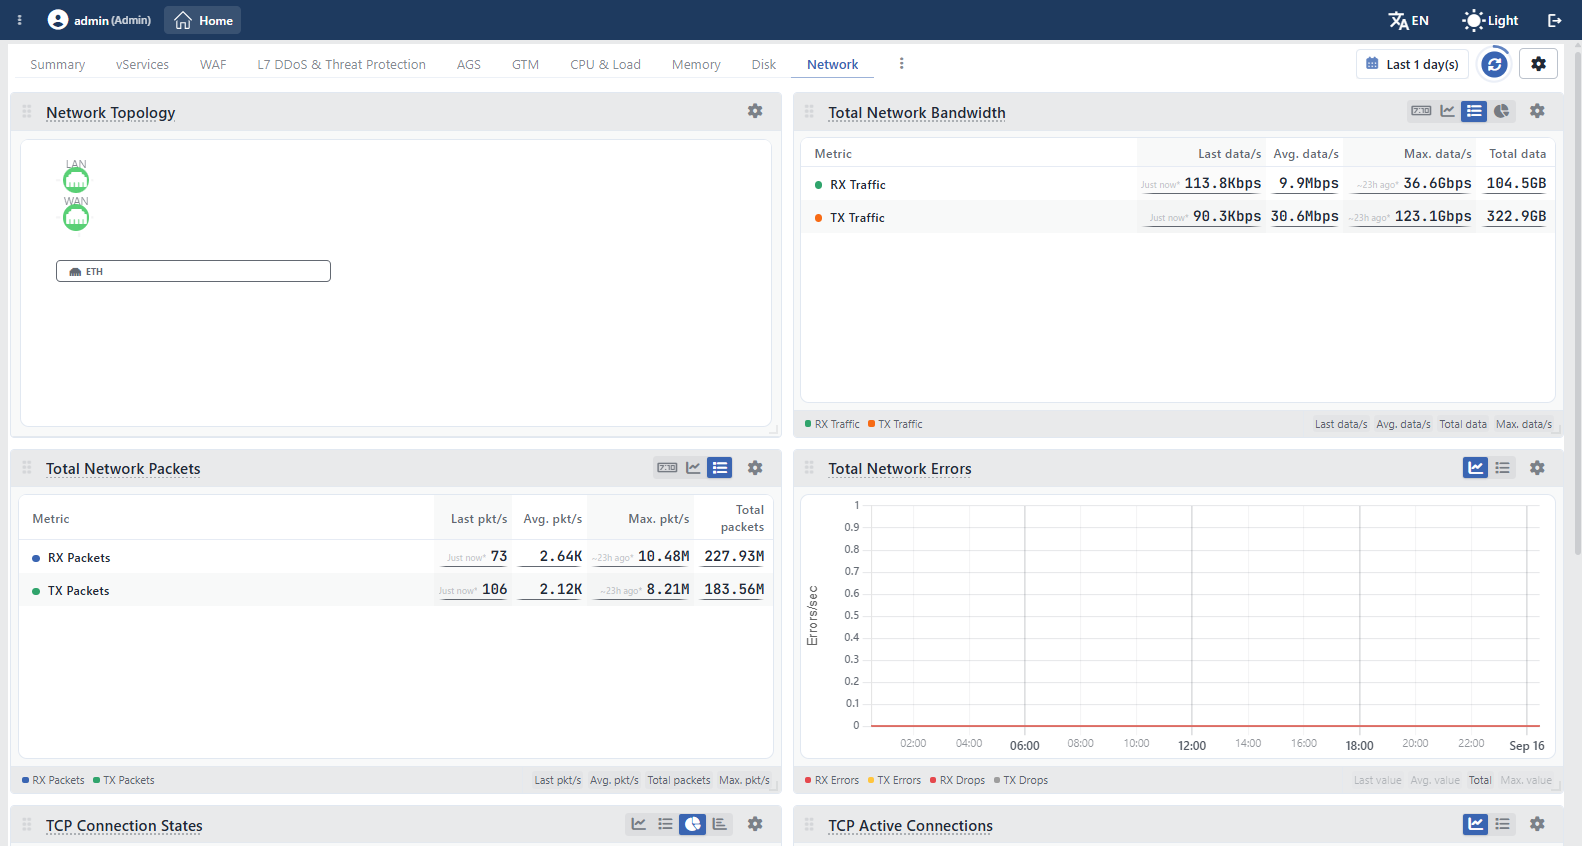 The Network Tab
The screen controls are common to all the tabs
The time range selector, the refresh, the settings, the template menu and the arrangement of the panels are the same in all the view tabs of the home page; for the detail, see Screen Controls.
Panels
There are 7 panels in the Network tab and their order is in the Network Topology, Total Network Bandwidth, Total Network Packets, Total Network Errors, TCP Connection States, TCP Active Connections, TCP Connection Problems form. The order comes from the record order of the panel definitions; first the three device-wide counter panels and then the three TCP panels are laid out. The tab and all of the panels are bound to the Network permission; in a user who does not have this permission the tab does not take place among the view tabs at all.
There is no conditional panel in the tab bound to the device type, to the license or to a feature being on; the seven panels are always laid out. All the interfaces registered in the interface configuration of the device take part in the total panels: besides the physical interfaces, the bond, LACP, VLAN, VXLAN and bridge interfaces enter the same total as well. The counters of an interface that has no counterpart in the configuration are not written into any panel.
All of the panels are by default one card wide and one card high. The only exception is the Network Topology panel: its height is determined according to the content of the diagram and it grows up to at most two cards high. The card width changes according to the screen width: as many columns as the number of cards that fit side by side are opened and the cards fill the column. When the panel title is hovered over, the short explanation of the definition is displayed as a tooltip.
The Add Visualization menu offers the same seven panels on this tab; there is no other network panel that can be added to the tab and no hidden panel that does not enter the default layout takes place in the menu. A panel selected from the menu can be added a second time even if it is already present in the layout. The bandwidth, packet, error and state panels per interface and the interface notification panel are not listed in this menu; these panels are present only on the Interfaces - Dashboard screen.
The summaries that can be opened in the panels in this tab are named according to the value the panel measures: in the bandwidth panel Last data/s, Avg. data/s, Max. data/s and Total data, in the packet panel Last pkt/s, Avg. pkt/s, Max. pkt/s and Total packets, and in the TCP panels Last connections, Avg. connections and Max. connections are used. The Total Network Errors panel does not carry its own naming and uses the general names: Last value, Avg. value, Max. value, Total. The Min. value summary is offered in none of the panels in the tab; for this reason the legend badge also offers only the MAX band. A closed summary is listed in the strip under the panel with its name and is opened by being clicked.
Threshold coloring is not applied in any of the panels in the tab: the values do not change color according to the warning or the danger band.
Network Topology
Shows the network interfaces defined on the device as a single diagram. Every interface is a node and on the node the name of the interface in the configuration is written (such as LAN, WAN). The nodes are separated into columns according to the type and the columns follow this order from left to right: the physical interfaces, the bond and LACP interfaces, the VLAN interfaces, the virtual interfaces, the VXLAN interfaces and the bridge interfaces. Below the diagram there is an explanation strip that lists only the interface types that have a counterpart on the device; in the strip the ETH, VLAN, VXLAN, V-ETH, V-ETH(Peer), LACP, Bond and Bridge names take place in this order.
The color of the node shows the current state of the interface: an interface that is up takes the color of the positive band, an interface that has no carrier signal on its line of the warning band, a closed interface of the dim band, and an interface that is defined in the configuration but is not present on the device of the error band. In the cluster setups every node is divided into two parts: the left part carries the state of this device and the right part of the peer device.
The panel is not a time series: the values are read not from the archive but from the current configuration and state information of the device. For this reason the panel is not affected by the time range selection, does not offer a summary column and the view type icons are not displayed in the card title; only the Info view is present in its definition. The nodes in the diagram cannot be selected on this card; to go into the detail of an interface the Interfaces - Dashboard screen is used.
Total Network Bandwidth
Shows the data carried by all the interfaces defined on the device as two series: RX Traffic (received) and TX Traffic (sent). The values are the instantaneous speeds produced from the difference of the interface counters; the value of every interface is summed and a single device total is written.
| Series | Meaning |
|---|---|
| RX Traffic | The data received per second on all the interfaces. |
| TX Traffic | The data sent per second on all the interfaces. |
The speed values are printed as bits/second (113.8Kbps, 36.6Gbps); the total of the selected range, on the other hand, is printed with the data amount unit (104.5GB). In the default Stat Table view all four of the summary columns come open: Last data/s, Avg. data/s, Max. data/s and Total data. The header of the first column of the table is Metric and to the left of every value the moment at which that value was read is written relatively (such as Just now, ~23h ago).
In the panel, the Digital, Line Chart, Stat Table and Pie Chart views are offered. In the Line Chart view, as a summary, only Total data comes open and with the MAX badge to the left of the legend strip the highest value band is added behind the averaged line. The Pie Chart view shows the share of the data received and sent with their percentages; in this view Avg. data/s and Total data come open.
In the cluster setups the combining changes according to the view: Line Chart and Pie Chart sum the value of the two devices, and Stat Table and Digital show every device separately. The same panel takes place in the Summary tab with the Digital view; see Total Network Bandwidth. The Network widget in the Header Bar is also fed from the definition of this panel and prints the window average of every series in a single row in the RX Traffic | TX Traffic form.
Total Network Packets
Shows the number of packets received and sent per second on the same interfaces. The panel measures not the amount of data carried but the number of packets; the data carried is read in the Total Network Bandwidth panel. The two panels being read together gives the average packet size: if the packet number is high and the bandwidth stays low, it means that the traffic consists of a large number of small packets.
| Series | Meaning |
|---|---|
| RX Packets | The number of packets received per second on all the interfaces. |
| TX Packets | The number of packets sent per second on all the interfaces. |
In the default Stat Table view all four of the summary columns come open: Last pkt/s, Avg. pkt/s, Max. pkt/s and Total packets. The Y axis is labeled as Packets/s, starts from zero and the axis values carry at most one decimal place.
In the panel, the Digital, Line Chart and Stat Table views are offered; the Pie Chart view is not present in this panel. In the Line Chart view, as a summary, only Total packets comes open and the MAX badge is offered. In the cluster setups Line Chart sums the value of the two devices, and Stat Table and Digital show every device separately. The same panel takes place in the Summary tab with the Digital view; see Total Network Packets.
Total Network Errors
Shows the error and dropped packet counters of all the interfaces as four series. The error counter counts the packets the interface records as corrupt or unprocessable, and the dropped packet counter the packets eliminated because the interface could not accept or could not send them.
| Series | Meaning |
|---|---|
| RX Errors | The number of packets recorded as faulty in the receiving direction. |
| TX Errors | The number of packets recorded as faulty in the sending direction. |
| RX Drops | The number of packets eliminated in the receiving direction. |
| TX Drops | The number of packets eliminated in the sending direction. |
In the default Line Chart view, as a summary, only Total comes open; Last value, Avg. value and Max. value are opened from the strip under the panel. The Y axis is labeled as Errors/sec, starts from zero and the axis values carry at most two decimal places. Since the panel carries four series, the MAX badge is not offered by default; when the series are hidden from the legend and the number of visible series drops to two, the badge comes back.
In the panel, the Line Chart and Stat Table views are offered. In the Stat Table view all four of the summaries come open as columns. In the cluster setups Line Chart sums the value of the two devices, and Stat Table shows every device separately. From which interface the errors come is not separated in this panel; the error counters per interface take place on the Interfaces - Dashboard screen.
TCP Connection States
Distributes the TCP connections of the device according to their states as ten series. The values are not a speed but the number of connections at the moment of the measurement; the series cover both the IPv4 and the IPv6 connections.
| Series | Meaning |
|---|---|
| Established | The connection that has been set up and can carry data. |
| Time Wait | The connection whose closing has been completed and that is kept waiting for a short while for reuse. |
| Close Wait | The connection the other side has closed and whose closing has not been completed at the local end. |
| FIN Wait 1 | The connection whose closing request has been sent and whose answer is awaited. |
| FIN Wait 2 | The connection whose closing request has been confirmed and whose closing by the other side is awaited. |
| Listen | The listener that waits open to accept a connection. |
| SYN Sent | The connection whose setup request has been sent and whose answer is awaited. |
| SYN Received | The connection whose setup request has been received and whose handshake has not been completed. |
| Last ACK | The connection in the closing stage whose last confirmation is awaited. |
| Closing | The connection both ends of which have closed at the same time. |
In the default Pie Chart view the series are shown as ring slices, in the middle of the ring the total of the slices and the name of the summary that is open are printed, and when the slice is hovered over, its share is read together with its percentage. In this view, as a summary, only Avg. connections comes open.
In the panel, the Line Chart, Stat Table, Pie Chart and Bar Chart views are offered. In the Line Chart view the ten series are shown on top of each other as transparent areas; since the series are not stacked, the sum of the areas is not read on the axis. Since the panel carries more than six series, the summary box does not open in the line view and the MAX badge is not offered; the summary values are read from the Stat Table view and in that view all three of the Last connections, Avg. connections and Max. connections columns come open.
In the cluster setups the combining changes according to the view: Line Chart and Pie Chart sum the value of the two devices, and Stat Table and Bar Chart show every device separately.
TCP Active Connections
Summarizes the connection states in three grouped series. The series are produced by the states in the TCP Connection States panel being grouped, for this reason the two panels read the same counters at a different detail.
| Series | Meaning |
|---|---|
| Active | The total of the connections that have been set up and the connections in the setup and closing request stage: Established, SYN Sent, SYN Received, FIN Wait 1 and FIN Wait 2. |
| Established | Only the connections that have been set up. |
| Total | The total of all the states, including the listeners. |
The Total series covers Active, Listen and the Problems series in the TCP Connection Problems panel; since the closed connections that stay outside these three sets are also written into Total, Total can be read somewhat higher than the sum of the three. The difference between Total and Active gives the share of the listeners and of the closing-residue connections.
In the default Line Chart view, as a summary, only Avg. connections comes open; Last connections and Max. connections come closed and are listed in the strip under the panel as Last value and Max. value and are opened by being clicked. Since the panel carries three series, the MAX badge is not offered by default; when a series is hidden from the legend, the badge comes back. The Y axis is labeled as Connections and the values are printed without decimals.
In the panel, the Line Chart and Stat Table views are offered. In the Stat Table view all three of the summaries come open as columns. In the cluster setups Line Chart sums the value of the two devices, and Stat Table shows every device separately. The Connections widget in the Header Bar is also fed from the definition of this panel.
TCP Connection Problems
Gathers the connections that stay stuck in the closing stage or that still stand in the table after they have closed in a single series (the Problems series). The series is the total of the connections in the Close Wait, Last ACK, Closing and Time Wait states.
The series rising does not mean a failure on its own: the connections in the Time Wait state are a part of the ordinary closing flow and in the setups in which the short-lived connections are intense, the connections in this state become crowded. For this reason the panel is read not with an absolute value but with its own trend; for a rise that is mostly Close Wait, the breakdown is taken from the TCP Connection States panel.
In the default Digital view two summary sections come open: Avg. connections and Max. connections. Last connections comes closed; it is listed in the strip under the panel as Last value and when it is clicked, it opens with the name Last connections. Below the Max. connections section, when the value was seen is written relatively such as ~23h ago, and when it is hovered over the full time stamp is displayed.
In the panel, the Digital, Line Chart, Mini Chart and Stat Table views are offered; the Mini Chart view comes from the panel carrying a single series. Since the panel carries a single series, the MAX badge also takes place in the line view. In the cluster setups the Digital, Line Chart and Stat Table views show the value of every device separately. The TCP Issues widget in the Header Bar is also fed from the definition of this panel.
Scope and Limits
INFO
- The tab is displayed only with the Network permission. All of the seven panels are bound to the same permission; in a user who does not have this permission the tab does not take place among the view tabs at all. The visibility of the tab does not look at the device type, the license or the number of defined interfaces.
- There is no conditional panel in the tab. The seven panels are laid out on every device and the Add Visualization menu offers the same seven panels as well; there is no hidden network panel in the menu that does not enter the default layout.
- The same traffic can be counted on more than one interface. All the interfaces registered in the configuration enter the totals; since the data a VLAN interface carries is also written into the counters of the physical interface on which it is set up, in such setups the total values are read above the traffic that passes over the cable.
- The panels are not separated per interface. The bandwidth, packet and error panels are the total of all the interfaces registered in the interface configuration of the device; which interface carries what is not read in this tab. The bandwidth, packet, error and state panels per interface take place on the Interfaces - Dashboard screen.
- The totals do not overlap exactly with the vService traffic. The counters in this tab cover all the traffic the interfaces carry and do not separate the vService traffic as a separate item. The total of the vService traffic is read from the vServices tab.
- The TCP panels measure the number of connections, not the traffic volume. The three TCP panels read the same counter set at a different detail: TCP Connection States gives the state breakdown, TCP Active Connections the three grouped series, and TCP Connection Problems the closing-residue connections. The counts cover both the IPv4 and the IPv6 connections.
- The combining in a cluster changes according to the panel and the view. The Line Chart and Pie Chart views sum the value of the two devices in the bandwidth, packet, error and TCP state panels; the Stat Table, Digital and Bar Chart views show every device separately. In the TCP Connection Problems panel all three of the Digital, Line Chart and Stat Table views show the devices separately. To see the values of a single device, the source selection in the settings is used; the options are the names of the two devices and
Both devices. - The counters are read in two-second rounds and written into the per-second archive. All the measurements that feed this tab are taken from the device once every two seconds and are written into the archive with per-second steps; the short-lived jumps that stay between two readings are not seen as a separate point.
- The fine-resolution history is limited. All the panels in the tab go back the last one minute at the per-second resolution, the last one day at the five-second resolution, three days at the fifteen-second resolution, 14 days at the per-minute resolution, 60 days at the five-minute resolution, 180 days at the fifteen-minute resolution and two years at the hourly resolution; the older ranges are stored with a coarsening resolution for up to ten years.
- The Min. value summary is not offered. None of the network and TCP panels offers the lowest value summary; for this reason the legend badge also offers only the MAX band and appears only in the line views in which the number of visible series does not exceed two.
- The appearance of an empty panel changes according to the card type. If there is no value in the selected time range,
No datais displayed in the Digital view andNo-datain the Pie Chart and Bar Chart views; if a measurement has never been recorded, the textNo data recorded for the selected time range.is printed inside the card. - Network Topology is not a time series. The panel reads the current interface configuration and state of the device; the time range selection, the resolution and the automatic refresh settings do not carry the content of this panel into the past.
- There is no passing to another screen from the cards. Clicking a series name only hides or shows that series; an interface node in the diagram cannot be selected on this card either. For the interface configuration and the detailed interface measurements the screens in the Network section are used.
