
Smarter by Design.Simpler for Business
Dashboard
What Is Dashboard?
Dashboard is the tab that shows a vService's traffic, connection, source IP, distribution and system metrics on a multi-panel monitoring screen with a selectable time range. When a vService's management screen is opened, the Dashboard tab (with the vService's name) comes first.
The screen gathers data such as incoming request and connection rates, response code distribution, density per source IP, country and network type breakdowns, distribution to Backend Services, TLS termination counters and the vService's own resource usage in different panels. Each panel can be displayed as a map, chart, heatmap, table or counter; it is updated automatically according to the selected time range. A traffic wave or a backend slowdown is noticed immediately: which country it comes from, which Backend Service is falling behind and how the response codes are shifting are visible on a single screen.
All monitoring capabilities are a built-in part of TR7: data is collected on the device with per-second resolution and stored in archives of up to 10 years; without the need to install an external analytics or SIEM tool, trends from years ago can be examined retrospectively in addition to real-time monitoring. Archiving is tiered: the finest resolution is kept only for the recent past, and as data ages it is stored summarized in wider steps.
1 s
Per-second data collection
Metrics are collected with per-second resolution; panels are updated automatically according to the selected range
10 Years
Historical data
Statistics are stored in archives of up to 10 years; the time range picker offers preset ranges of up to 5 years
Built-in
No external tool required
All data is collected on the device; no separate analytics/SIEM installation is required
10
View Tabs
Five are unconditional; the remaining five open according to the vService's type and configuration
14
Preset Time Ranges
Preset ranges from 5 minutes to 5 years; also free duration and date range input
~250
Country Breakdown
Traffic is monitored live on a world map by source country
3 Types
All vService types
All HTTP, L7 TCP and Network vServices are monitored; the panel set narrows according to type
32
Panels per tab
At most 32 panels per view tab, at most 16 custom templates per user
Personal
Customizable layout
Templates, adding/moving panels and resizing are stored per user
Accessing Dashboard
- Left Monitor Panel is opened.
- Load Balancer vServices is selected from the category tabs at the top left.
- The vServices defined on TR7 are listed.
- The vService to be monitored is clicked; the screen opens with the Dashboard tab that carries the vService's name.
In the list, each row carries the vService's Type, Algorithm, Frontend, Backend Services and Modules information; the row's primary metric is Frontend Bandwidth. Bandwidth was chosen as the primary metric because it is produced in every vService type; the request counter exists only in HTTP vServices. The list is filtered by name, vService type, status, whether the WAF and AGS modules are enabled and, on the Bot/DDoS side, the enabled protection column (L7 DDoS, Bot, IP Reputation).
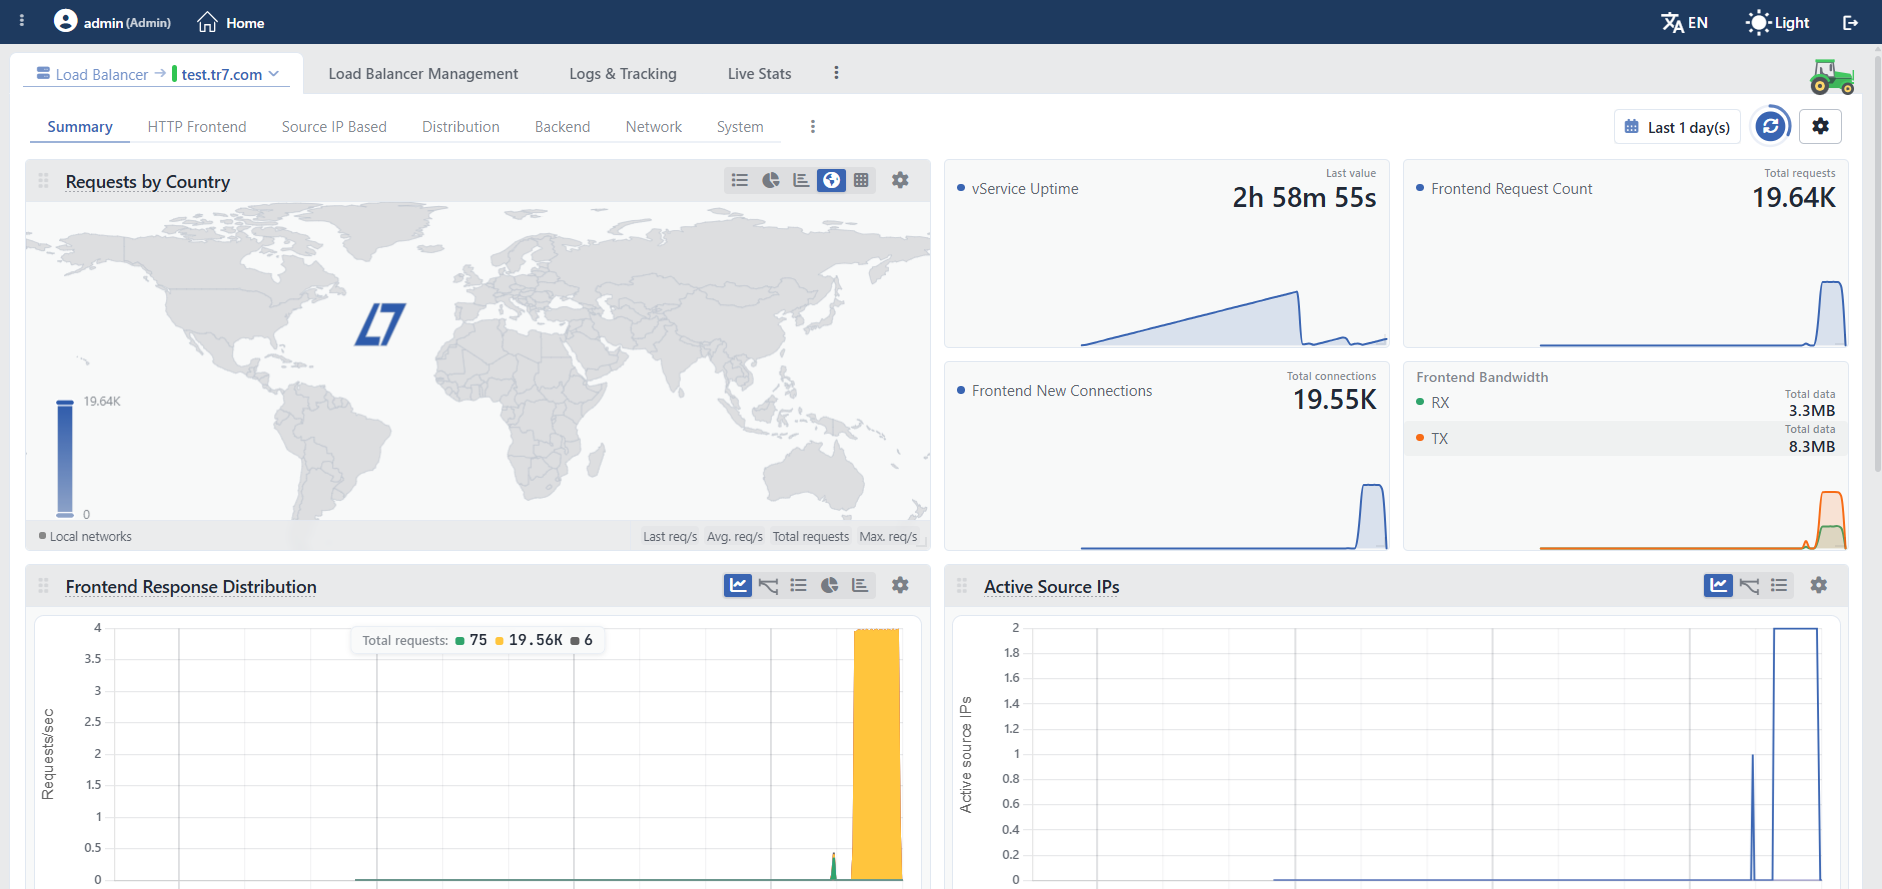 LB Dashboard
Tab Bar
Alongside the Dashboard tab, the Load Balancer Management, Logs & Tracking, Live Stats and Report tabs are located on the same screen. Dashboard, Load Balancer Management and Live Stats are always present. Logs & Tracking is also always present for users with Load Balancer permission; the source selector inside the tab is filled according to the vService's configuration and leaves out the WAF and Bot/DDoS sources. Report, on the other hand, is displayed only if a Reports profile is assigned to the vService. In vServices that use SAM as the persistence method, there is additionally a Session Affinity Manager (SAM) tab. The label of the first tab is in the form Load Balancer → <vService name>. The down arrow at the end of the label opens the menu for switching to the same vService's WAF, AGS and Bot/DDoS dashboards; when the tab is already selected, the entire label also opens this menu. The menu is displayed only if at least one other module is enabled on the vService, included in the license and within the permission area of the user (the WAF dashboard requires WAF permission); otherwise the label remains a plain title.
Quick operations on the vService are performed from the ⋮ menu at the right end of the tab bar: Edit (for users with change permission in the Load Balancer area), Reload (inactive while the vService is off), Enable, Disable, tcpdump and, below the separator, Delete (for users with menu permission). Edit and tcpdump open on the same screen as closable additional tabs. The open tab is written to the address bar and the link is shared by copying it; this applies only to fixed tabs, and tabs opened later, such as Edit and tcpdump, are not brought back via the link.
A collapsible panel that summarizes the vService's configuration as a request flow diagram is also located on the right side of the screen; for details, see Load Balancer - ADC Data Flow Panel.
Load Balancer - ADC Data Flow Panel
The preview panel on the right side of the screen summarizes the vService's configuration as a request flow diagram. The panel has no separate title in the interface; in this document it is described under the name Load Balancer - ADC Data Flow Panel so that it can be referred to easily. For an introduction to the panel, see Load Balancer - ADC Data Flow Panel. The diagram shows at a glance the path traffic follows from entering at the listener addresses, through virtual domain name matching, the certificate, request rules and the enabled security modules, until it is distributed to the Backend Services. Every element in the diagram reflects the live configuration. When the boxes are clicked, a summary window opens; the pencil icon there opens the edit window of the related setting, and the Go to Page button next to it leads to that record's own page.
The panel is visible only in the Dashboard and Load Balancer Management tabs; it closes when switching to other tabs. It is collapsed and expanded by clicking the handle figure outside the panel's left side. Resizing is done only by dragging from the panel's left edge; the default width is 450 pixels and the lower limit is 380 pixels; the upper limit is the greater of 600 pixels and 70% of the window width. The collapse handle carries the vService's status color. The width and collapsed state are remembered per user. The panel has no close button; it can only be collapsed.
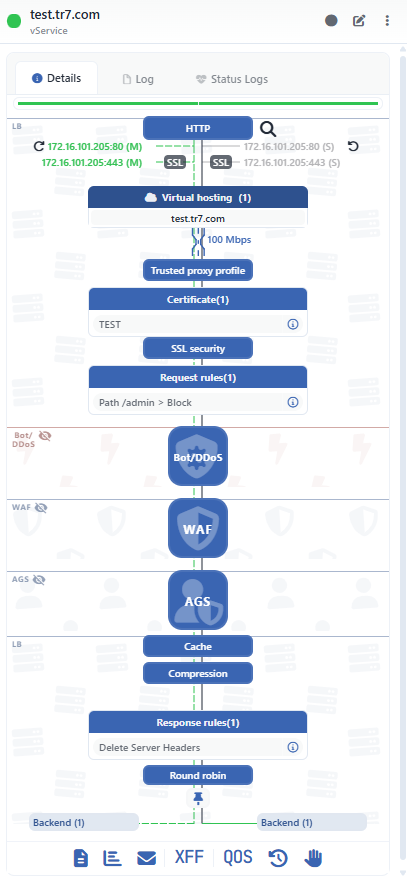 Load Balancer - ADC Data Flow Panel
The diagram is dynamic
Load Balancer - ADC Data Flow Panel is not a fixed image; it is shaped dynamically according to the vService's configuration. In the cards of the diagram's LB section, an element that is not configured is not shown faded; it is not displayed at all: if no certificate is defined, the Certificate box, if no cache profile is assigned, the Cache box, and if there is no request rule, the Request Rules box does not appear in the diagram. (The detailed views of the modules are outside this rule: there, disabled protection columns and inspection cards are shown faded.) In the same way, the WAF, Bot/DDoS and AGS strips are displayed only while the related module is enabled on the vService; if there is no module strip at all, the background bands of the strips are not displayed either.
The image above shows the case in which all features that can be enabled in an HTTP vService are enabled: virtual domain name, bandwidth limit, Trusted Proxy profile, certificate, TLS security profile, request and response rules, cache, compression, and all of the WAF, Bot/DDoS and AGS modules are defined. In this image, the module strips are shown in summary (icon) mode. For this reason, the diagram is the widest form that can be seen in HTTP vServices; the diagram on the screen is narrower than this depending on the vService's type and configuration. The descriptions on this page cover all elements that can appear in the diagram and the conditions under which they appear.
Panel Header
The header contains the vService's name, the vService caption below the name and a colored status dot showing the combined status: green OK, red Error, orange Warning, blue Evaluating, gray Disabled. In cluster setups, the dot has two halves; the left half shows the status of this device and the right half the status of the peer device. The Evaluating color is the theme's accent color and appears blue in the default theme.
Two shortcuts are located at the top right. Both are shown only as icons; their names appear when hovered over. There is no permission condition for tcpdump; Edit, on the other hand, is displayed only for users with change permission in the Load Balancer area, and if this permission is missing, a single shortcut remains in the header.
| Button | Function |
|---|---|
| tcpdump | A closable tcpdump tab opens on the same screen; a packet capture is taken from the vService traffic. |
| Edit | The vService edit form opens as a closable Edit tab. |
The ⋮ menu next to them contains the Delete, Reload (inactive while the vService is off), Enable and Disable operations. Delete is displayed only for users with menu permission. This menu is not the same as the ⋮ menu in the tab bar: Edit and tcpdump are not in it, and the order of the items is different.
Panel Tabs
| Tab | Content |
|---|---|
| Details | Status strip, configuration warnings, device-based status messages and, below them, the flow diagram. The thin color strip just below the tabs shows the vService's combined status on that device (green = OK); in a cluster, a separate strip is shown for each member. If there is an error in the configuration, the number of errors and their categories (such as configuration syntax, unknown reference, certificate file, cipher list, DNS resolution, port binding) are summarized in a single line. If there is a deprecated configuration, a warning line is additionally displayed. Status messages are shown in at most four lines per device; the rest are behind an expand line. |
| Log | The vService's audit records (who changed what and when); with date range, record limit, refresh and Excel/CSV export tools. The range and record limit are stored per user; on first opening, the range is the last three years and the limit is 10 records. With a separate icon, the records open in a full-screen log view. This tab leaves out the Bot/DDoS module's own records; those records are listed in the Log tab of the Bot/DDoS dashboard itself, and the two complement each other. |
| Status Logs | The vService's status transition history; each transition is listed with "old status → new status" badges and a reason line. The range and limit are stored per user; on first opening, the range is seven days and the limit is 50 records. Encrypted support package rows produced for diagnostic purposes also appear here and can be downloaded; the package is not decrypted on the device and is forwarded to the support team. |
Flow Diagram: LB Section
The entry section of the diagram is marked with the LB strip and shows the layer where traffic enters the vService, followed by the configuration cards on the request path:
| Element | Meaning |
|---|---|
| Type Node | The blue node at the top shows the vService's type: HTTP, L7 TCP or, for the Network type together with the protocol suffix, Network (ANY - L3), Network (TCP - L4) or Network (UDP - L4). The node is not clickable; there is no profile behind it. |
| Debug Marker | The magnifier icon to the right of the type node indicates that Debug Mode is enabled on the vService. It is only an indicator and is not clicked. The records produced are described on the Debug Logs page. |
| Listener Rows | Each row is a listener address (IP:port). In cluster setups, the left side of the row shows the instance on this device and the right side the instance on the peer device; for cluster (VIP) type IPs, (M) indicates the master instance and (S) the slave instance. If the same address is (M) on the left, it appears as (S) on the right. The color is the address's operating status on that device; manually disabled addresses are additionally shown struck through. When the address is clicked, the IP details window opens; with the copy icon that appears when hovering over the row, the address is copied to the clipboard; for HTTP and HTTPS listeners, the full link form of the address is copied to the clipboard. When the address is middle-clicked, the service opens in a new tab. The main line is shown dashed and flowing from the first listener address that is up onward, and solid up to that point. This drawing shows the operating status of the address, not the traffic volume. |
| SSL Badges | On listeners where SSL termination is performed (Terminate SSL / SSL HTTP/2.0), an SSL badge is displayed next to the address; on listeners with QUIC (HTTP/3) enabled, h3 is added next to the badge. On listeners that redirect from HTTP to HTTPS, instead of the SSL badge a Redirect SSL marker in the shape of a circular arrow is shown; this marker is only an indicator. |
| Virtual Hosting (N) | Displayed only in HTTP vServices and if at least one virtual domain name is defined. The number in the title is the number of defined domain names; the domain names are listed below it. By default, four rows are shown, and the rest are behind an expand line; when hovering over the title, all of the domain names are displayed. |
| Bandwidth Box | Displayed if a bandwidth limit (Total Limit) is defined for the vService, and the limit is shown in a readable unit (e.g. 100 Mbps). |
| Trusted Proxy Profile | Displayed if a Trusted Proxy profile is assigned to the vService. When the box is clicked, the profile summary opens; the window contains the Go to Page and Edit buttons. |
| Certificate (N) | Lists the assigned certificates; the number in the title is the number of certificates. With the info icon on the row, the certificate summary is displayed. There is no edit button in the certificate summary window. |
| SSL Security | Displayed if a TLS Security Profiles profile is assigned to the vService; when the box is clicked, the profile summary and an edit shortcut open. |
| Request Rules (N) | Lists the Actions rules that run in the request direction; the number in the title is the number of rules. The row text is the rule's name, and an arrow indicating the direction is placed before it (↓ request, ↑ response); for rules that run in both directions, both arrows are displayed. Rules that do not specify a direction are listed without arrows in both boxes. With the info icon, the rule summary and an edit shortcut open. |
Flow Diagram: Module Strips
Below the entry cards, the security modules enabled on the vService are displayed with their own strips. The order is fixed: Bot/DDoS, WAF, AGS. If a module is not enabled on the vService, its strip is not displayed at all.
| Element | Meaning |
|---|---|
| Strip Label | The label at the top left of the strip is the module's name: LB, Bot/DDoS, WAF, AGS. The Bot/DDoS strip is distinguished by its own color (red); the others use the common accent color. A faded pattern made of the module's icon is printed on the strip background. |
| Eye Icon | The eye icon to the right of the strip label determines whether the module is shown in the diagram in summary or detailed form. A struck-through eye indicates summary (icon) mode, and an open eye indicates detailed mode; when hovering over the icon, the name of the mode to switch to (Details / Summary) appears. A struck-through eye does not mean that the module is disabled; it only describes the drawing detail. The selection is remembered per user and is summary mode by default. |
| Summary Badges | In summary mode, each module is shown as a single square badge with rounded corners; the module's name is on the badge and its icon on the background. When the Bot/DDoS badge is clicked, the module's full name (L7 DDoS & Threat Protection) is displayed, and when the WAF badge is clicked, WAF and the mode it runs in are displayed. The AGS badge is not clickable. |
| Detailed View | When switching to detailed mode with the eye icon, the module opens as the journey of traffic at that layer: in Bot/DDoS, the protection columns and the decision node (together with the queue node at the module's gate if a waiting room is defined); in WAF, the whitelist gate, learning methods, host groups, OWASP level, inspection cards and the decision node; in AGS, the access gate, session cards and the ticket node are displayed. If all sub-units of a module run in the same mode, the name of that mode is also printed below the strip label. The details of these views are described on the module's own Dashboard page: WAF Dashboard, Bot/DDoS Dashboard. |
There is no switching to module dashboards through the diagram
The module strips shown on this screen are display-only. The shortcuts that lead to the module cards' own dashboards or settings screens are not connected in this dashboard; the related settings are reached from the module's own Dashboard screen. The pencil, gear and + buttons of the boxes in the diagram are also not displayed in this dashboard; editing is done only with the Edit button in the summary window that opens when a box is clicked.
Flow Diagram: Distribution and Backend Services
After the module strips, the diagram returns to the LB strip and shows the response path and the distribution layer:
| Element | Meaning |
|---|---|
| Cache | Displayed if a Caching profile is assigned to the vService; when clicked, the profile summary and an edit shortcut open. |
| Compression | Displayed if a Compression profile is assigned to the vService. |
| Response Rules (N) | Lists the rules that run in the response direction; its format and behavior are the same as the Request Rules card. |
| Algorithm Box | Shows the vService's load balancing algorithm (e.g. Round Robin, Weighted Round Robin). In Network type vServices, the L4 algorithm list is used: Round-Robin, Weighted Round-Robin, Least-Connection, Weighted Least-Connection, Locality-Based Least-Connection, Source Hash, Destination Hash and the replicated variant of Locality-Based Least-Connection. When hovered over, the algorithm's detail view opens. |
| Pin Marker | The pin icon below the algorithm box shows that there is a persistence method on the vService; when hovered over, the method's summary is displayed. The marker is a part of the algorithm box and appears only together with that box. The criterion for counting persistence varies by type: because some L7 algorithms are inherently persistent, the marker is displayed even without a separate profile being assigned. |
| Cond N | If conditional Backend Service branches (Conditional backend services) are defined on the vService, a condition box is displayed above each non-default branch; when hovered over, the branch's condition sentence is displayed. The default branch is always located at the end of the list. |
| Backend Service Boxes | The boxes at the end of the diagram are the Backend Services that traffic reaches. The box text is the Backend Service's own name; if it is a member of a Backend Group, the name is generated in IP:port format. Group members are shown with a light background and a border color that alternates per group, and single Backend Services with a solid gray background; when a box's preview is opened, the boxes in the same group are highlighted together. On services marked as backup, there is a refresh icon next to the name. If TLS is used in the connection to the Backend Service, an SSL badge is additionally displayed next to the box. When the box is clicked, the Backend Service's preview opens; when right-clicked, the edit menu is displayed. |
In cluster setups, both the listener rows and the Backend Service boxes are shown once per device; the left column shows this device and the right column the cluster peer. The line going to the Backend Service is shown dashed and flowing if the service's health check is positive (or no check is defined) and at least one listener address is up; otherwise it is shown solid. This is also a status indicator, not a traffic measurement.
Bottom Settings Strip
The icon strip below the diagram represents the vService settings that are not shown as a separate box on the traffic path, and stays attached to the bottom of the panel. In this strip, a faded appearance is meaningful: if the related setting is not defined, the icon fades; if it is defined, it is shown in the accent color. When the first three icons and the last two icons are clicked, the summary window of the related profile opens and the setting is reached with the pencil icon; the XFF and QOS indicators are not clicked, they only report the status.
| Icon | Section |
|---|---|
| Logging profile. If it is not assigned, the Log profile is not active information is displayed. | |
| Reports profile. If more than one report profile is assigned, all of them are listed. | |
| Alert Notifications profile. | |
| XFF | Reports whether the X-Forwarded-For header is added to requests going to the Backend Services. |
| QOS | Reports whether the Quality Of Service setting is enabled. |
| Timeouts profile. If the default values are used, the icon is faded. | |
| vService Limits profile. If the default definition is used, the icon is faded. |
The settings that are already represented with their own box in the diagram (certificate, WAF, cache and compression) are not repeated in this strip.
View Levels (Drill-Down)
The vService monitoring view is offered at two levels:
| Level | Scope |
|---|---|
| All vServices | The vServices tab on the device's Home screen; shows the aggregate panels (with the All vServices - prefix) covering all vServices. See Home Dashboard: vServices. |
| vService | The Dashboard of a single selected vService (the screen described on this page). |
This page describes the Dashboard at the vService level; the panels on this screen show only the selected vService's data.
In addition, when a time range is selected by dragging horizontally over the panels, the whole dashboard is locked to that range. Because this selection produces an absolute start/end range, it also stops automatic refresh; to return to a relative range, a preset range is selected from the time range picker.
Screen Controls
Above the panels there is a full-width toolbar that controls all panels together. On the left of the bar are the view tabs and the template menu; on the right are the time range picker, the refresh button and the settings. In the top right corner of each panel, there are view icons specific to that panel.
 Screen Controls
INFO
Menu
The menu at the end of the view tabs contains the operations for the Dashboard tab layouts (templates). When a view tab is double-clicked, that template is returned to its default state; the operation again requires confirmation.
Create New Template
A new empty template (tab layout) is created. In the window that opens, the template is given a name, and the template opens as soon as it is created.
Duplicate Current
A copy of the current template is created; the copy is given a new name. The option is enabled only while a template is open.
Edit Template
The name of the current template is edited. The option is enabled only for templates created by the user; it is inactive for preset templates. The layout is not changed from this window; panels are edited by dragging and resizing them directly.
Reset to Default
The current template is returned to its default state after confirmation is obtained. The option is enabled only for templates on which changes have been made.
Remove Template
The current template is deleted after confirmation is obtained. The option is enabled only for templates created by the user; preset templates cannot be deleted.
Reset All to Defaults
After confirmation is obtained, the dashboard is returned entirely to its default state: the templates created by the user are deleted, the panel changes in preset templates are undone, and the toolbar preferences (time range, automatic refresh, resolution, source, height, theme) return to their default values.
INFO
Last 1 day(s) Time Range
The time period whose data the panels show is selected; the default range is Last 1 day(s). There are fourteen preset ranges, extending from 5 minutes (Last 5 minute(s)) to 5 years (Last 5 year(s)): 5 minutes, 15 minutes, 30 minutes, 1 hour, 3 hours, 12 hours, 1 day, 3 days, 7 days, 1 month, 3 months, 6 months, 1 year and 5 years. Alongside the preset ranges, a free duration (minutes, hours, days, weeks, months, years) is entered with Custom Duration. All panels are updated according to the selected range. The selection made is stored per user and preserved in later sessions.
An absolute range can also be selected by entering a start and end date in the Custom Date Range section.
An absolute range stops automatic refresh
In ranges selected by entering a start/end date, the panels do not refresh by themselves; the data is refreshed only with the refresh button. In addition, an absolute range is not stored as a user preference; when the screen is reopened, it returns to the relative range.
INFO
Refresh
Reloads the data in the panels instantly; the button becomes inactive while loading is in progress. Automatic refresh is enabled by default and the panels update by themselves every 10 seconds; the remaining time is shown with the progress ring around the button. On refresh, the cache is bypassed and the panels are loaded in sequence in groups of twenty.
INFO
Settings
The Dashboard general view and the display settings of the panels are accessed. The window is divided into three sections: Data (resolution and automatic refresh), Clustering (source selection; only while the cluster is enabled) and Visual (height and theme).
Chart Resolution
The resolution of the charts (data point density) is selected: High Resolution (1,440 points), Standard Resolution (720 points, default) or Low Resolution (360 points). High resolution provides a more detailed display, and low resolution a more performant one.
Auto-Refresh
The automatic refresh interval of the panels is set: Disabled, 5s, 10s, 30s and 60s. The default value is 10 seconds.
Source
In cluster setups, which member's data is shown is selected. The options are this device's name, the peer device's name and Both Devices; the default is Both Devices. This section is displayed only while the cluster is enabled.
Height
The height of the panels on the screen is set.
Theme
The display theme (color scheme) of the charts is selected: Professional (default), Corporate, High Contrast, Monochrome Blue and Colorblind Safe.
INFO
Panel View Icons
With the icons in the top right corner of each panel, the display format of the data is changed. The icons are displayed only if more than one view is offered in the panel; in a panel, only the views suitable for that data are enabled. For example, the map is offered only for geographic distribution panels, and the gauge only for percentage panels.
| Icon | View | What does it do? |
|---|---|---|
| Map | Shows the distribution on a map. In country panels, density is colored by country; in network type panels, the map is not geographic, and network groups are colored on their own projection. | |
| Line Chart | Shows the metric's change over time (its trend); in multi-series panels it can be drawn stacked. | |
| Bar Chart | Compares the values between series with side-by-side bars. | |
| Pie Chart | Shows the proportional share of the series within the total. | |
| Heatmap | Shows the series as color bands on the time axis; as density increases, the band "heats up". | |
| Stat Table | Lists the series in a sorted table with their summary values (last/average/highest/total); clicking a column header sorts by that column. | |
| Arc Gauge | Highlights a single percentage/ratio value with an arc-shaped gauge. | |
| 7:10 | Digital | Highlights summary values with large digits. A separate section is shown for each summary that is on, and a separate row for each series; a single large value display appears only in panels that have a single series and show a single summary. |
| Mini Chart | Shows the metric as a compact trend curve (summary card). | |
| Status Timeline | Shows status values as color bands on the time axis. |
The Mini Chart view is added automatically to every single-series panel that offers a line view; multi-series panels gain this view only if it is declared in their definition.
Panel-specific settings are reached from the panel's icon. Panels are moved by dragging from the handle in their title (not from any part of the card) and resized from their bottom right corner; a new panel is added to the tab with the Add Visualization card at the end of the layout. All layout changes made are stored specifically for the user.
INFO
Panel Metric Columns
Below each panel, the summary statistics of that metric are listed in columns for each series shown:
| Column | Meaning |
|---|---|
| Last value | The last (most recent) value in the selected range |
| Avg. value | The average value over the range |
| Max. value | The highest value in the range |
| Total | The total accumulated over the range |
The unit suffix in the column header changes according to the metric: it is displayed as Total requests and Avg. req/s in request panels, Total connections and Max. connections in connection panels, Total data in data panels, Total tp in throughput panels, Total sessions and Max. sessions in session panels, Avg. time in duration panels, and Total events and Avg. evt/s in count panels. In source IP panels, however, the columns carry the measurement window: Last / 10s, Avg / 10s, Max / 10s. The ten seconds here is the default value of the measurement window; when the window changes, the column headers change with it. The Active Source IPs panel is outside this family and carries the general Last value / Avg. value / Max. value columns.
Which summaries are present changes according to the metric type: Total exists only in rate metrics; in gauge panels Last value, Avg. value and Max. value are offered, while in status panels only Last value and Avg. value are present. Which of the existing summaries come enabled by default, however, changes according to the view:
- The Stat Table view lists all of the existing columns.
- The line and bar views show only Total in rate metrics and only Avg. value in gauge metrics.
- In the Map view, all summaries are enabled.
- In the Digital view, it changes according to the metric type: Frontend Request Count shows only Total requests, and vService Uptime only Last value.
- In the Pie view, only Total comes enabled in distribution panels.
Disabled summaries are enabled by clicking them in the strip below the panel. By clicking the series names in the same strip, individual series are also hidden and shown.
The summary strip does not appear in the line view of multi-series panels
The summary boxes open in the line view (and in the heatmap, status timeline and mini chart views derived from it) only if there are at most six series in the panel. For this reason, no summary is shown in the line view of the country distribution (more than 250 series), network type distribution and distribution panels with many Backend Services. The bar, pie, table and map views are not affected by this threshold; the summaries are read from these views.
View Tabs
Dashboard contains top tabs that group the panels by topic. By default, the Summary tab comes open; if another tab has been selected before within the same navigation, that tab is remembered. The open tab is written to the address bar.
 View Tabs
| Tab | Visibility Condition | Content |
|---|---|---|
| Summary | Always | Core panels that summarize the vService's general status. |
| HTTP Frontend | If the vService is of HTTP type | Request count, response code distribution, compression and cache panels. |
| Source IP Based | Always | Density panels per source IP. |
| Distribution | If the vService is of HTTP or L7 TCP type | Country and network type breakdowns. |
| Backend | Always | Distribution and health panels across Backend Services. |
| Network | Always | Connection, session, throughput and bandwidth panels. |
| System | Always | The vService's own CPU, memory and uptime panels. |
| SSL | If TLS termination exists on at least one of the vService's listeners | TLS connection and session reuse panels. |
| Traffic Mirroring | If at least one Traffic Mirroring rule is defined on the vService | Mirrored request flow and dropped copy panels. |
| Action Hits | If hit counting is enabled on at least one rule bound to the vService | Per-rule hit panels. |
A tab being visible does not mean that data is produced
A view tab can be displayed even if none of the panels in it produce data for that vService. The most obvious example is the Source IP Based tab: in Network (layer4) type vServices, the tab is visible but all of the panels in it drop out, and only the Add Visualization card remains in the tab. When a panel's condition is not met, the panel is not shown empty; it is not created at all.
The same panel can be located in more than one tab; below, each panel is described in detail only in the tab where it first appears, and its repetitions are linked to the related description.
Summary Tab
The Summary tab gathers the core panels that summarize the vService's general status. The panels in this tab are hand-picked; depending on the vService's type, some of them drop out. An HTTP vService has at most nine panels (eight if no health check is defined, since Backend Health is conditional); in L7 TCP the request and response code panels, and in a Network vService additionally the map and the source IP panel also drop out.
Requests by Country
Shows the country distribution of incoming requests on a world map according to the geographic location of the source IP. Each series corresponds to a country; traffic from local and private networks is gathered in the Local Networks series, and this series is always shown even if its value is zero. Countries that have not produced records in that period are not listed. The view can be switched between map, heatmap, table, bar and pie.
This panel counts requests only in HTTP vServices. In L7 TCP vServices, the panel is replaced by Connections by Country, which shows the same breakdown over the connection count; in Network vServices, the panel is not created at all.
vService Uptime
Shows the vService's uninterrupted running time (Uptime series). Last value is printed as the summary; the value is shown in a readable format such as 2h 58m 55s. A reset of the duration means that the vService has been restarted. The panel exists in every vService type.
Frontend Request Count
Shows the total HTTP request rate coming to the vService (Requests series). Total requests is printed as the summary. The panel is produced only in HTTP vServices; since the concept of a request does not exist in L7 TCP and Network vServices, the panel is not created.
Frontend New Connections
Shows how many new connections are opened to the vService per second (Connections series). Total connections is printed as the summary. The panel is produced in all three vService types; in L7 TCP and Network vServices, which have no request counter, the load size is read from this panel.
Frontend Bandwidth
Shows the amount of data passing through the vService as two series: RX (received from the client) and TX (sent to the client). Total data is printed as the summary for each series. The panel is produced in every vService type and is the default primary metric of the vService rows in the Left Monitor Panel.
Frontend Response Distribution
Shows the distribution of the responses produced by the vService by HTTP status code classes as six series. The series are drawn stacked; the Y axis is the number of requests per second. A shift in the error rate (growth of the 4xx or 5xx band) is read from this panel.
| Series | Meaning |
|---|---|
| 1xx | Informational responses; seen in protocol upgrade traffic. |
| 2xx | Successful responses. In a healthy vService, this series makes up most of the band. |
| 3xx | Redirection responses. Redirection to HTTPS or Location Redirection rules grow this series. |
| 4xx | Client-side errors. Responses produced by rules that make a blocking decision are counted in this series by default; if the rule's response code is changed, the response is written to the series of whichever class it falls into. |
| 5xx | Server-side errors. Because the counter measures the response the vService returns to the client, the errors coming from the Backend Service and the errors produced by TR7 itself are combined in this series. For only the codes returned from Backend Services, the Backend Response Code Distribution panel is used. |
| Other | Responses that fall into none of the classes above. |
The panel is produced only in HTTP vServices. Because it has six series, the summary boxes are shown; if a seventh series were added, the strip would close.
Active Source IPs
Shows the number of distinct source IPs sending traffic to the vService at that moment (Active Source IPs series). The number is read from the source IP tracking table; this table runs in every HTTP and L7 TCP vService independently of the protection settings. In Network vServices, the panel is not created.
Backend Health
Shows one series for each Backend Service with a health check defined; if the value is Up, the service is up, and if it is Down, it is out of service. The series name is the Backend Service's name. The intermediate value produced while the service's status is changing is displayed on the chart as 50% Up; this shows the transition moment when the check's result has not yet been finalized.
The panel is displayed only if a health check is defined
This panel requires that a Health Check is defined on at least one of the Backend Services bound to the vService. If none of them has one defined, the panel is not created. The data is collected not through the vService but from the health check itself; for this reason, if the same Backend Service is used in more than one vService, the same chart is displayed in all of them.
Frontend Concurrent Sessions
Shows the number of concurrent sessions open on the vService at that moment (Current Sessions series). Avg. sessions and Max. sessions are printed as the summary. In L7 TCP vServices, the panel is placed in this tab as a mini chart instead of a digital value. The panel is produced in every vService type.
HTTP Frontend Tab
The HTTP Frontend tab is visible only in vServices of HTTP type and gathers the client-side HTTP processing metrics.
The repeated panels located in this tab (their descriptions are in the Summary tab):
- Frontend Request Count: placed here as a line chart. See Frontend Request Count.
- Frontend Response Distribution: placed here as a bar chart. See Frontend Response Distribution.
Compression
Shows the gain provided by compression as two series: Bytes Before Compression and Bytes After Compression. The difference between the two is the bandwidth gained by compression. The panel is produced only if a Compression profile is assigned to the vService.
Frontend Cache
Shows cache effectiveness as two series: Cache Lookups (the number of requests looked up in the cache) and Cache Hits (the number of requests served from the cache). The panel is produced only if a Caching profile is assigned to the vService.
Frontend Cache Hit Ratio
Shows the share of requests served from the cache within the total as a percentage (Hit Ratio series). As the ratio rises, the load going to the Backend Services decreases. The panel is bound to the same condition as the Frontend Cache panel.
Source IP Based Tab
The Source IP Based tab shows how traffic is distributed among source IPs. Each of the five window panels in the tab carries two series: Peak (worst source IP) is the value of the single busiest source IP in that window, and p95 (bulk upper edge) is the upper edge of the source IP mass. A widening gap between the two shows that the load is piling up on a single source.
Values are 10-second window counts, not per-second rates
The values of the five panels in this tab are counts accumulated in a fixed 10-second measurement window; they are not per-second rates. The metric columns also reflect this: Last / 10s, Avg / 10s, Max / 10s. The values in the panels are not summed across cluster devices; they are drawn separately per device.
The repeated panel located in this tab (its description is in the Summary tab):
- Active Source IPs: see Active Source IPs.
Connections per Source IP
Shows the number of connections a single source IP opens in ten seconds. The panel is produced in HTTP and L7 TCP vServices.
Requests per Source IP
Shows the number of HTTP requests a single source IP sends in ten seconds. The panel is produced only in HTTP vServices.
Errors per Source IP
Shows the number of client-side error responses a single source IP receives in ten seconds. A pile-up of errors from a single source is the first indicator of scanning or faulty client behavior. The panel is produced only in HTTP vServices.
Outgoing Traffic per Source IP
Shows the amount of data sent to a single source IP in ten seconds. The panel is produced in HTTP and L7 TCP vServices.
Incoming Traffic per Source IP
Shows the amount of data received from a single source IP in ten seconds. The panel is produced in HTTP and L7 TCP vServices.
Distribution Tab
The Distribution tab examines traffic with geographic and network type breakdowns. The tab exists in HTTP and L7 TCP vServices. The unit of measure changes according to the vService type: in HTTP vServices the breakdowns are built on the request count, and in L7 TCP vServices on the connection count. An HTTP vService has eight panels, and L7 TCP six.
The repeated panel located in this tab (its description is in the Summary tab):
- Requests by Country: located as two separate panels, with both a map and a summary table view. See Requests by Country.
Connections by Country
Shows the distribution of connections by source country. In HTTP vServices, it is located next to the request breakdown as a second view; in L7 TCP vServices, on the other hand, it is the only source of the country breakdown. It is not produced in Network vServices.
Requests by Network Type Group
Breaks down traffic by the network type group to which the source IP belongs. The groups consist of cloud and hosting providers (such as Amazon AWS, Microsoft Azure, Google Cloud, OVH, Hetzner), CDN, mobile/CGNAT, residential networks, Tor exit nodes and verified bots. In the tab, the same data is presented in three separate panels: map, summary table and heatmap. The heatmap is used to distinguish source groups that show continuity as color bands on the time axis.
The series are produced from the network type database; if the database is not loaded, the panel is displayed but shows no series.
Requests by Network Type Category
It is the counterpart of the network type breakdown at the broader category level; it shows the upper totals of the group breakdown.
Connections by Network Type Group
It is the counterpart of the network type group breakdown over the connection count. In HTTP vServices, it is located next to the request breakdown as a second view; in L7 TCP vServices, all of the map, table and heatmap views are produced from this panel.
Connections by Network Type Category
It is the counterpart of the network type category breakdown over the connection count. The panel is located only in L7 TCP vServices and takes the place of the Requests by Network Type Category panel there; in HTTP vServices, the category breakdown is shown over the request count.
Backend Tab
The Backend tab shows how traffic is distributed among Backend Services and how the backend responds. In the distribution panels in this tab, each Backend Service is a series and the series name is the service's own name; for this reason, the number of series changes according to the number of services bound to the vService.
Backend Request Distribution
Shows the distribution of requests among Backend Services. Whether the load balancing algorithm works as expected is read from this panel. The panel is produced only in HTTP vServices.
Backend Response Time Distribution
Shows each Backend Service's response time in milliseconds. A single service diverging from the others points to a slowdown in that service. The panel is displayed only in HTTP vServices.
Backend Current Sessions Distribution
Shows the number of sessions open on each Backend Service at that moment. Data is produced only in HTTP and L7 TCP vServices. This panel is the only exception to the rule that panels whose condition is not met are not created at all: in Network type vServices, the panel is located in the layout but stays permanently empty because no data is written.
Backend Queue Distribution
Shows the number of queued requests for each Backend Service. A growing queue means that the service is hitting its concurrency limit. The panel produces data in HTTP and L7 TCP vServices.
Backend Connect Time Distribution
Shows the connection establishment time to each Backend Service. A rise in this time points to the network path in between rather than the service itself. The panel produces data in HTTP and L7 TCP vServices.
Backend Connections Distribution
Shows the number of connections opened per second to each Backend Service. The panel produces data in all three vService types; in Network vServices, backend distribution is monitored from this panel.
Backend Response Code Distribution
Breaks down the response code classes by Backend Service; each series is labeled in the format <service name> / <code class>. Whether the error has spread to the whole backend or originates from a single service is read from this panel. The panel is produced only in HTTP vServices.
The number of series grows quickly
In this panel, the number of series is equal to the number of Backend Services multiplied by the six code classes. If there is more than one service, the number of series exceeds six; in this case, when switching to the line view, the summary boxes are not shown. The panel's default bar view and table view are not affected by this threshold.
The repeated panel located in this tab (its description is in the Summary tab):
- Backend Health: see Backend Health.
Backend Health Check Timing
Shows the response time of health checks by Backend Service. A climbing check duration gives a warning before the service goes out of service. The panel is bound to the same condition as the Backend Health panel, and its data is again collected from the health check itself.
Network Tab
The Network tab gathers connection and data volume metrics. All five panels in the tab produce data in all three vService types; for this reason, this is the core tab for monitoring Network vServices.
The repeated panels located in this tab (their descriptions are in the Summary tab):
- Frontend New Connections: placed here as a line chart. See Frontend New Connections.
- Frontend Concurrent Sessions: placed here as a line chart. See Frontend Concurrent Sessions.
- Frontend Bandwidth: placed here as a stacked line chart. See Frontend Bandwidth.
Frontend Throughput
Shows the total data flow passing through the vService as a single series (Throughput series). In capacity assessments that do not require a direction distinction, this panel is read instead of the Frontend Bandwidth panel.
Backend Bandwidth Distribution
Breaks down the data flow by Backend Service; the RX and TX series are drawn separately for each service. This panel is located not in the Backend tab but in the Network tab.
System Tab
The System tab shows the vService's own resource usage. The tab exists in every vService type and data is produced in every type. The values in this tab belong not to the whole device but only to that vService; for the device as a whole, Home Dashboard is used.
vService CPU Usage
Shows the vService's processor usage as a percentage (CPU Usage series). The value is calculated as the complement of the idle time, and threshold coloring is applied.
vService Memory Usage
Shows memory usage as two series: Memory Used and Memory Available. If the memory limit is not reported, the available memory series stays empty and appears as a gap on the chart.
vService Memory Usage %
Shows the ratio of memory usage to the limit as a percentage (Memory Used % series); threshold coloring is applied.
The repeated panel located in this tab (its description is in the Summary tab):
- vService Uptime: placed here as a digital value. See vService Uptime.
SSL Tab
The SSL tab is visible if TLS termination is performed on at least one of the vService's listeners. The tab's visibility condition and the data production condition are the same: if the tab is visible, the panels' data is also being produced. The measurement mainly belongs to the TLS layer between the client and TR7. SSL Session Reuse counts only client-side sessions; the connection counters, on the other hand, are read from the general TLS counters kept by the process.
SSL Concurrent Connections
Shows the number of TLS connections open at that moment (Concurrent SSL Connections series).
SSL New Connections (TPS)
Shows the number of new TLS connections established per second (New SSL Connections series). This value is a direct indicator of the TLS handshake cost.
SSL Session Reuse
Shows as a percentage how much of the TLS sessions are reused (Session Reuse % series). A rising ratio means that the handshake load has dropped. In cluster setups, this panel's value is not summed across devices; it is averaged.
Traffic Mirroring Tab
The Traffic Mirroring tab is visible if at least one Traffic Mirroring rule is defined on the vService, and it allows the fate of the mirrored traffic to be monitored. The five panels in the tab are produced from three chart definitions; the flow and dropped copy panels are located with both a chart and a table view.
Mirror Flow
Shows the mirroring flow as three series: Mirrored (requests taken to be copied), Completed (copies delivered to the target) and Skipped (requests passed without being copied).
In-flight Copies
Shows the number of copies that are on the way at that moment and not yet completed (In-flight series). In this panel, three summaries come enabled at once; in this version, the summary headings are taken from the data rate family and are displayed as Last data/s, Avg. data/s, Max. data/s.
Dropped Copies
Shows the dropped copies as three series according to their reasons: Capacity (because the concurrent copy capacity is full), Body Size (because the body size limit is exceeded) and Error (due to an error). The series are drawn stacked.
Action Hits Tab
The Action Hits tab is visible if hit counting is enabled on at least one of the rules bound to the vService. In the tab, the same data is presented in two panels: a stacked line chart and a summary table sorted in descending order by total.
Action Hits
Shows one series for each rule with counting enabled; the series name is the rule's live name. When a rule's name is changed, the label on the chart is refreshed at the next definition resolution; because the record is kept with the rule's identity, historical data is preserved. Which rules actually matched and which ones received no hits at all is read from this panel. How counting is enabled per rule is described on the Actions page.
Scope and Limits
INFO
- Access to the dashboard is opened with Load Balancer permission. The general vService charts also require Load Balancer permission; on a user with only WAF permission, the screen does not open. The tabs do not differ by permission; all view tabs are displayed with the same permission. WAF charts added to the dashboard later, however, additionally require WAF permission.
- Layout settings do not differ per vService. Adding, moving and resizing panels, templates and toolbar preferences are stored in a single place per user; an edit made in one vService is visible in all vService dashboards.
- At most 32 panels per tab and at most 16 custom templates per user can be created. When the limit is reached, a warning is displayed.
- A version update resets the saved layout. When the dashboard version changes, the stored templates, panel arrangement and toolbar preferences return to default.
- The open tab is written to the address line. The view tab selection is preserved within the same navigation; when re-entering from another screen, it returns to the first template. If tab information is carried in the address line (a shared link or switching to another vService of the same type), this information takes precedence over the remembered selection and that tab opens.
- Reset and delete operations require confirmation. Each of the template reset, template delete and full dashboard reset operations shows a separate confirmation window.
- The data collection interval widens according to the number of vServices. While there are up to 20 enabled vServices on the device, metrics are collected once per second; as the number of vServices increases, the interval gradually widens up to 20 seconds. Heavy breakdown tables such as country and network type are additionally read less frequently; for this reason, gaps in these panels are normal.
- Fine-resolution history is shorter in breakdown panels. Traffic and connection panels go back 14 days at minute resolution; in country and network type breakdowns, the same resolution is kept for only 1 day. This difference is taken into account in long-term comparisons.
- Panel operations. The gear menu in the top right corner of each panel contains two operations: Edit (the panel's settings) and Remove (removing the panel from the dashboard). By dragging from the handle in the bottom right corner of the panel, the panel is resized; during dragging, the target size is shown with a ghost frame and a badge in the
1 × 0.5format. When the panel height drops below a full card, the title and summary strip are hidden; they are displayed again when hovered over.
