
Smarter by Design.Simpler for Business
Interfaces - Dashboard
What Is Dashboard?
Dashboard is the monitoring dashboard that shows the behavior of a single network interface over time. Whether the interface is up, whether there is a carrier signal on its line, how much data and how many packets it carries and how many errors and dropped packets it produces are monitored on the same screen, over a selectable time range.
The dashboard is per interface: every interface has its own dashboard and all the series shown belong only to that interface. The data is collected every two seconds and is stored in steps from a resolution of seconds to a resolution of days; for this reason both the last five minutes and the past year are looked at from the same screen.
The layout of the dashboard is not fixed. The panels are moved, resized, their view is changed, they are removed and new ones are added; next to the ready tabs the user also defines their own tabs. All these preferences are stored in the user account and have no effect whatsoever on the traffic or on the configuration.
5
View Tabs
Summary · Traffic · Packets · Errors · Notifications; all five are seen unconditionally
2 Seconds
Measurement Period
The interface counters are read and written to the record every two seconds
10 Years
Longest Retention
Nine resolution steps: the data of seconds is kept for one minute, the daily summary for ten years
Last 1 day(s)
Default Range
The screen opens with the last one day; the ready ranges extend from five minutes to five years
10 Seconds
Auto-refresh
It is on by default; it stops by itself when an absolute date range is selected
32
Panels per Tab
The user also defines at most 16 tabs of their own
Per User
Layout Storage
The panel layout and the settings are kept in the user account; they do not touch the configuration
Monitoring Only
Authorization
Seeing the dashboard requires monitoring authorization in the Network area; editing panels requires no additional authorization
The dashboard is not created for every interface
The dashboard is produced for the interfaces defined in the advanced network configuration: the physical interfaces and the VLAN, VXLAN, virtual interface, bond, LACP and bridge types all get the same dashboard.
VIP addresses have no dashboard, because a VIP is not an interface but an address record on an interface. The management interface, the loopback and the virtualization bridges do not enter the advanced network world at all, so they are neither listed nor given a dashboard.
Accessing Dashboard
- Left Monitor Panel is opened.
- Interfaces is selected from the category tabs at the top left.
- The network interfaces defined on TR7 are listed.
- The interface to be monitored is clicked; the screen opens with the tab that carries the name of the interface and the Summary view comes.
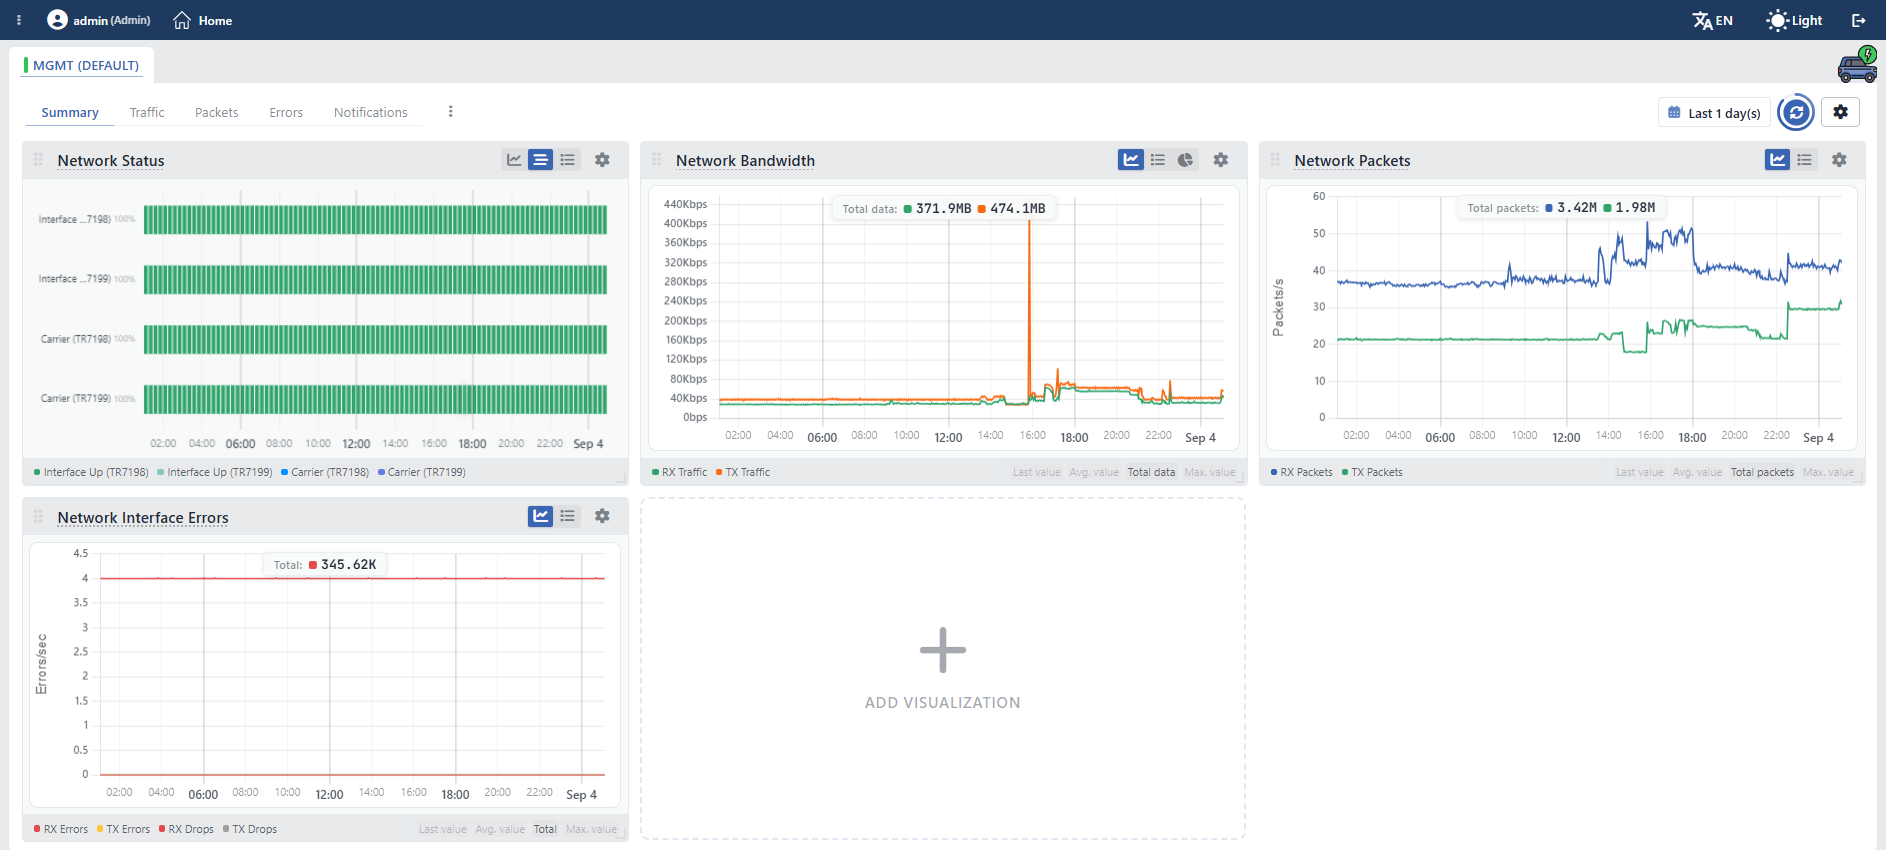 Interfaces Dashboard
The dashboard is also reached from the link on an interface notification. This dashboard is not passed to from the interface list screen: the Stats action there opens a separate graph and notification surface of the route table the interface is bound to; it is not the dashboard described here.
The Tab Strip
The tab at the very top of the screen shows the interface the dashboard belongs to. The label is the name of the interface; if more than one route table is defined, the name of the route table the interface is bound to is added in parentheses (e.g. MGMT (DEFAULT)). If there is a single route table, the part in parentheses is not written.
The colored mark on the left of the name is the status of the interface in the system: Up (green), No Link (the warning color), Down (dimmed), Absent in System (red) and, when the device cannot be reached, Host is down. The mark is derived from the same two pieces of information as the Interface Up and Carrier metrics on the dashboard; however, it reads this information from the live state, not from the record file of the dashboard.
The editing operations started from the preview panel (editing the interface, adding an address and a route) are added to this strip as closable tabs.
The Interface Preview Panel
On the right of the dashboard there is the preview panel that carries the summary information of the selected interface.
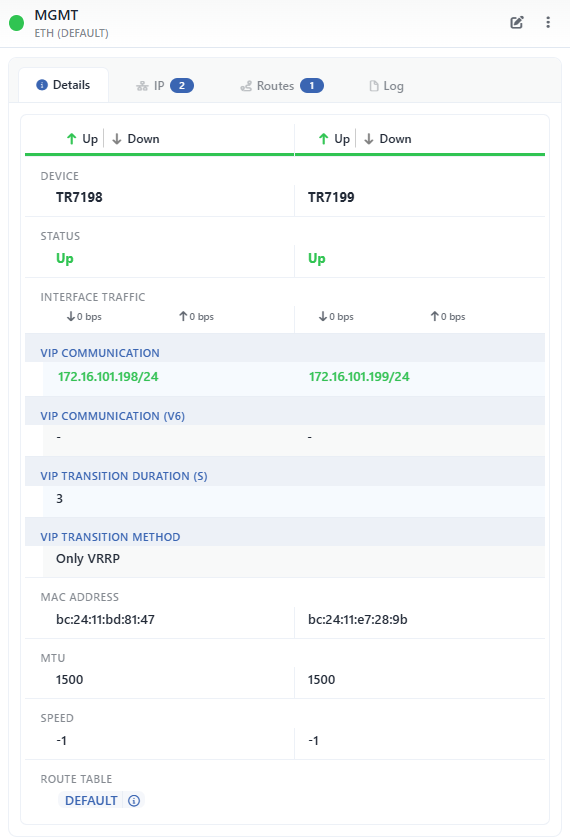 The Interface Preview Panel
Panel Header
In the header there are the name of the interface, below the name a subtitle that describes its type and the route table it is bound to, and on the left the colored circle that shows its status.
The name, unlike in the tab strip, does not carry the route table suffix; that information goes down to the subtitle. The subtitle changes according to the type of the interface and describes its structure as well: such as ETH, VLAN10@LAN, BOND[eth0,eth1], V-ETH@eth2 or, in paired virtual interfaces, eth0 <-> eth1.
The status circle takes the same values as the mark in the tab strip: Up, No Link, Down, Absent in System and Host is down. In cluster setups the circle is in two halves; the left half shows the status of this device and the right half that of the peer device. When each half is hovered over, a separate tooltip is displayed: the name of the related device is written at the top and the status on that device below it.
At the top right there are two controls and both of them require change authorization in the Network area:
| Button | Function |
|---|---|
| Edit interface | Opens the editing form of the interface as a closable tab in the tab strip. |
| Menu | Carries two operations that turn the interface on and off manually: Up and Down. |
The delete operation is not present on this screen
The same preview header also carries the Delete interface operation on the interface list screen. On the dashboard this operation is never displayed: an interface is not deleted from the screen on which its dashboard is open.
Panel Tabs
There are four fixed tabs in the panel; the fifth one is conditional. Next to the name of the IP and Routes tabs the number of defined records is displayed as a badge.
| Tab | Its content |
|---|---|
| Details | The status of the interface, its instant traffic, MAC address, MTU value, connection speed and the route table it is bound to. |
| IP | The addresses defined on the interface. |
| Routes | The routes defined over the interface. |
| Network topology (conditional) | The structure the interface is built on. It is displayed only if the interface has a hierarchy: it appears in the types that are built on other interfaces, such as VLAN, VXLAN, virtual interface, bond and bridge. When a node in the diagram is clicked, that interface is passed to. |
| Log | The records that belong to the interface. |
In a cluster setup the Details tab shows the two devices side by side: at the head of every column there is the name of the device and below it the values on that device. The VIP address is also written separately per device, because every device has its own address. On the other hand, the information that does not depend on the device, such as the VIP transition time, the VIP transition method, the route table bound to and the description, is displayed in a single row that covers the two columns together.
View Levels
The network monitoring view is offered at two levels:
| Level | Scope |
|---|---|
| Route table | The dashboard of a route table itself: it shows the total of the interfaces bound to that table and is much wider than the interface dashboard. It carries eight view tabs; the ones other than Summary and Network cover L4 DDoS subjects such as flood, connection limit, suspicious packet, quarantine and dropped traffic. The Gateway Check tab is displayed only if a gateway check is defined in that route table. The dashboard is reached over the Left Monitor Panel, from the Route Tables & L4 DDoS category. |
| Interface | The dashboard of a single selected interface (the screen described on this page). |
This page describes the dashboard at the interface level. The panels here show only the data of the selected interface; the route table totals and the gateway check have deliberately not been taken into this dashboard.
Screen Controls
On the right of the tab strip there are the controls that affect the whole dashboard.
 Screen Controls
INFO
Menu
This button immediately on the right of the view tabs is not an overflow menu; it opens the template menu titled Settings and manages the tabs themselves:
| Operation | What it does |
|---|---|
| Create New Template | Creates a new user tab. |
| Duplicate Current | Takes a copy of the selected tab. |
| Edit Template | Edits the name of the tab; it opens a window with a single field and is active only in user tabs. |
| Reset to Default | Deletes the editing saved in the selected tab; it is active only if there is an editing saved in that tab. It asks for confirmation. |
| Remove Template | Deletes the user tab; it is not active in the ready tabs. It asks for confirmation. |
| Reset All to Defaults | Resets the whole dashboard: all the user tabs and all the editings are deleted. It asks for confirmation. |
There are two more shortcuts on the tabs: double click returns the tab to the default (it asks for confirmation) and middle click removes the user tab.
Reset to Default and double click are not limited to the ready tabs. When they are applied in a user tab, since there is no default to return to, the tab is emptied: all the panels in it are removed and this cannot be undone. The only way to bring a user tab back to its former state is to add the panels again.
INFO
Last 1 day(s) Time Range
It determines the time range that all the panels on the dashboard cover. The default value is the last one day.
The ready ranges are the 5m, 15m, 30m, 1h, 3h, 12h, 1d, 3d, 7d, 1M, 3M, 6M, 1y and 5y values in this order. Besides these, a free period entry (minute, hour, day, week, month, year) and an absolute range defined by giving a start and an end date are also used.
The selection is stored in the user account; only the absolute range selection is not stored.
INFO
Refresh
It fetches all the panels again. While the operation continues, the icon turns and the button becomes passive.
The ring around the button is the countdown of the auto-refresh. Auto-refresh is on by default and works every 10 seconds. When an absolute start and end are selected as the time range, auto-refresh stops by itself; it works only in ranges in the form of "the last N units".
INFO
Settings
It gathers the general settings of the dashboard in three sections.
Data
| Setting | Options | Default |
|---|---|---|
| Chart Resolution | High Resolution · Standard Resolution · Low Resolution | Standard Resolution |
| Auto-refresh | Disabled · 5s · 10s · 30s · 60s | 10s |
Clustering (displayed only in a cluster setup)
| Setting | Options | Default |
|---|---|---|
| Source | The name of its own device · the name of the peer device · Both Devices | Both Devices |
Visual
| Setting | Options | Default |
|---|---|---|
| Height | The height of the panels on the screen | - |
| Theme | Professional · Corporate · High Contrast · Monochrome Blue · Colorblind Safe | Professional |
Every change is written to the user account instantly.
INFO
Panel View Icons
In the header of every panel the views that panel supports take place as icons and are passed to by clicking. If only a single view is supported in a panel, the icon group is not displayed.
| Icon | View | Meaning |
|---|---|---|
| Line | Line Chart | A series graph on the time axis. |
| Strip | Status Timeline | A time strip consisting of status boxes. |
| List | Stat Table | The numerical summary of the series. |
| Pie | Pie Chart | The ratio of the series to one another. |
The handle on the left of the header is used to drag the panel and reorder it, and the handle at the bottom right corner to resize the panel; the resizing settles into half-card steps.
INFO
Panel Settings
The gear at the right end of the panel header offers two operations:
- Edit — edits the Section (which graph), Visualization Type (the view), Row Span and Column Span values of the panel. Its color, threshold, unit and data source are fixed in the definition of the graph and are not changed from here.
- Remove — removes the panel from the tab. It does not ask for confirmation.
INFO
Panel Metric Columns
On the strip below the panel, on the left there is the colored legend of the series and on the right the aggregation boxes: Last Value, Avg. Value, a total box and Max. Value. Clicking a box turns that value on or off; the values that are on are also shown in a floating box over the graph.
In the line chart view only the total box is on by default. The box that is on carries its long name specific to the graph, and the ones that are off their general short name. For this reason the total box writes Total Data on the Network Bandwidth panel, Total Packets on the Network Packets panel and only Total on the Network Interface Errors panel.
The meanings of the values are as follows:
| Box | How it is calculated |
|---|---|
| Last Value | The last valid measurement in the selected range. |
| Avg. Value | The average of the range; it is calculated only over the period that carries data. |
| Total | The total of the rate over time, that is, rate × period. In bandwidth this is the total amount of data carried in the range. |
| Max. Value | The highest value in the range. |
The MAX badge on the left of the strip is not an aggregation function: it turns the highest value band on and off. When it is turned on, the peak values of the same series are added behind the average line as a semi-transparent band; the purpose is to make the sudden jumps that the average swallows in wide time ranges visible.
The badge is not present on every panel. If the view is not a line chart, if the number of visible series is zero or more than two, if the series are stacked on top of one another or if in a cluster the data of the two devices is shown combined, the badge is not displayed. For this reason it is not present on the Network Status and Network Interface Errors panels; on the Errors panel it comes back when the series are turned off from the legend row and the number is brought down to two.
View Tabs
The dashboard offers five ready tabs. All five are seen unconditionally and their order is fixed.
 View Tabs
| Tab | Its content |
|---|---|
| Summary | Four panels at once: the status strip, the bandwidth, packet and error graphs. |
| Traffic | The Network Bandwidth graph, the numerical table of the same data and the Network Status status strip. |
| Packets | The Network Packets graph and its numerical table. |
| Errors | The Network Interface Errors graph and its numerical table. |
| Notifications | The notification records that belong to the interface. |
Add Visualization
The ADD VISUALIZATION slot at the end of the grid adds a new panel to the selected tab. In the Dashboard Section window that opens there are four fields: Section (which graph), Visualization Type (the view), Row Span and Column Span.
The graphs listed change according to the selected tab: on the Summary tab all five graphs of this interface, and on the other tabs the graphs that fall within the subject of that tab are offered. The list contains only the graphs of this interface, not those of other interfaces.
The panel is added not to the dashboard but to the tab selected at that moment and the preference is stored in the user account. There can be at most 32 panels in a tab.
Summary Tab
Network Status
It shows whether the interface is up and whether there is a carrier signal on its line as a time strip. It carries two series:
| Series | What it measures |
|---|---|
| Interface Up | Whether the interface is administratively up. |
| Carrier | Whether there is a physical carrier signal on the line of the interface. |
The difference between the two comes out in the No Link status in the tab header: the interface is up but it has no cable or line. In this case Interface Up appears full and Carrier empty.
The value of every series is between 0 and 1, and the percentage on the right of the row says in what percentage of the selected range the value is 1. That is, 100% means that the interface has stayed up without interruption throughout the range. This ratio is read not from the boxes of the strip but from the average the server calculates for the same range.
The panel can also be opened in the Line Chart and Stat Table views. In the status strip view there are no aggregation boxes below the panel; per row there is only the percentage badge.
In a cluster every device gets its own row
This panel, unlike the other three panels, does not combine the data of the cluster members. In a cluster setup the name of the device is added to the end of the series names and the strip goes up to four rows: Interface Up (<device>) and Carrier (<device>) separately for every device.
Network Bandwidth
It shows the amount of data the interface receives and sends per second. It carries two series: RX Traffic (received) and TX Traffic (sent). The Y axis is scaled automatically in bytes/second.
When the total box (Total Data) is turned on, the value is not a rate but the total amount of data carried in the range; for this reason the scale of that box also turns to absolute bytes.
The panel can also be opened in the Stat Table and Pie Chart views. The pie view shows the ratio of the received and sent traffic to one another together with the percentage.
Network Packets
It shows the number of packets the interface receives and sends per second: RX Packets and TX Packets. It is a measure that must be read independently of the bandwidth; a large number of small packets produces a high packet rate even at a low bandwidth.
The panel can also be opened in the Stat Table view; the pie view is not supported.
Network Interface Errors
It shows the errors the interface produces and the dropped packets. It carries four series:
| Series | Meaning |
|---|---|
| RX Errors | The frames counted as erroneous while being received. |
| TX Errors | The frames counted as erroneous while being sent. |
| RX Drops | The packets received but dropped. |
| TX Drops | The packets dropped while about to be sent. |
All four values are read directly from the interface counters of the operating system; TR7 does not recalculate them. The error counters point to a fault in the line or in the hardware, and the drop counters to queue and resource pressure.
The panel can also be opened in the Stat Table view.
The Traffic, Packets and Errors Tabs
These three tabs separate the graphs in Summary according to the subject heading and add the numerical table of the same data next to each of them. The table view lists the values that are hard to read on the graph (the last value, the average, the total, the peak) series by series.
On the Traffic tab the Network Status status strip also takes place: whether an interruption in the traffic is caused by the interface going down or by another reason is seen on the same screen.
The cluster behavior changes according to the view
In a cluster setup the graph views add up the data of the two devices and show a single RX and a single TX line. The only view that separates the devices is Stat Table: there every device gets its own row. The Pie Chart view of the Network Bandwidth panel also adds up; the slices separate not the devices but the received and sent traffic.
Which devices will be taken into account is changed with the Source selector in the settings window; the way of combining is not open to the user on this dashboard.
Notifications Tab
It carries a single panel: Interface Notifications. On this tab the panel is displayed in the full row width and at the height of two cards.
The panel is not a graph: it lists the notification log of the system by filtering it to the records that belong to this interface. The interface going up and down, its line coming and going, the address on it disappearing and coming back and the result of the gateway check appear as rows in this list. The first two events are the written counterpart of the moments when the Interface Up and Carrier series on the Network Status panel fall and rise.
This panel does not take the time range in the toolbar into account
The notification list works with its own time range: it opens with the last 48 hours and 15 rows are listed on the page. The range is changed from the selector of the panel itself; the range selected from the toolbar does not affect this panel.
Scope and Limits
- The dashboard is for monitoring only. The panel layout, the view selection, the time range and the settings are stored in the user account; none of them affects the interface configuration or the traffic.
- The layout is not stored per interface. The panel placement, the selected tab and the settings are kept common for all the interfaces: an editing made on one interface is also valid on the dashboard of the other interfaces.
- There can be at most 32 panels per tab; the user defines at most 16 tabs of their own. When the limit is exceeded, a warning is displayed.
- The data is collected every two seconds. The retention has nine steps and the resolution drops as one goes back: the data of seconds is kept for one minute, the resolution of five seconds for one day, the resolution of minutes for two weeks, the resolution of hours for two years and the daily summary for ten years. The steps in between (15 seconds, 5 minutes, 15 minutes and 6 hours) cover three days, sixty days, one hundred and eighty days and five years respectively.
- If there is no record that meets the selected range, the panel shows no data. If there is no record file at all or if no retention step meets that window, the No data recorded for the selected time range. warning is displayed; if the query succeeds but returns empty, the empty state layer of the card itself is written. In an unauthorized request an authorization warning is displayed instead of the data.
- Panel removal does not ask for confirmation. The Remove operation in the panel gear is applied directly; to undo it the panel is added again or the tab is reset with Reset to Default.
- Seeing the dashboard requires monitoring authorization in the Network area. Adding, removing panels and creating templates require no additional authorization; the editing operations started from the preview panel, on the other hand, look for change authorization.
- When an interface is deleted, its dashboard cannot be accessed. The moment the record falls out of the configuration, the interface is not seen in the list and its dashboard is not produced. The measurement file collected earlier is not deleted; if the same identity is used again, the old data appears again.
