
Smarter by Design.Simpler for Business
Live Stats
What Is Live Stats?
Live Stats is the tab that shows the current state of a vService with WAF protection enabled on a dashboard refreshed once per second. The health of the traffic engine that carries the vService, the result distribution of the WAF inspection, the category and OWASP breakdown of the detected attacks and the countries the attacks come from are monitored live, on a single screen.
The screen answers the question "what is happening right now?": when an attack wave starts, the rise of the blocking rate, which category is triggered and from which country the traffic comes are seen at the same time. When the value of a card changes, the card flashes with a short highlight and a direction arrow is printed next to the value; a rising metric is shown with a green arrow and a falling one with a red arrow. The arrow disappears by itself after a few seconds. Thus the operator looking at the screen notices what has changed before reading the numbers.
Live monitoring runs on the device itself: the data is read directly from the traffic engine, and no external collector, agent or analytics product is needed. The stream is established only while the screen is open; when another tab is selected or the session ends, the subscription is terminated and leaves no additional load on the device.
1 s
Live refresh
Data is refreshed once per second; the refresh interval is selected as 1, 5, 10 or 30 seconds
4 Sections
On a single screen
Frontend, WAF Inspection Distribution, WAF Detected Attack Requests and OWASP
6
Inspection result card
Six cards are shown on the dashboard: Whitelisted, Clean, Blocked, Monitor, Teacher, Learning
35+
Attack category
The category table lists all the categories; the ones that are never triggered are seen with a zero value as well
10 + 10
OWASP breakdown
The OWASP Web Top 10 and OWASP API Top 10 items are monitored live in separate tables
Map
Country breakdown
The detected attacks are colored on the world map according to the source country
Cluster
A dashboard per device
In a cluster setup, the data of each device is shown in its own column, without being mixed
Built-in
No agent required
Data is read directly from the traffic engine; no external collector or analytics product is required
Live Stats or Dashboard
The two screens use the same vocabulary but answer different questions. Live Stats shows the instantaneous state: the data is not stored, a time range is not selected, what is seen on the screen is always "right now". Dashboard, on the other hand, spreads the same metrics over time and archives them: the retrospective trend, the comparison and the report production are done from there.
Accessing Live Stats
- Left Monitor Panel is opened.
- WAF-Protected vServices is selected from the category tabs at the top left.
- The vServices defined on TR7 with WAF protection enabled are listed.
- The vService to be monitored is clicked; the screen opens with the Dashboard tab that carries the vService's name.
- On the screen that opens, the Live Stats tab is clicked.
The tab is displayed to the users who have the WAF authorization. The live stream starts the moment the screen is opened and the first data comes without waiting.
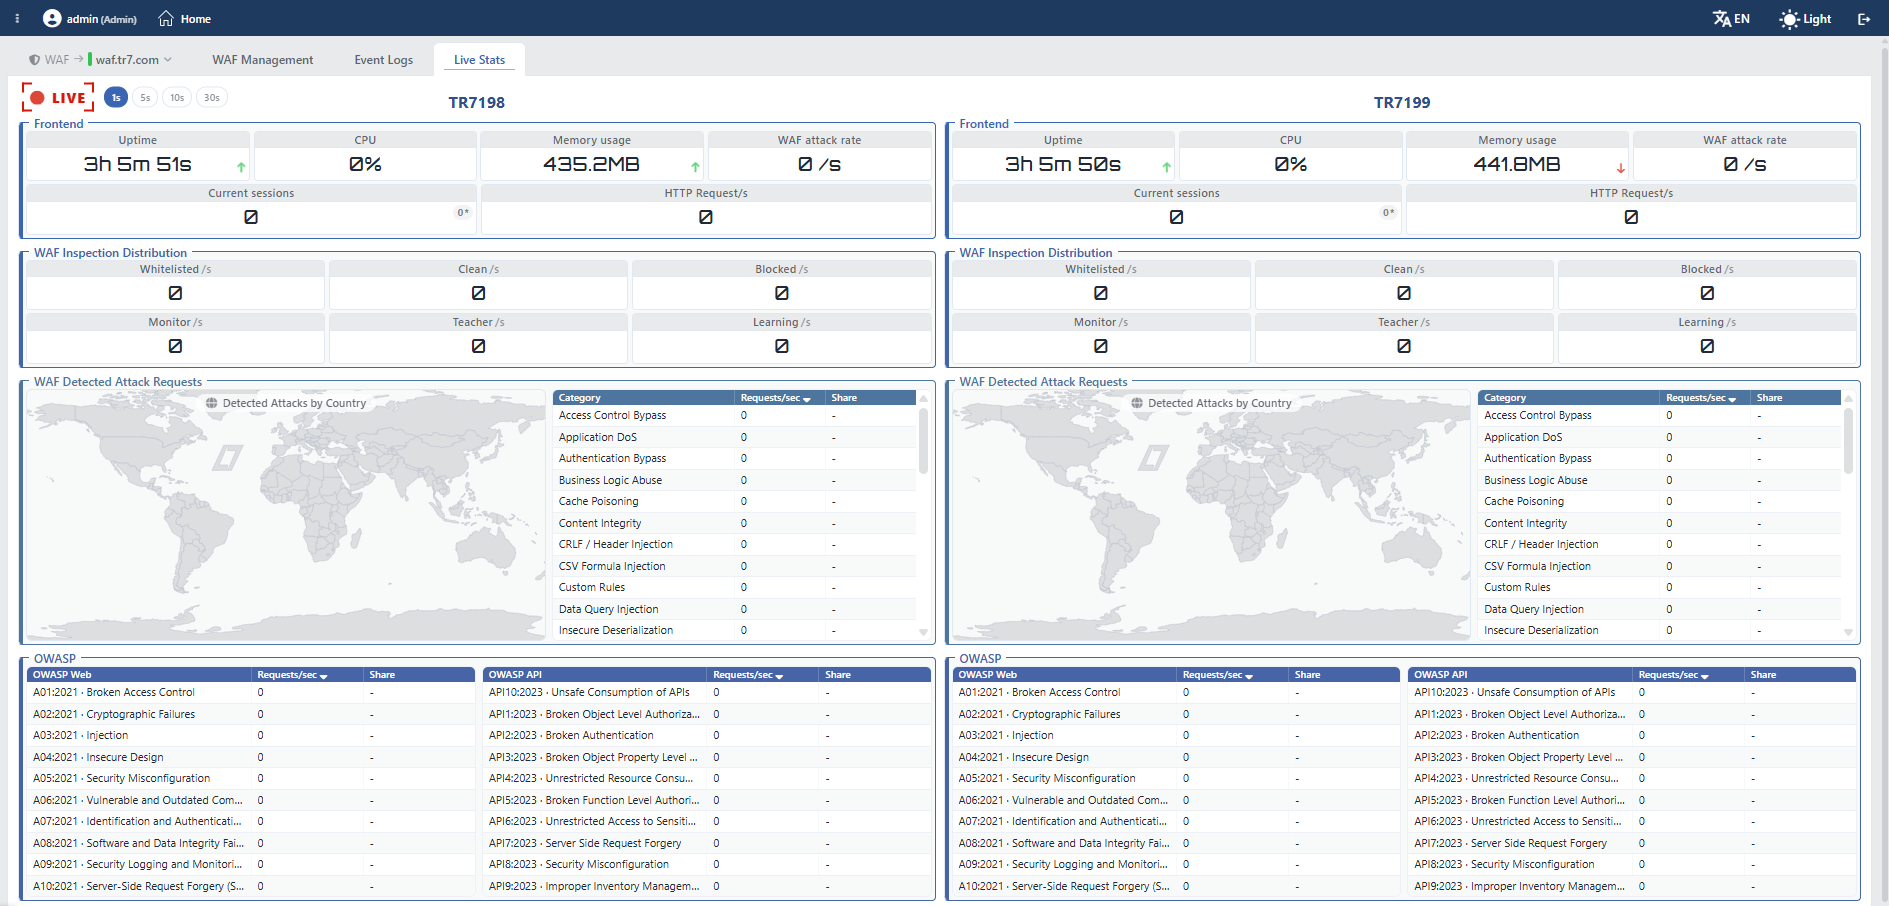 WAF Live Stats
Screen Controls
There are two controls at the top left of the dashboard:
- The LIVE indicator stops and restarts the stream. The indicator takes four states: a dim circle while not subscribed, a spinning wait sign while subscribed but before the first data has arrived, a circle that beats like a pulse while data is flowing, and a stop sign when five seconds have passed since the last update.
- With the 1s, 5s, 10s, 30s chips next to it, the refresh interval is selected; the default value is 1 second. The selection is stored per user and is preserved in the following sessions; the same preference is valid on all the HTTP vService dashboards of the user. When the interval is changed, the stream is set up again with a short interruption; during this, the rates read zero once.
In a cluster setup the dashboard shows every section in a separate column per device and the device names take place above the columns; in a single setup the column title is not written. The values are not summed between the devices: since the counter tables are not equalized across the cluster, every device shows only the traffic that passes over itself. When the peer device cannot be reached, the column of that device stays empty and a warning is not displayed on the screen separately.
Duration of the live stream
A live stream session lasts about 30 minutes; since the duration check runs once per minute, the stream ends by itself between 30 and 31 minutes. The values on the screen stay as they were last read and are not refreshed.
The end is not reported by the server: the indicator continues to appear active, only the pulse stops and the icon turns into the stop sign. If monitoring is to continue, the page must be refreshed, or the LIVE indicator must first be turned off and then turned on again. Changing the refresh interval also re-establishes the stream and restarts this duration.
Frontend
In the section the instantaneous state belonging to the traffic engine and the frontend of the vService is summarized in six cards. None of the cards shows the device as a whole; the three system cards also belong only to the own traffic engine of that vService.
| Card | What it shows |
|---|---|
| Uptime | The uninterrupted running time of the traffic engine. The value is written in steps according to the duration: below a day the hour, the minute and the second; in longer durations the day, the month and the year breakdowns are added as well. |
| CPU | The instantaneous processor utilization (%) of the vService's traffic engine. |
| Memory Usage | The instantaneous memory usage of the vService's traffic engine. |
| WAF Attack Rate | The number of attack requests detected per second. The requests detected in the blocked, the monitored and the teacher traffic are counted together. |
| Current Sessions | The number of client sessions open at that moment. In the tooltip of the card the peak value of the session number and the defined upper limit are displayed. In its badge, on the other hand, there is the number of requests that are going on to the Corporate Services at that moment; when the badge is hovered over, it is explained why this number is lower than the number of open connections (since the connections stay open between the requests, the number of requests being processed is normally much lower). |
| HTTP Request/s | The number of HTTP requests per second. If the traffic protection is enabled, the occupancy rate according to the defined soft limit is added as a badge; the color of the badge reflects the current pressure step of the traffic protection, and in the tooltip the soft and hard limits, the measurement window and the working mode are written. |
WAF Inspection Distribution
The fate of every request that passes the WAF inspection is written into a single category and six of these are shown on the dashboard as cards, with a per-second rate. A request is counted only into a single category; the categories are evaluated in order and the first one that fits wins. The evaluation order is different from the display order of the cards:
01TimeoutedThe requests that enter the WAF inspection but cannot produce a result because the scanning session has timed out. It is not shown on the dashboard as a card.
02WhitelistedThe requests that do not enter the inspection at all.
03LearningThe requests in the learning mode. Since Learning is evaluated before Teacher, the teacher traffic that comes to a host group in the Learning mode is written not into Teacher but here.
04TeacherThe requests that come with the teacher identity.
05MonitorThe monitored requests. Monitor is evaluated before Blocked.
06BlockedThe blocked requests.
07CleanThe requests that fit none of the above.
Timeouted, the first link of the chain, is not shown on the dashboard as a card; for this reason the sum of the six cards may not give the whole of the inspected traffic.
| Card | Meaning |
|---|---|
| Whitelisted | The requests that do not enter the WAF inspection at all. Four skipping reasons are gathered in this category: the static content requests left outside the inspection with the Do Not WAF Static Contents setting on the Whitelist & Blacklist screen, the conditional whitelist match on the same screen, the own AGS protocol traffic of the product and the CAPTCHA protocol traffic. On a site with mostly static content the first reason forms the greater part of this category. |
| Clean | The requests that pass the inspection and are caught by no rule. |
| Blocked | The requests that exceed the blocking threshold and are blocked. |
| Monitor | The requests that exceed the threshold but are not blocked because the host group is in the Monitor mode. |
| Teacher | The requests that are not blocked because they come with the teacher identity and that are a source for the false positive cleaning within the scope of Learning Methods. Only the teacher requests that exceed the blocking threshold are written here; the clean traffic that comes from the teacher counts as Clean. |
| Learning | The requests that are written into the learning record without the rule results being applied because the host group is in the Learning mode or because the source of the request matches the Conditional Learning identity (the IP address, the cookie or the header). |
The reading of the distribution
When the cards are read together, the current stance of WAF is seen: if Clean is high and Blocked is low, the traffic is normal; if Monitor is high, the related host group has not passed to blocking yet, the attacks are only being recorded; if Learning is high, the related host group is still in the learning phase and the rule results are not being applied.
WAF Detected Attack Requests
The section consists of two parts.
The Detected Attacks by Country map shows the distribution of the detected attacks to the source countries with the color density; as the density increases, the color turns from yellow to red. The color scale is logarithmic; for this reason the transition is not linear and the countries from which few requests come also stay visible on the map. The map can be dragged and zoomed; there is a separate button to return to the starting position. The sources that cannot be shown on the map are summarized below the map as chips: the first four sources are written one by one, the rest are combined in a single total chip and are listed one by one when it is hovered over.
In the table next to it the attacks are listed according to the categories. The table carries three columns: Category, Requests/sec and Share. In the table all the attack categories of the product take place; the categories that are not triggered at all at that moment also stay in the list with a zero value, so that the category list stays fixed and the comparison becomes easier. The hits of the user-defined rules are counted into no category in this table; in the same way they do not enter the OWASP tables and the map either. These hits are monitored over Event Logs. The sorting is changed by clicking the column title; the table is by default in descending order according to the rate.
The reading of the rate column
The Requests/sec column counts the rule matches. Since a single request can be caught by more than one rule and a rule can correspond to more than one classification, the sum of the rows may not be equal to the number of requests per second. The Share column also shows not the share of the requests but of the matches in the table. The same situation is valid for the OWASP tables as well.
Only the requests that count as an attack enter these tables
The category table, the OWASP tables and the map count not all the inspected matches but, as the name of the section also says, only the matches of the requests that have been detected as an attack. If a request has not been blocked and has not triggered a monitored rule either, it is not written into these tables even if it has been caught by the rules.
The traffic in the Learning mode is not seen in these tables at all. Since the inspection results are not applied in the learning mode, the counters are not operated either: while a host group is in the Learning mode, the category table, the OWASP tables and the map do not show the attacks belonging to that group. The monitoring of this traffic is done over Event Logs and Analysis & Learning.
OWASP
In the section two tables are displayed side by side. The tables do not carry a separate title; they take their identity from the first column titles: OWASP Web and OWASP API. Every table lists the ten items of the related list with their full names in the A01:2021 · Broken Access Control and API1:2023 · Broken Object Level Authorization form; next to them the Requests/sec and Share columns take place.
These tables show where the attacks fall in the common classification of the sector, independently of the own category naming of the product. During a compliance reporting or a security evaluation, the distribution of the attacks that come to the protected application to the OWASP items is read directly from here.
Scope and Limits
INFO
- The data is not stored. Live Stats shows only the instantaneous state; for a retrospective examination Dashboard, and for a detailed output the WAF report is used.
- No time range can be selected. The only window control is the refresh interval.
- There is no host group breakdown. The counters are across the vService; the host group based examination is done over Event Logs and the WAF report.
- Another screen is not passed to from the panels. The cards, the table rows and the map do not carry a link; for the detail examination Event Logs and Dashboard are used. The items that can be clicked on the screen are only the table column titles (the sorting), the map itself and the summary of the sources outside the map.
- The rates are per second independently of the selected interval. Selecting a 30-second interval does not enlarge the values; it only changes in how many seconds the dashboard is refreshed and over which window the rate is smoothed. A short interval is suitable for seeing the sudden fluctuations and a long one for reading the trend.
- Rates can read zero once on reconfiguration. Since the counters are reset when the traffic engine is reconfigured, the rates can read zero once in the refresh that coincides with that moment. The same happens when the refresh interval is changed: since the stream is re-established, there is no previous measurement to compare against in the first round.
- A reading error and the absence of traffic cannot be distinguished on the screen. When the counter reading fails, the dashboard does not show an error, it shows the related values as zero. In a section that constantly reads zero, whether there is really traffic or not should be verified over Event Logs.
