
Smarter by Design.Simpler for Business
Home & Dashboard
What Is Home & Dashboard?
Home & Dashboard is the screen that comes when the TR7 interface is logged in to, and it gathers the general status of the device in panels for which a time range can be selected. The screen is a single dashboard; its content is divided into view tabs. Some of the tabs read the device's own hardware measurements (processor, memory, storage, network), while others give the totals of all the vServices and DNS services on the device. Above the title of the total panels, All vServices or All DNS Services is written; in the tables that list the same metric as one row per service, vService Distribution is written.
The screen is device-wide: the detail of a single service is examined not here but on that service's own dashboard. No transition to the screen of the related vService or DNS service is offered from a value in the panels; the detail is read from the Dashboard tabs of the Load Balancer vServices, WAF-Protected vServices, Bot/DDoS Protected vServices, AGS-Enabled vServices and GTM screens. Which tabs will be displayed is determined by the permission areas of the user: the tab of an area for which there is no permission does not take place among the view tabs at all.
The time range selector, the refresh, the settings, the template menu and the arrangement of the panels are carried out from the same toolbar in all ten tabs; for this reason Screen Controls is explained once, on this page. The panel layout and the toolbar preferences are saved to the user account and are restored in the following sessions; the open tab is also saved, but the screen comes with Summary again on every opening.
10
View Tabs
Three of them carry subtabs; the total of the ready layouts is 17
131
Ready Panels
On a physical device with three storage areas and hit counting off; up to 32 panels are added per tab
10 Years
Measurement History
It starts from per-second recording and is kept with a coarsening resolution for up to ten years
Permission Scope
Access condition
The tabs look only at the permission areas of the user
A Single Screen
Scope
The device hardware, the vService traffic and the WAF, AGS and DNS totals are monitored from the same dashboard
On the Device
Data Source
The measurements are read from the device's own archives; no external collector or additional server is set up
14
Ready Time Ranges
From 5 minutes to 5 years; in addition, a free duration and an absolute date range
Per User
Layout
The tab layout and the toolbar preferences are saved to the account and are valid in another browser as well
Why This Screen?
The status of a device is not read from a single number: the load of the hardware, the traffic carried by the vServices, the results produced by the security modules and the responses of the DNS services are measured separately. The home page gathers these measurements on a single dashboard and has all of them read with the same time range; in this way, questions such as "did the processor also rise when the requests increased" and "did the jump in the number of blocked requests come with the traffic increase" are answered without changing the screen.
| Difficulty | The answer of the home page |
|---|---|
| The measurements being spread over different screens | The hardware, the vService, the WAF, the threat protection, the AGS and the DNS totals are gathered in ten view tabs, on a single dashboard. |
| The need for retrospective examination | The measurements are kept with a coarsening resolution for up to ten years; 14 ready ranges, a free duration and an absolute date range are offered. In the line view, the period of interest is narrowed by dragging along the time axis. |
| The burden of setting up an additional monitoring infrastructure | The measurements are kept in the device's own archives and the collection runs on the device; no external collector, database or additional server is set up for the dashboard. |
| Dependence on the permission scope | The visibility of the tabs looks only at the permission areas of the user; the module being on or a defined service being present is not required. |
| Every operator having a different priority | The panels are added, removed, moved and resized; 16 custom tabs are created per user. The layout and the preferences are saved to the user account. |
| Permission separation in the team | The tab of an area for which there is no permission does not take place in the tab bar at all, and its panel is not created at all; the same dashboard shows every user as much as they can see. |
| Reading the instant value and the trend together | The same metric is shown as Digital, Line Chart, Mini Chart, Stat Table, Pie Chart, Bar Chart, Arc Gauge, Map and Heatmap; the MIN/MAX band keeps short-term jumps visible in wide ranges. |
| Two devices in a cluster setup | With the Source setting, the values of a single device or, with the Both devices option, of both of them together are read. |
| Monitoring while the dashboard is not open | The live measurement widgets added to the Header Bar are fed from the panel catalog of the home page; the same values are shown continuously on the bar. |
| The detail of a single service | The home page gives the device-wide picture; for a single vService, Backend Service or DNS service, that object's own Dashboard screen is used. |
How are the measurements collected and stored?
The panels do not run a live query; they read the measurement archives that the device continuously updates in the background. The archives are of a fixed size: as the data ages, it is reduced to a coarser resolution and stored, so while the history grows, the disk usage stays constant.
| Measurement family | Fine-resolution history |
|---|---|
| The processor and network counters (the CPU Usage, CPU Load, CPU Cores and Network panels) | Per-second resolution 1 minute, five-second resolution 1 day, fifteen-second resolution 3 days. |
| Memory, load average, temperature and storage (the Memory and Disk panels together with System Load, CPU Temperature) | Fifteen-second resolution 3 days, per-minute resolution 14 days. |
| The DNS measurements (GTM) | Five-second resolution 24 hours, per-minute resolution 14 days; in the country breakdown, five-second resolution 60 seconds. |
| The vService and AGS totals (vServices, AGS) | Per-second resolution 1 minute, five-second resolution 24 hours, fifteen-second resolution 3 days, per-minute resolution 14 days; in the country and network type breakdowns, per-minute resolution 1 day. |
| The WAF totals (WAF) | In the blocked request, detected attack and inspection distribution panels, per-second resolution 1 minute, five-second resolution 24 hours, fifteen-second resolution 3 days, per-minute resolution 14 days; in the category and OWASP panels, per-minute resolution 7 days, in the country map 1 day. |
| The threat protection totals (L7 DDoS & Threat Protection) | Per-second resolution 1 minute, per-minute resolution 1 day, five-minute resolution 1 week. |
In all the families, the older ranges are kept with a coarsening resolution for up to ten years. The reading frequency also changes according to the family: the system counters are read in two-second rounds and the DNS measurements every five seconds; the round of the vService and AGS totals extends to 20 seconds together with the number of vServices on the device. In the Scope and Limits section of every tab, the values belonging to that tab are written.
Access to the Home Page
- The Home shortcut on the left of the Header Bar is clicked.
- The home page opens with the first view tab that the user can see; this tab is Summary.
- For another view, the related tab is selected from the tab bar.
Home shortcut is located in the default layout of the Header Bar. The same screen is also opened with the Dashboard link on the bottom row of the Configuration Menu. The home page does not take place as a separate node in the navigation tree and the search of the Configuration Menu; it does not have its own category in the Left Monitor Panel either, because the panel offers a transition only to the screens of individual objects (vService, Backend Service, interface, DNS service).
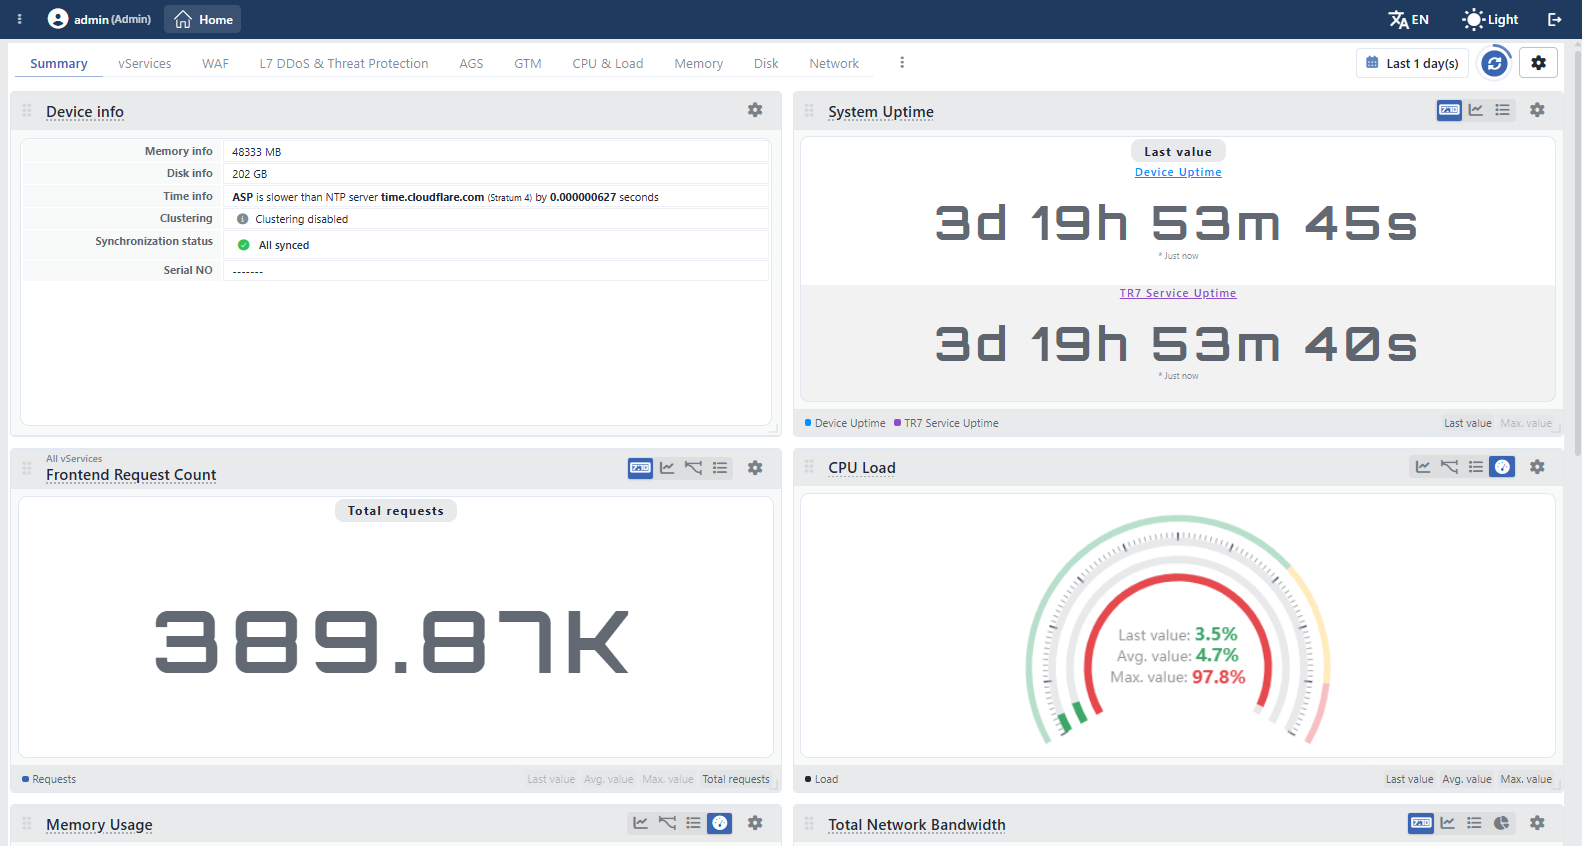 Home & Dashboard
The tab bar can be two rows
The view tabs are located on the left of the toolbar. The vServices, AGS and GTM tabs carry subtabs: when one of these tabs is selected, the tab bar opens a second row and the subtabs of the group are listed in this row. Clicking the group tab in the upper row opens the first subtab of the group every time; the last opened subtab is not remembered. In the tabs that do not have a subtab, the second row is not displayed.
The templates created by the user are added to the end of the upper row and carry a dot mark at the beginning of their names. Long tab names are shortened with an ellipsis; when the tabs do not fit in the row, the tab bar is scrolled horizontally.
View Tabs
The tabs on the left of the toolbar group the panels according to their subjects; the home page opens with the Summary tab. The names and the order of the tabs are exactly the same as the subpages of this section.
 View Tabs
| Tab | Content | Required Permission |
|---|---|---|
| Summary | Nine panels that bring together the device information, the uptime and the request, processor, memory, network, AGS session and DNS query totals. | It is displayed unconditionally; each of the nine panels is bound to its own permission area. |
| vServices | The traffic, distribution and source IP totals of all the vServices; 25 panels in the Traffic, Distribution and Source IP subtabs. | Load Balancer |
| WAF | The blocked request, detected attack, inspection distribution, category, OWASP and country totals of the WAF-protected vServices; eight panels. | WAF |
| L7 DDoS & Threat Protection | The threat status, bot score, protection result, trigger breakdown, reputation category, challenge and quarantine totals; fourteen panels (the threat status table is conditional). | Load Balancer |
| AGS | The session, authentication, lockout and multi-step verification totals of the vServices whose AGS is on; 24 panels in the Sessions, Lockouts and MFA subtabs. | Load Balancer |
| GTM | The query, response, cache, latency and forwarding totals of all the DNS services; 18 panels in the Traffic, Responses, Performance and Forwarder subtabs. | GTM |
| CPU & Load | The processor usage breakdown, processor load, load averages, temperature and per-core usage of the device; five panels. | Settings |
| Memory | The memory usage ratio, the memory breakdown and the swap area occupancy of the device; three panels. | Settings |
| Disk | The occupancy and file record ratios of all the storage areas together with the performance panels per area; 18 panels on a device with three areas. | Settings |
| Network | The interface diagram, the total bandwidth, packet and error counters of all the interfaces together with the TCP connection states; seven panels. | Network |
The visibility of the tabs looks only at the permission areas of the user. In a user who does not have the permission, the tab is not shown as passive, it does not take place in the tab bar at all.
A tab being visible does not mean that data is produced
The tabs do not look at whether the related module is used on the device: the license status, whether a protected vService is present, whether a defined DNS service is present and whether a forwarder is assigned on the services do not affect the opening of the tab. In these situations, the tab still opens, the panels are laid out and No data or No-data is displayed in the value sections.
Division of Labor Between Tabs
How is the device? Summary · CPU & Load · Memory · Disk · Network
Summary gathers one or two basic panels from every subject on a single screen; the detail is read from the four system tabs. These tabs measure not the vService traffic but the device's own processor, memory, storage areas and interface counters.
How much is the traffic? vServices · GTM
vServices gives the request, connection, session, bandwidth, TLS, compression and cache totals of all the vServices; GTM, on the other hand, gives the query, response, cache and latency totals of all the DNS services. Both of them show where the traffic comes from with country and breakdown panels.
Is there an attack? WAF · L7 DDoS & Threat Protection
WAF gathers the blocking and detection totals of the application layer attacks together with the category and OWASP breakdowns; L7 DDoS & Threat Protection, on the other hand, gathers the bot score, IP reputation, rate limiting and challenge results. Both tabs offer a distribution table per vService.
Who is logging in? AGS
AGS gives the device-wide table of the access gateway: the number of open sessions and unique users, the authentication results, the account lockouts and the CAPTCHA and one-time code verifications are monitored channel by channel.
Screen Controls
Above the panels, there is a full-width toolbar that controls all the panels of the open tab together. On the left of the bar there are the view tabs and the template menu; on its right there are the time range selector, the refresh button and the settings. In the top right corner of every panel, on the other hand, there are the view icons specific to that panel. These controls are the same in all ten view tabs and the selection made is preserved when the tab is changed.
 Screen Controls
Some of the items found on the vService and DNS service dashboards do not take place on this screen: the preview panel that summarizes the configuration as a flow diagram, the title that carries the name of the service, the service-level ⋮ quick operation menu and the For Detailed Analysis report shortcut on the WAF dashboard are not present. The Mode, Legend, CF and Combine controls in the settings window are also hidden on this screen.
INFO
Menu
The menu at the end of the view tabs holds the operations for the tab layouts (templates); the tooltip of the menu button is Settings. When an upper-row tab that does not carry a subtab or a subtab in the second row is double-clicked, that tab is returned to its default state; the group tabs (vServices, AGS, GTM) do not respond to a double click. When a tab created by the user is clicked with the middle button, the template is removed; both operations ask for confirmation. There is no right-click menu on the tabs.
Create New Template
A new and empty template (tab layout) is created. In the window that opens, a name is given to the template and the template opens the moment it is created.
Duplicate Current
The panel layout of the open tab is copied to a new name.
Edit Template
The name of the open template is edited. The option is active only in the templates created by the user; it is passive in the ready tabs. The layout is not changed from this window; the panels are arranged by being dragged and resized directly.
Reset to Default
The panel layout of the open tab is returned to its default state after confirmation is received. The option is active only in the tabs on which a change has been made.
Remove Template
The open template is deleted after confirmation is received. The option is active only in the templates created by the user; the ready tabs are not deleted.
Reset All to Defaults
After confirmation is received, the dashboard is returned to its default state entirely: the templates created by the user are deleted and the panel changes in the ready tabs are undone. All the preferences in the settings window (time range, resolution, automatic refresh, source, height and theme) also return to their default values.
INFO
Last 1 day(s) Time Range
Which time slice the panels will show data for is selected; the default range is Last 1 day(s). The ready ranges are fourteen and extend from 5 minutes (Last 5 minute(s)) to 5 years (Last 5 year(s)): 5 minutes, 15 minutes, 30 minutes, 1 hour, 3 hours, 12 hours, 1 day, 3 days, 7 days, 1 month, 3 months, 6 months, 1 year and 5 years. With Custom Duration below the ready ranges, a free duration is entered; the unit list is minute, hour, day, week, month and year. The selection is applied to all the panels of the open tab together, is preserved when the tab is changed and is saved to the user account.
From the Custom Date Range section, an absolute range is also selected by entering the start and the end in the Start and End fields. Dragging horizontally along the time axis on a panel in the line view gives the same result: the selected section is applied as an absolute range and the whole dashboard is reloaded according to this range.
An absolute range stops automatic refresh
In the ranges selected by entering a start and an end, the panels are not refreshed by themselves; the data is refreshed only with the refresh button. The absolute range is not stored as a user preference either; when the screen is opened again, it returns to the relative range.
INFO
Refresh
The data of the panels in the open tab is reloaded; while the loading continues, the button becomes passive and the panels are refreshed in groups of twenty in order. Automatic refresh is on by default and the panels are updated by themselves every 10 seconds; the remaining time is shown with the progress ring around the button. The tooltip of the button carries the text Auto-refreshing in 7s... while a refresh is being awaited, and Refresh dashboard while automatic refresh is off.
INFO
Settings
The general appearance of the dashboard and the display settings of the panels are accessed. The window is divided into three sections: Data (resolution and automatic refresh), Clustering (source selection; only while the cluster is enabled) and Visual (height and theme). All the selections made in this section are saved to the user account and are valid in all the view tabs.
Chart resolution
The resolution (data point density) of the charts is selected: High resolution (1,440 points), Standard resolution (720 points, default) or Low resolution (360 points). A high resolution provides a more detailed display, and a low resolution a faster one.
Auto-refresh
The self-refresh interval of the panels is set: Disabled, 5s, 10s (default), 30s or 60s.
Source
In cluster setups, the data of which device will be read is selected. The options are the name of this device, the name of the peer device and Both devices; the default is Both devices. While Both devices is selected, whether the data of the two devices will be shown summed or as separate series per device is determined by the definition of the panel itself and the selected view; a setting that changes the combination form is not offered on this screen. Which form is used panel by panel is written on the page of every tab. This section is displayed only while the cluster is enabled.
Height
The height of the panels on the screen is set: 200px, 250px, 300px (default), 350px and 400px. In the list, 450px and 500px also appear; since these two options carry the 400px value, the height stays as 400px. The selection is applied to all the panels in the open tab together.
Theme
The display theme (color scheme) of the charts is selected: Professional (default), Corporate, High Contrast, Monochrome Blue and Colorblind Safe.
INFO
Add Visualization
With the Add Visualization card at the end of the layout, a new panel is added to the open tab. In the Dashboard Section window that opens, there are four fields:
| Field | What is selected |
|---|---|
| Section | The panel to be added. The list is limited to the panels within the scope of the open tab; in the Summary tab, on the other hand, all the panels of the home page are listed. |
| Visualization Type | The display form of the panel. The list is limited to the views offered by the selected panel and is updated by itself when the panel is changed. |
| Row Span | The row height of the panel: Default, 0.5, 1, 2 or 3. When 0.5 is selected, the card goes down to half height; at this size, the title row and the summary strip are displayed when the edge of the card is hovered over. |
| Column Span | The column width of the panel: Default, Full Row, 0.5, 1, 2, 3 or 4. |
At most 32 panels are added to a tab; when the limit is reached, the Cannot add more than 32 visualizations warning is displayed. At most 16 custom templates are created per user.
INFO
Panel View Icons
With the icons in the top right corner of every panel, the display form of the data is changed. The icon group is displayed only if the panel offers more than one view and only the views suitable for that data take place; the order of the icons is the same in every panel.
| Icon | View | What does it do? |
|---|---|---|
| 7:10 | Digital | Emphasizes the summary values with large figures; a separate section is displayed for every summary that is on and a separate row for every series. |
| Line Chart | Shows the change of the metric over time; in multi-series panels, it can be shown as stacked areas. | |
| Mini Chart | Shows the metric as a compact trend curve; it is offered only in the panels that carry a single series. | |
| Stat Table | Lists the series with their summary values in a sorted table; it is sorted by that column when the column header is clicked. | |
| Pie Chart | Shows the proportional share of the series within the total. | |
| Arc Gauge | Emphasizes a single percentage or ratio value with an arc-shaped gauge. | |
| Bar Chart | Compares the series with bars side by side. | |
| Map | Shows the geographic distribution on a world map; the density is colored on a country basis. | |
| Heatmap | Shows the series as color bands on the time axis. |
The Device info, Disk Capacity and Network Topology panels offer a single view (Info); the icon group is not displayed on these three cards. The Status Timeline and Linear Gauge views are not present in any panel of the home page.
The icon of the panel offers two operations: Edit opens the Dashboard Section window of the panel, and Remove removes the panel from the tab; Remove does not ask for confirmation. The cards are moved by being dragged from the handle on the left of the title row and are resized from their bottom right corner; during the resizing, a frame that shows the target size and a badge in the 1 × 0.5 form are displayed. When the card title is hovered over, the description that explains what the panel measures is displayed as a tooltip. All the layout changes made are saved to the user account by themselves; there is no separate saving operation.
INFO
Panel Metric Columns
Under every card, the series shown and the summary values of that metric are listed as a strip.
| Summary | Meaning |
|---|---|
| Last | The last (most recent) value in the selected range |
| Avg. | The average value over the range |
| Min. | The lowest value in the range |
| Max. | The highest value in the range |
| Total | The total accumulated over the range |
The summary names change according to the metric: while the general names are Last value, Avg. value, Min. value, Max. value and Total, in the request panels they are displayed as Total requests and Avg. req/s, in the connection panels as Total connections and Max. connections, in the session panels as Total sessions, in the query panels as Total queries and Avg. q/s, and in the packet panels as Total packets. In the source IP panels, the summary name carries the measurement window: Last / 10s, Avg / 10s, Max / 10s.
Which summaries come open changes according to the panel and the selected view; the Stat Table view lists all the available summaries as columns. When a closed summary in the strip is clicked, that summary opens, and when an open summary is clicked, it closes. By clicking the series names in the same strip, the series are hidden and shown again one by one; in the Map view, the strip carries only the first series, the rest are gathered in the +N · Other ▾ item at the end of the strip and open when it is clicked, and close again with ▴. In the other views, all the series are listed in the strip.
At the very left of the strip, there is a badge only in some panels in the line view: if the archive of the metric keeps both the highest and the lowest value, MIN/MAX is written, and if it keeps only the highest value, MAX. When the badge is clicked, a band consisting of the highest (and, if it is kept, the lowest) values is added behind the average line; in this way, short-term jumps stay visible in wide time ranges. The badge is not offered in stacked charts, in the metrics that do not archive the highest value and when the number of visible series exceeds two; it is displayed again when the series are hidden from the legend. In cluster setups, while Both devices is selected as the source and the values are not plotted separately per device, the badge is not offered at all, because the envelope calculation would be misleading.
On the cards for which there is no value in the selected time range, a different text is displayed according to the display form: No data in the Digital view, and No-data in the Pie Chart, Bar Chart, Arc Gauge and Heatmap views. If the metric has never been recorded, the text No data recorded for the selected time range. is displayed inside the card.
The summary strip does not appear in the line view of multi-series panels
The summary boxes open only if there are at most six series in the panel. In the line view of crowded panels such as Memory Distribution (seven series), TCP Connection States (ten series), Detected Attacks by Category and the country panels, no summary is shown; in these panels the summaries are read from the Stat Table view.
Scope and Limits
INFO
- The permission hides the tab completely. Five permission areas are used in the visibility of the tabs: Load Balancer, WAF, GTM, Settings and Network. The AGS tab does not have a permission area of its own, it is displayed with the Load Balancer permission. The Summary tab opens unconditionally, but its nine panels are bound one by one to their own permission area: since none of the panels is bound to the WAF permission, in a user who has only the WAF permission and in a user who does not have any area, the tab opens only with the Add Visualization card.
- No license and module check is made. The tabs look only at the user permission; whether the related module is licensed on the device and whether a protected vService or a defined DNS service is present do not affect the opening of the tab.
- The layout is saved to the user account. The open tab, the toolbar preferences, the panel changes made in the ready tabs and the user templates are written in a single record, on the device, to the user account; the record is not kept in the browser and is valid when it is logged in from another browser with the same account as well. The record is common to all ten tabs of the home page and is not shared with other dashboards.
- The tab selection is not remembered on return from another screen. When the home page is left and returned to, the screen opens with Summary again.
- There is a limit of 32 panels per tab and 16 templates per user. When the limit is reached, the
Cannot add more than 32 visualizationsorCannot add more than 16 templateswarning is displayed. - A version change resets the layout. When the version of the dashboard layout changes, the saved layout, the preferences and the user templates are considered invalid and the dashboard opens in its default state.
- The confirmation behavior changes according to the operation. Template resetting, template deletion and the resetting of the whole dashboard ask for confirmation; the Remove in the card setting is applied without asking for confirmation.
- There is no transition to another screen from the cards. By clicking a service row in the distribution table, that service's dashboard is not opened. The only clickable item is the synchronization status row of the Device info panel in the Summary tab.
- The Header Bar widgets read the same panel definitions. The live measurement widgets added to the Header Bar are fed from the panel catalog of the home page; for the detail, see Header Bar.
- The Left Monitor Panel does not connect to this screen. There is no home page category in the panel; when an object is opened from the panel, the time range hint carried to that object's dashboard does not reach the home page either.
Subpages
Summary
The default opening tab: the device information, the uptime and the request, processor, memory, network, AGS session and DNS query totals.
→
vServices
The traffic totals of all the vServices: the Traffic, Distribution and Source IP subtabs, the distribution tables per vService.
→
WAF
The blocked request, detected attack, inspection distribution, category and OWASP totals of the WAF-protected vServices.
→
L7 DDoS & Threat Protection
The threat status, the bot score and its factors, the protection results, the DDoS trigger breakdown, the IP reputation, the CAPTCHA and quarantine totals.
→
AGS
The session, authentication, lockout and MFA totals of the vServices whose AGS is on: the Sessions, Lockouts and MFA subtabs.
→
GTM
The query, response, cache, latency and forwarding totals of all the DNS services: the Traffic, Responses, Performance and Forwarder subtabs.
→
CPU & Load
The processor usage breakdown, the processor load, the load averages, the temperature and the per-core usage of the device.
→
Memory
The memory usage ratio, the application, cache, buffer and free memory breakdown of the memory, and the swap area occupancy.
→
Disk
The capacity, occupancy and file record ratios of the storage areas together with the latency, operation, transfer and area panels per area.
→
Network
The interface diagram, the bandwidth, packet and error totals of all the interfaces and the TCP connection states.
→
