
Smarter by Design.Simpler for Business
vServices
What Is vServices?
vServices is the view tab that gathers the traffic of all the vServices on the device on a single screen on the TR7 home page. The tab consists of three subtabs: Traffic shows the request, connection, session, bandwidth, TLS, compression, cache and traffic mirroring totals; Distribution shows the country and network type breakdowns of the traffic; and Source IP shows the density values per source IP.
Most of the panels are the device-wide equivalent of the panels on the Dashboard screen of a single vService. Above the title of these panels, All vServices is written and the value is the total of all the vServices. The table that has vService Distribution written above its title, on the other hand, lists the same metric as one row per vService; this table is found only on the home page.
The total panels do not look at whether the related feature is used on the vService: even if there is no TLS termination, no Compression or Cache profile and no Traffic Mirroring rule on the device, the related panel takes place in the tab. Which vService types a panel gathers is stated in the panel descriptions.
3
Subtabs
Traffic, Distribution and Source IP; when the upper tab is clicked, Traffic opens
25
Panels
Traffic 13, Distribution 6, Source IP 6; if hit counting is on, Action Hits is added to Traffic
Device-Wide
Totals
The All vServices panels show the total of all the vServices
Per vService
Distribution Table
Frontend Request Count is listed in a separate row for every HTTP vService
Access to the vServices Tab
- The Home shortcut on the left of the Header Bar is clicked.
- vServices is selected from the view tabs; the tab opens with the Traffic subtab.
- For the other subtabs, Distribution or Source IP is selected from the second row.
For the Header Bar shortcuts, see Header Bar.
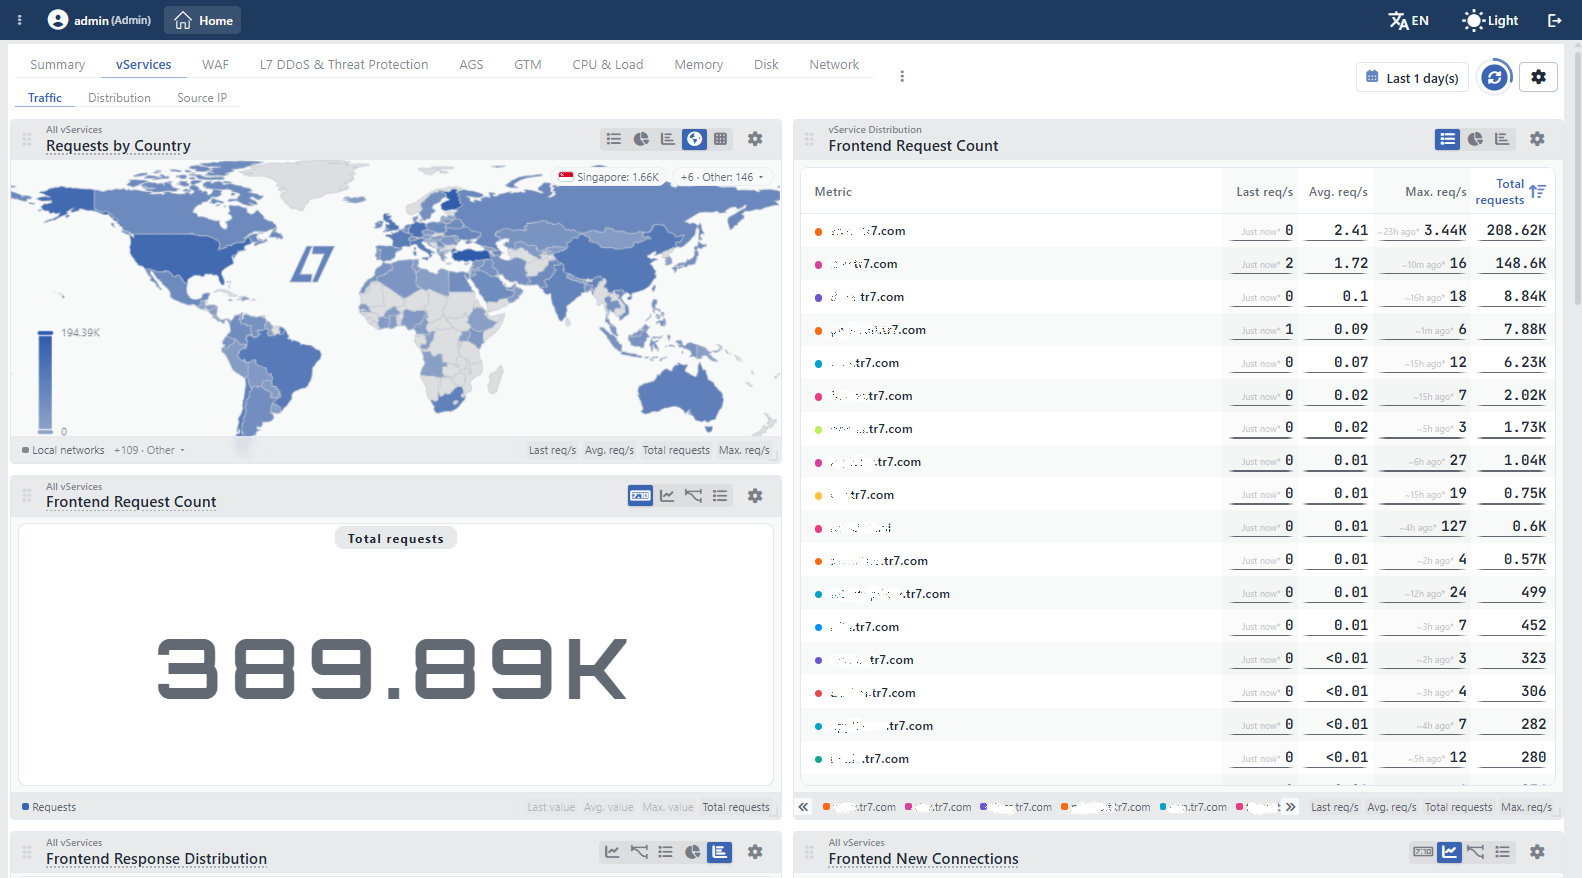 The vServices Tab
The screen controls are common to all the tabs
The time range selector, the refresh, the settings, the template menu and the arrangement of the panels are the same in all the view tabs of the home page; for the detail, see Screen Controls.
Subtabs
| Subtab | Content |
|---|---|
| Traffic | The request, response code, connection, session, throughput, TLS, compression, bandwidth, cache and traffic mirroring totals; the country map and the request table per vService. |
| Distribution | The country maps of the requests and the connections together with the network type category and group tables. |
| Source IP | The connection, request, error and data values per source IP together with the number of active source IPs. |
The tab is displayed if the user has the Load Balancer permission; all the panels in the three subtabs are bound to the same permission. When the vServices tab in the upper row is clicked, Traffic always opens, no matter which subtab was opened before. The second row is displayed only while the vServices tab is selected.
Traffic Tab
There are 13 panels in the Traffic subtab. If Hit Counter is on in at least one of the rules on the device, the Action Hits panel is added to the end of the tab and the number of panels becomes 14. The Requests by Country map has been placed at the beginning of the tab, one card wide and one card high; the Frontend Request Count table grows up to two cards high as the content lengthens. The other panels are one card in size.
The card width changes according to the screen width: as many columns as the number of cards that fit side by side are opened and the cards fill the column. On a screen on which two cards fit side by side, the map covers half of the screen even though it is one card in size.
With Add Visualization, the following panels are also added to this subtab: Connections by Country; the vService Distribution tables for Frontend New Connections, Frontend Concurrent Sessions, Frontend Throughput, SSL Concurrent Connections, SSL New Connections (TPS), vService CPU Usage and vService Memory Usage; Dropped Copies and In-flight Copies.
Requests by Country
Written All vServices above its title, this panel shows the country distribution of the requests coming to all the HTTP vServices according to the location of the source IP on a world map. As a summary, Last req/s, Avg. req/s, Total requests and Max. req/s come open; the map is colored according to the Total requests value. The records that cannot be shown on the map (such as the local networks and the small countries that do not take place on the map) are listed as chips above the map; the record with the highest value is in a separate chip with its name and value (such as Singapore: 1.66K), and the rest are gathered in a single +6 · Other: 146 ▾ chip. When this chip is clicked, all the folded records open and the Show less chip comes in its place. In the strip under the panel, the series legend of the map also takes place; since the number of countries is high, only the first record of the list is shown as a chip and the rest are gathered in the +N · Other chip. When a country is hidden from the legend, the country drops from the map and the color scale is recalculated according to the remaining countries. When the map is dragged and scrolled or zoomed in, it is returned to the initial view with the Recenter / Reset button that appears at the top right. In the panel, the Stat Table, Pie Chart, Bar Chart, Map and Heatmap views are offered.
The connections of the L7 TCP vServices do not enter this total; for the connection equivalent of the country breakdown, the Connections by Country panel is used. For the same panel belonging to a single vService, see Requests by Country.
Frontend Request Count
Written vService Distribution above its title, this table lists every HTTP vService on the device in a separate row; the row name is the name of the vService. The title of the first column of the table is Metric. Since the L7 TCP and Network vServices do not carry a request counter, they do not take place in the table; the listing looks only at the vService type. The columns are Last req/s, Avg. req/s, Max. req/s and Total requests; the table opens sorted by the Total requests column from the largest to the smallest. Next to the Last req/s and Max. req/s values, the time at which the value was measured (such as Just now* and ~23h ago*) is shown in small type.
The sorting is changed by clicking the column header: the first click sorts from the largest to the smallest, the second click from the smallest to the largest, and the third click removes the sorting. The number of rows is not limited; the table is scrolled inside the card. In the strip under the panel, the vService names take place; if the strip overflows, it is scrolled with the « » arrows on its two sides and that row is hidden by clicking a name. When the title is hovered over, a description tooltip does not appear. In the panel, the Stat Table, Pie Chart and Bar Chart views are offered. In cluster setups, the values of the two devices are summed for every vService.
Frontend Request Count
Written All vServices above its title, this panel shows the total of the requests coming to all the HTTP vServices (the Requests series). As a summary, only Total requests comes open. The panel is the same as the panel in the Summary tab; see Frontend Request Count.
Frontend Response Distribution
Shows the responses produced by all the HTTP vServices as six series according to the status code classes: 2xx, 3xx, 4xx, 5xx, 1xx and Other. As a summary, only Total requests comes open. The meaning of the series is the same as on the single vService dashboard; see Frontend Response Distribution.
The panel, which is a stacked line chart in the Summary tab of the single vService dashboard, has been placed here as a bar chart.
Frontend New Connections
Shows the total of the new connections opened per second on all the vServices (the Connections series). All three of the HTTP, L7 TCP and Network vServices enter the total. As a summary, Total connections comes open. For a single vService, see Frontend New Connections.
Frontend Concurrent Sessions
Shows the total of the sessions that are open at that moment on all the vServices (the Current Sessions series). All three vService types enter the total. As a summary, Avg. sessions comes open. The panel, which is a numerical value in the Summary tab of the single vService dashboard, has been placed here as a line chart; see Frontend Concurrent Sessions.
Frontend Throughput
Shows the total data flow passing over all the vServices as a single series (the Throughput series). All three vService types enter the total. As a summary, Last tp/s, Avg. tp/s and Total tp come open; the rates are printed as bits per second and the total as bytes. For a single vService, see Frontend Throughput.
SSL Concurrent Connections
Shows the total of the TLS connections that are open at that moment on all the vServices on which TLS termination is performed (the Concurrent SSL Connections series). As a summary, Avg. connections comes open. For a single vService, see SSL Concurrent Connections.
SSL New Connections (TPS)
Shows the total of the new TLS connections established per second on all the vServices on which TLS termination is performed (the New SSL Connections series). As a summary, Total connections comes open. For a single vService, see SSL New Connections (TPS).
Compression
Shows the total of the data flow before and after compression on all the HTTP vServices to which a Compression profile is assigned: Bytes Before Compression and Bytes After Compression. As a summary, Last data/s, Avg. data/s and Total data come open. For a single vService, see Compression.
Frontend Bandwidth
Shows the total of the amount of data passing over all the vServices as two series: RX (received from the client) and TX (sent to the client). The series are shown stacked; all three vService types enter the total. As a summary, Total data comes open. The panel, which is a mini chart in the Summary tab of the single vService dashboard, has been placed here as a stacked line chart; see Frontend Bandwidth.
Frontend Cache
Shows the total of the cache operations on all the HTTP vServices to which a Cache profile is assigned as two series: Cache Lookups and Cache Hits. As a summary, Last value, Avg. value and Total come open. For a single vService, see Frontend Cache.
Mirror Flow
Shows the total of the copying flow on all the vServices that have a Traffic Mirroring rule as three series: Mirrored, Completed and Skipped. As a summary, Total requests comes open. For the meaning of the series, see Mirror Flow.
The total panels are displayed even if the feature is not used
The SSL Concurrent Connections, SSL New Connections (TPS), Compression, Frontend Cache and Mirror Flow panels take place in the tab even if there is no vService on the device that uses this feature. On the single vService dashboard, these panels are created only if the feature is on; on the home page, on the other hand, if the feature is not present, the panel stays empty: No data is displayed in the value sections of the panels with a Digital view, and the drawing area stays empty in the line charts.
Action Hits
Shows a series for every rule whose Hit Counter is on; the series name is the name of the rule and the value is the total of the hits on all the vServices to which the rule is bound. The series are shown stacked; as a summary, Total comes open. For a single vService, see Action Hits.
The panel is displayed only if there is a rule whose hit counting is on
The panel requires Hit Counter to be on in at least one of the rules on the device. Whether the rule is bound to a vService is not taken into account. If counting is not on in any rule, the panel is not created.
Distribution Tab
There are 6 panels in the Distribution subtab: two country maps and four network type tables. The maps are two cards wide and two cards high; the tables are one card in size. There is no conditional panel in this subtab and no additional panel is offered in the Add Visualization menu.
The repeated panel that takes place in this subtab (its description takes place in the Traffic tab):
- Requests by Country: here it has been placed two cards wide and two cards high. See Requests by Country.
Connections by Country
Written All vServices above its title, this panel shows the distribution of the connections opened to all the HTTP and L7 TCP vServices according to the source country. The Network vServices do not enter the total. As a summary, Last con/s, Avg. con/s, Total connections and Max. con/s come open; the map is colored according to the Total connections value.
The panel, which is placed as a summary table on the single vService dashboard, has been placed here as a map; see Connections by Country.
Requests by Network Type Category
Lists the requests coming to all the HTTP vServices according to the network type category of the source IP. Every row is a category: Datacenter, CDN, Verified Bot, Anonymizer (VPN / Proxy / Tor) and End User. The category names are read from the network type classification that comes with TR7. The columns are Last value, Avg. value, Max. value and Total; the table opens sorted by the Total column from the largest to the smallest. In the panel, the Stat Table, Bar Chart and Heatmap views are offered.
For a single vService, see Requests by Network Type Category.
Requests by Network Type Group
Lists the same requests according to the more detailed network type group. The groups consist of 21 records such as the cloud and hosting providers (Amazon AWS, Microsoft Azure, Google Cloud, Hetzner), CDN, Verified Bot, Tor Exit Node, Residential and Mobile / CGNAT; every group belongs to a category. The columns and the sorting are the same as Requests by Network Type Category. In the panel, the Map view is offered in addition.
For a single vService, see Requests by Network Type Group.
Connections by Network Type Category
It is the equivalent of the network type category breakdown over the number of connections. The connections of the HTTP and L7 TCP vServices enter the total. The categories, the columns and the views are the same as Requests by Network Type Category.
Connections by Network Type Group
It is the equivalent of the network type group breakdown over the number of connections. The connections of the HTTP and L7 TCP vServices enter the total. The groups, the columns and the views are the same as Requests by Network Type Group. For a single vService, see Connections by Network Type Group.
Source IP Tab
There are 6 panels in the Source IP subtab and all of them have been placed as line charts. The first five panels carry two series: Peak (worst source IP) and p95 (bulk upper edge). The values are not a per-second rate but counts accumulated in a 10-second measurement window; as a summary, only Avg / 10s comes open; Last value and Max. value are opened from the strip under the panel and when they are opened they are written as Last / 10s and Max / 10s. There is no conditional panel in this subtab and no additional panel is offered in the Add Visualization menu.
The values are the total of the vServices, they do not belong to a single source IP
On the single vService dashboard, Peak (worst source IP) is the value of the busiest single source IP on that vService. On the home page, on the other hand, the Peak and p95 values of every vService are summed; for this reason the Peak (worst source IP) series shows the total of the busiest source IP values of the vServices. If the same source IP sends traffic to more than one vService, it is counted separately for every vService in the Active Source IPs panel.
In cluster setups, the values of the two devices are not summed in the panels in this subtab, every device is shown as a separate series.
Connections per Source IP
Shows the number of connections opened per source IP in ten seconds. The HTTP and L7 TCP vServices enter the total. For a single vService, see Connections per Source IP.
Requests per Source IP
Shows the number of HTTP requests sent per source IP in ten seconds. Only the HTTP vServices enter the total. For a single vService, see Requests per Source IP.
Errors per Source IP
Shows the number of HTTP error responses received per source IP in ten seconds. Only the HTTP vServices enter the total. For a single vService, see Errors per Source IP.
Outgoing Traffic per Source IP
Shows the amount of data sent per source IP in ten seconds as bytes. The HTTP and L7 TCP vServices enter the total. For a single vService, see Outgoing Traffic per Source IP.
Incoming Traffic per Source IP
Shows the amount of data received per source IP in ten seconds as bytes. The HTTP and L7 TCP vServices enter the total. For a single vService, see Incoming Traffic per Source IP.
Active Source IPs
Shows the number of distinct source IPs that sent traffic in the last window (the Active Source IPs series). The HTTP and L7 TCP vServices enter the total. As a summary, Avg. value comes open. For a single vService, see Active Source IPs.
Scope and Limits
INFO
- The tab is displayed only with the Load Balancer permission. In a user who has only the WAF permission, the tab does not take place among the view tabs at all.
- The totals have a different scope according to the vService type. Only the HTTP vServices enter the request, response code, country request map, network type request tables, compression and cache panels; the HTTP and L7 TCP vServices enter the connection map, the network type connection tables and the source IP panels; all three vService types enter the new connection, concurrent session, throughput and bandwidth panels.
- The totals consist only of the vServices that send data. A vService whose feature is off does not contribute to the total; if no vService on the device uses the feature, the panel is still displayed but stays empty.
- The combination in a cluster changes according to the panel. In the Traffic and Distribution panels, the values of the two devices are summed; in the Source IP panels, every device is shown as a separate series.
- The data collection interval widens according to the number of vServices. While there are up to 20 active vServices on the device, the totals are calculated once per second; as the number of vServices increases, the interval gradually extends to 20 seconds.
- In the country and network type breakdowns, the fine-resolution history is shorter. While the per-minute resolution goes 14 days back in the traffic panels, it is kept for 1 day in the country and network type breakdowns.
- The subtab selection is not remembered. On every click on the vServices tab in the upper row, Traffic opens; when another screen is gone to and the home page is returned to, Summary opens.
- There is no transition to another screen from the cards. By clicking a vService row in the vService Distribution table, that vService's dashboard is not opened; for a single vService, the Dashboard screen is used.
